
TECHNICAL ANALYSIS
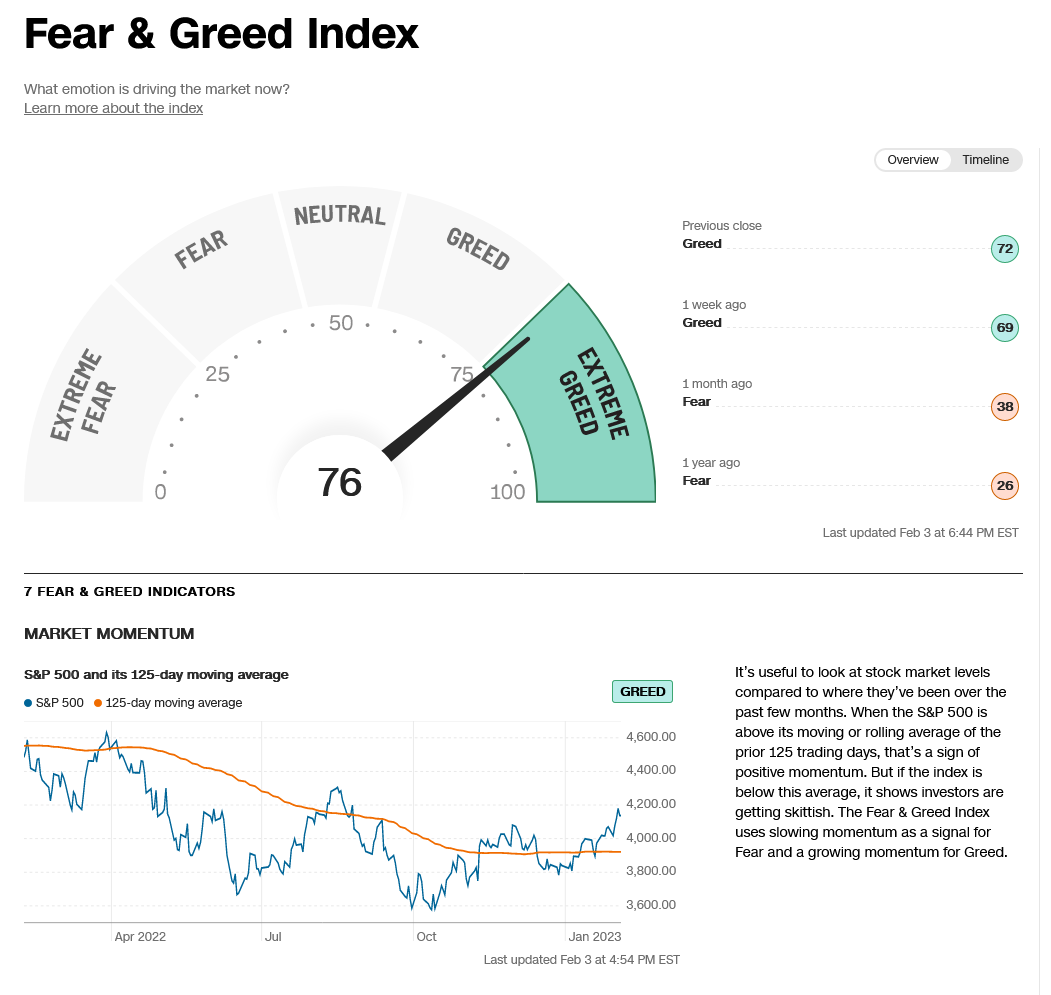
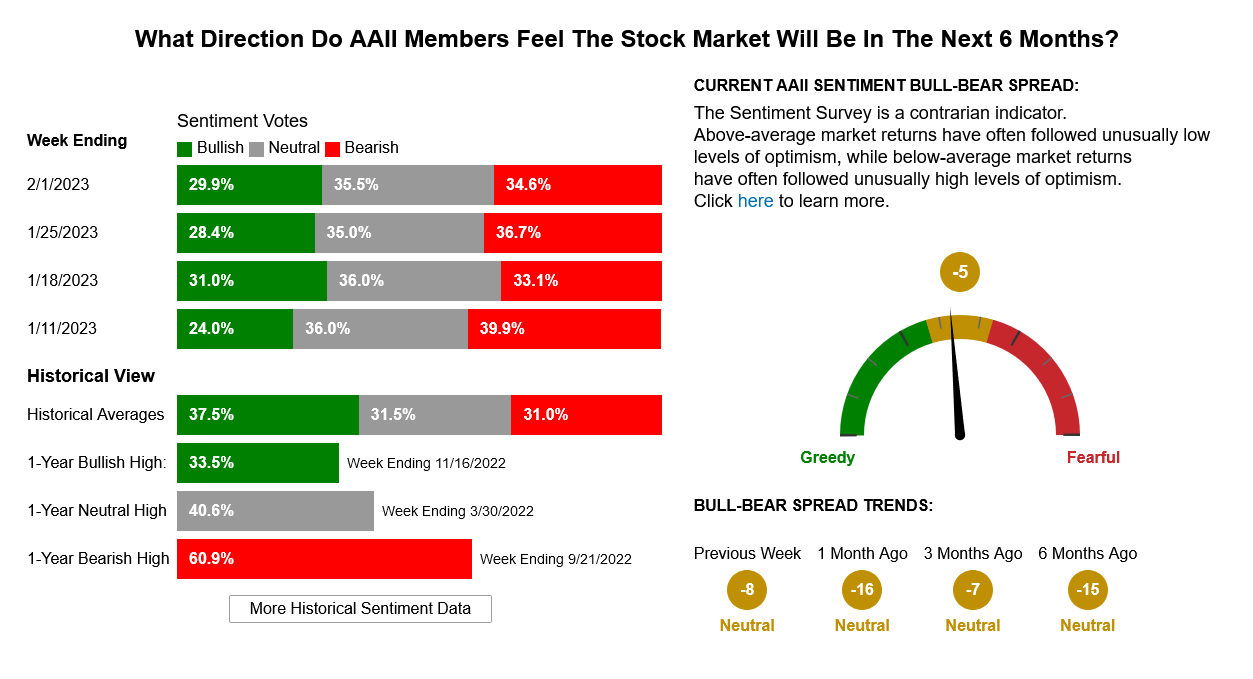
The DJIA traded a whipsaw week and closed down -0.15% as the blue chips once again lagged the S&P, Nasdaq and Russell…which closed up +1.62, +3.31 and +3.88 respectively. Sentiment remains slightly neutral while momentum indicators have turned toward ‘greed’ with the 52-week high/low reaching an extremely frothy +2.90 on last Friday’s close. The Dow remains stuck within a nine-week trading range with the weekly stochastics still in a slow downtrend from the December ‘22 highs. The S&P is on an upside breakout from the triangle pattern that had formed on the charts with prices trading to the highest levels seen since last August. The weekly stochastics have hooked higher with the rally. For an interesting take on the ‘self-fulfilling prophecy’ of a “Recession,” check out this article. And, the S&P index has registered the best January since 2019 (7.9%) and 1989 (7.1%)….as outlined in this interesting read.
Dow Jones Industrial Average Hourly HLC
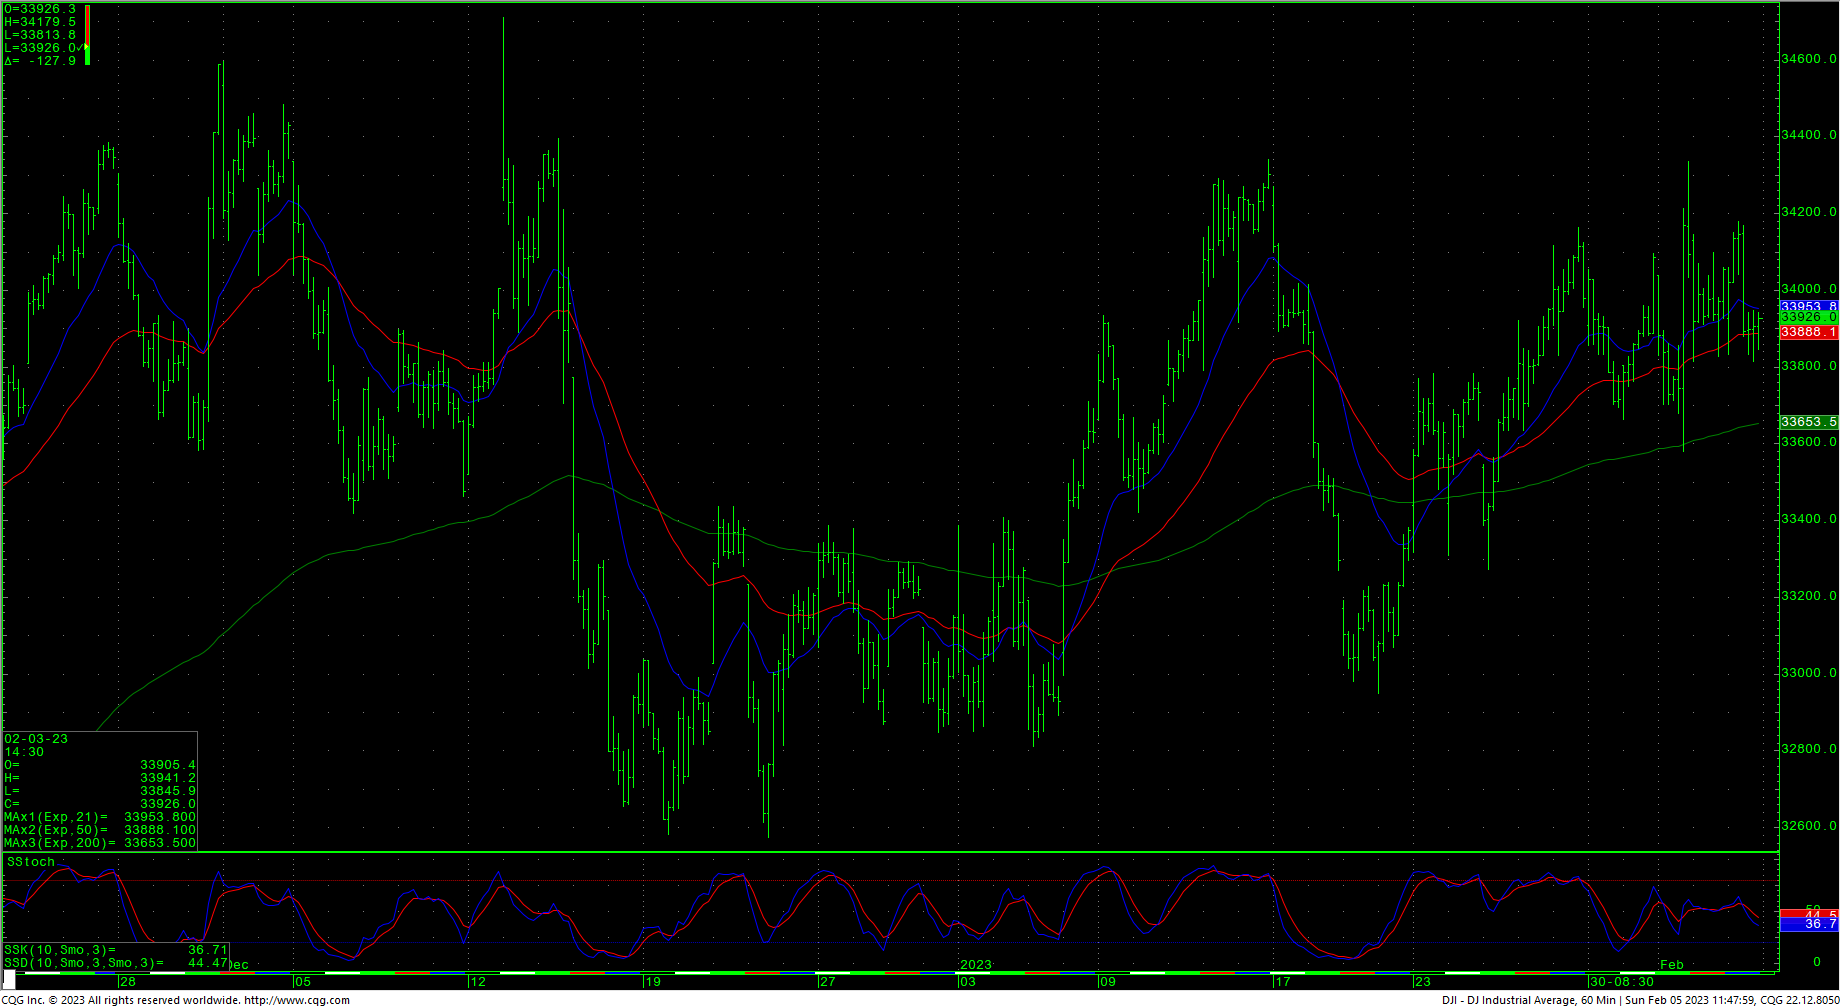
Resistance is at 34020 and 34164. Rallies through the 34164 level should retest 34334/34342 with potential to pivotal resistance at 34395/34400. A drive above 34400 opens counts to 34589 and the December swing highs at 34712 and will open potential to a band of long-term resistance at 34879 through 34995/35000. This band at 35000 is not just a psychological benchmark but is pretty much the final area of weekly resistance before setting the DJIA up to probe the Spring 2022 tops at 35492 and the February 2022 tops at 35824. Closes over 35800/35824 would signal a test of the record highs at 36799 and 36952.
CNN Fear & Greed Index
AAII Investor Sentiment Survey
Dow Jones Industrial Average Weekly HLC

Support is 33813 and near-term pivotal against 33666/33660, A breakdown under 33660 sets up 33457 with potential to critical short-term support of 33613/33600. Closes under 33600 suggest a move to 33249/33240. Closes under 33240 will count to 33015/32990 with potential to critical support at 32600/32573. Below that is support at 32400 and 32343. A breakdown under 32343 opens counts to key short-term support of 32170. A breakdown with closes under 32170 sets up 32099 with longer-term potential toward 31727/31686. Closes under 31686 will open counts into the 30972/30960 level with support of 31423 and 31160.
Resistance
- 34020 **
- 34164 ***↑
- 34207 **
- 34334/34342 *** ↑
- 34395/34400 ** ↑
- 34589 *** ↑
- 34700/34712 *** ↑
- 34879 **
- 34995/35000 *** ↑
- 35190 **
- 35360 **
- 35492 *** ↑
- 35800/35824 *** ↑
- 36799/36952 *** ↑
Support
- 33813 **
- 33720 **
- 33666/33660 *** ↓
- 33450 **
- 33249/33240 *** ↓
- 33146 **
- 33013/33000 **
- 32948 ** ↓
- 32867/32850 *** ↓
- 32800 *** ↓
- 32654 **
- 32600/32573 *** ↓
S&P 500 Cash Index
As mentioned above, the S&P index has hit the highest levels since August ’22 with the market on a technical breakout above the downtrend line on the daily/weekly charts. Resistance remains key at 4155. A further breakout over the 4155 level gives counts to a gap area at 4203 to 4218 and longer-term counts to critical resistance of 4311/4315. Daily closes over 4315 open counts to 4385 with full potential to long-term critical resistance of 4486/4505. Closes over 4505 can carry to 4593 with full potential toward 4637.
S&P 500 Index Weekly HLC
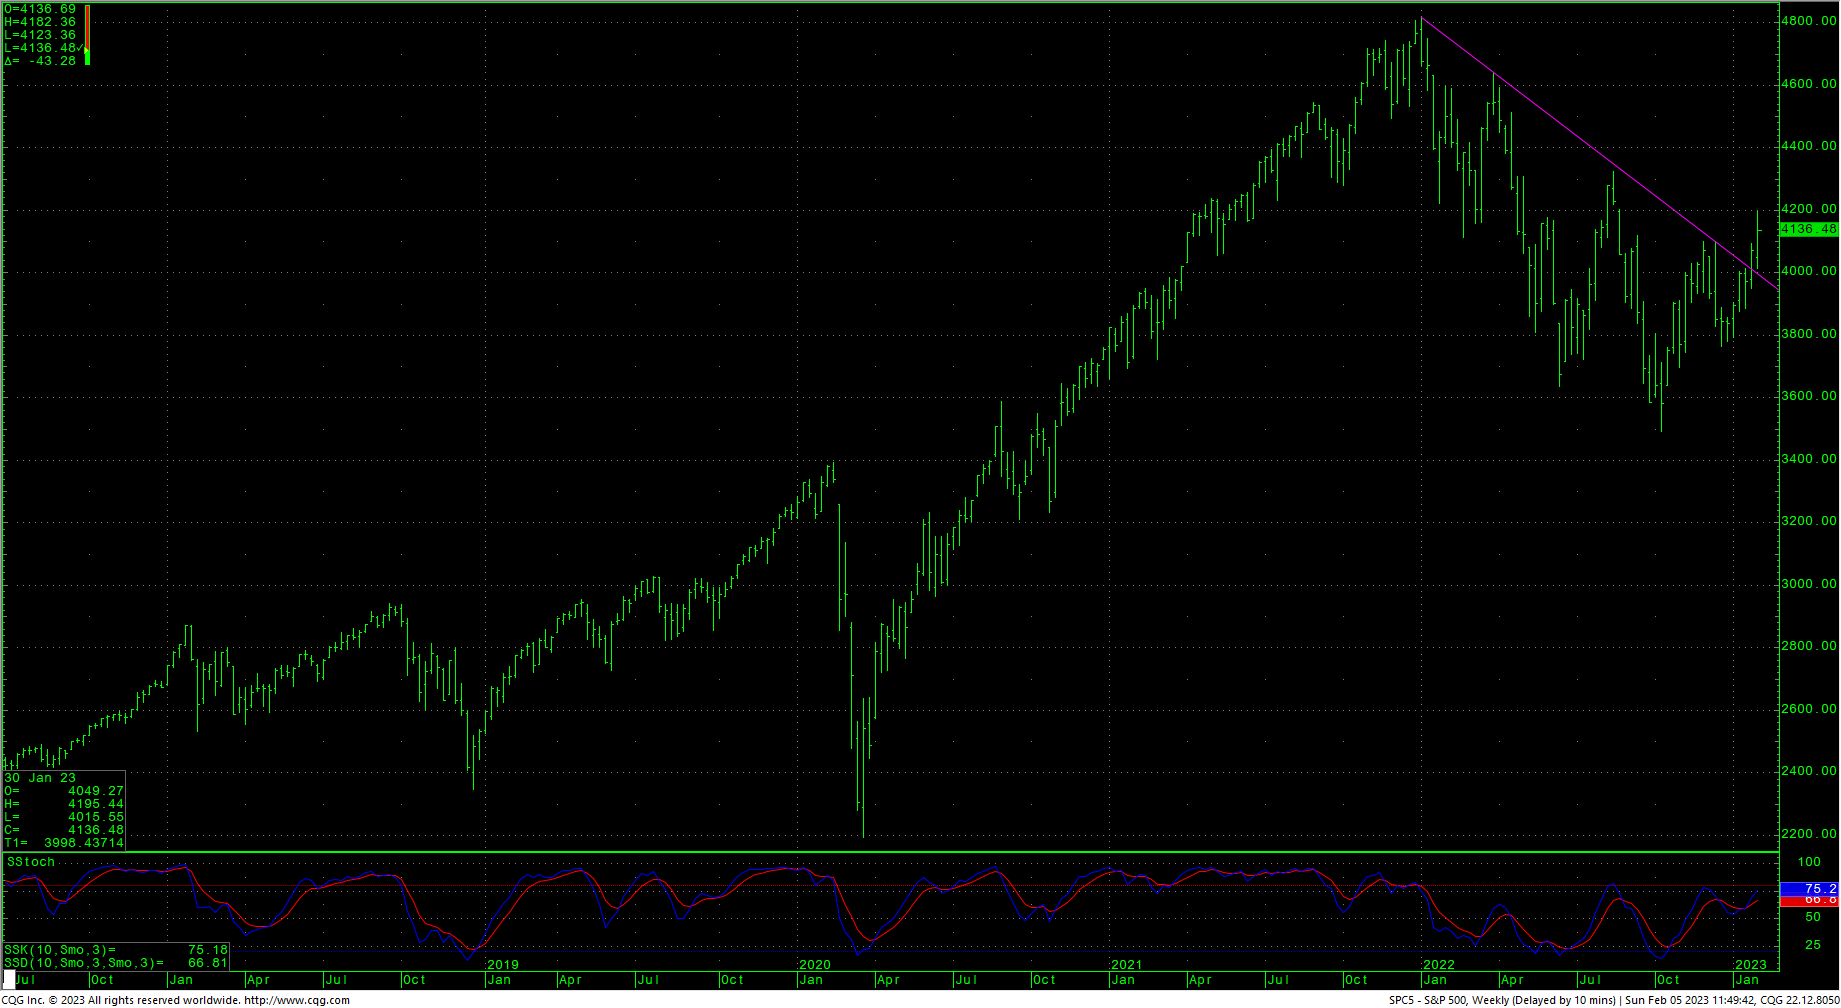
Support is at 4093/4092 and a break under that level can test 4062 and possibly 4031/4028. Closes under the 4028 area suggest 3979 with counts to critical short-term support of 3929/3920 and trading support of 3949. Daily closes under 3920 open counts to 3764 with support at 3799/3797. Under 3764 sets up a retest of intermediate-term support against the 3724/3720 area. Closes under 3720 open counts to 3643/3635. Under 3635 is bearish and signals a test of the lows at 3491.
Resistance
- 4155 *** ↑
- 4195 ** ↑
- 4203/4218 ***
- 4311/4315 *** ↑
- 4350 **
- 4385 *** ↑
- 4430 **
- 4486 *** ↑
- 4505 *** ↑
- 4593 **
- 4637 *** ↑
Support
- 4093/4092 *** ↓
- 4062 ***
- 4031/4028 *** ↓
- 3979 ***
- 3949 **
- 3929/3920 *** ↓
- 3855/3850 **
- 3815 **
- 3799/3797 *** ↓
- 3764 *** ↓
- 3724/3720 *** ↓
- 3643/3635 *** ↓