TECHNICAL ANALYSIS
Major Indices Week of April 21, 2023
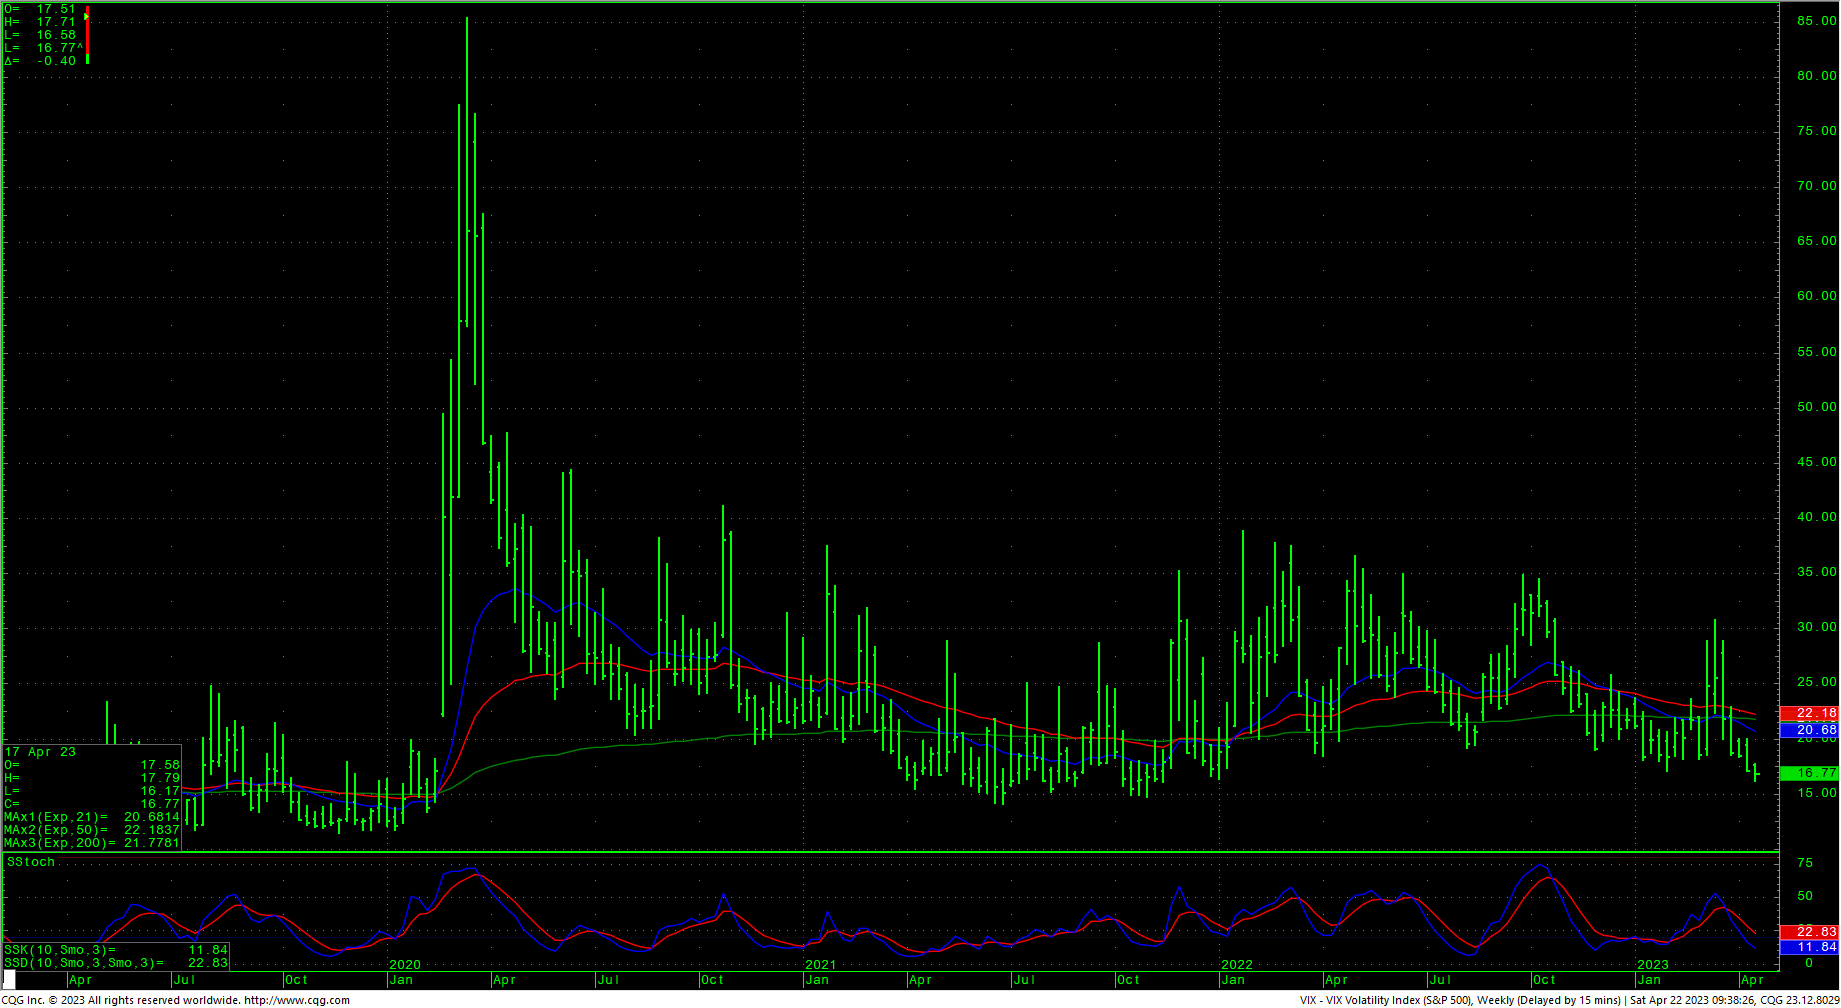
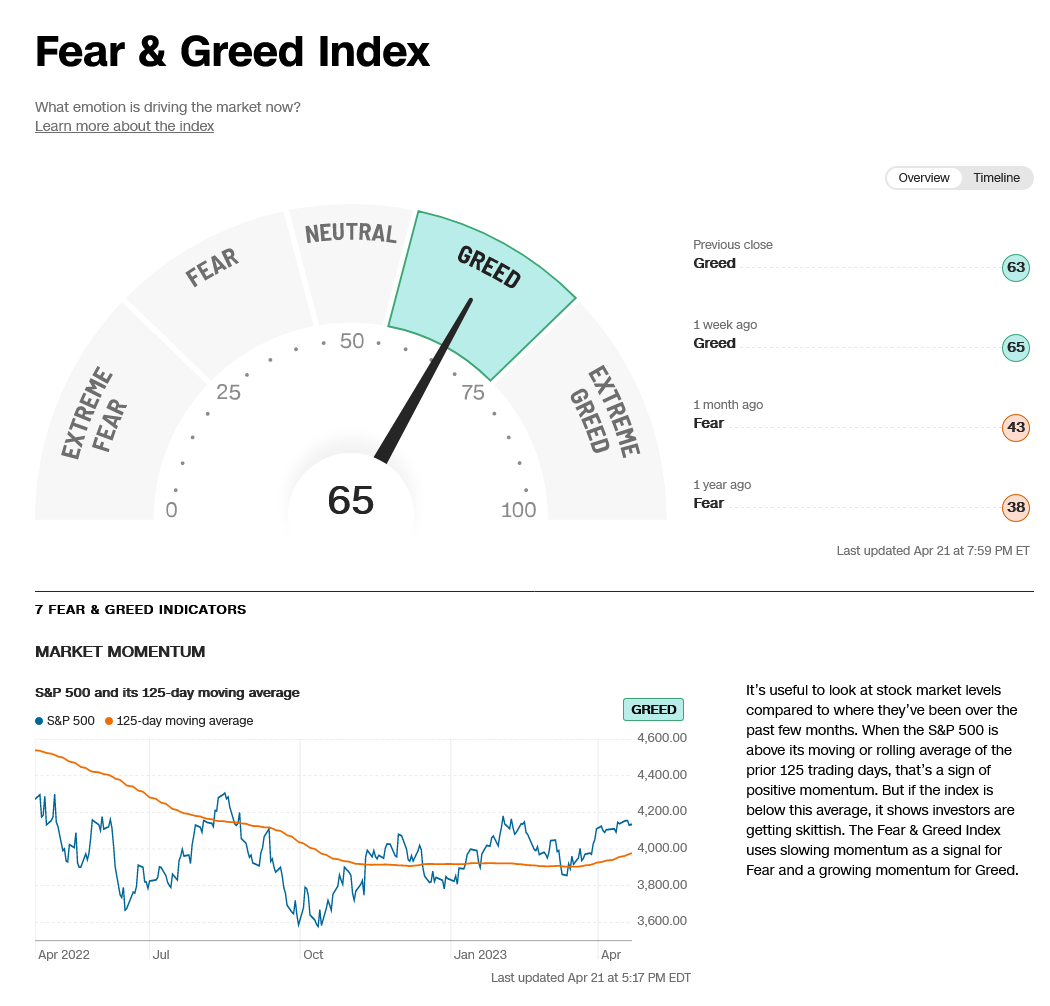
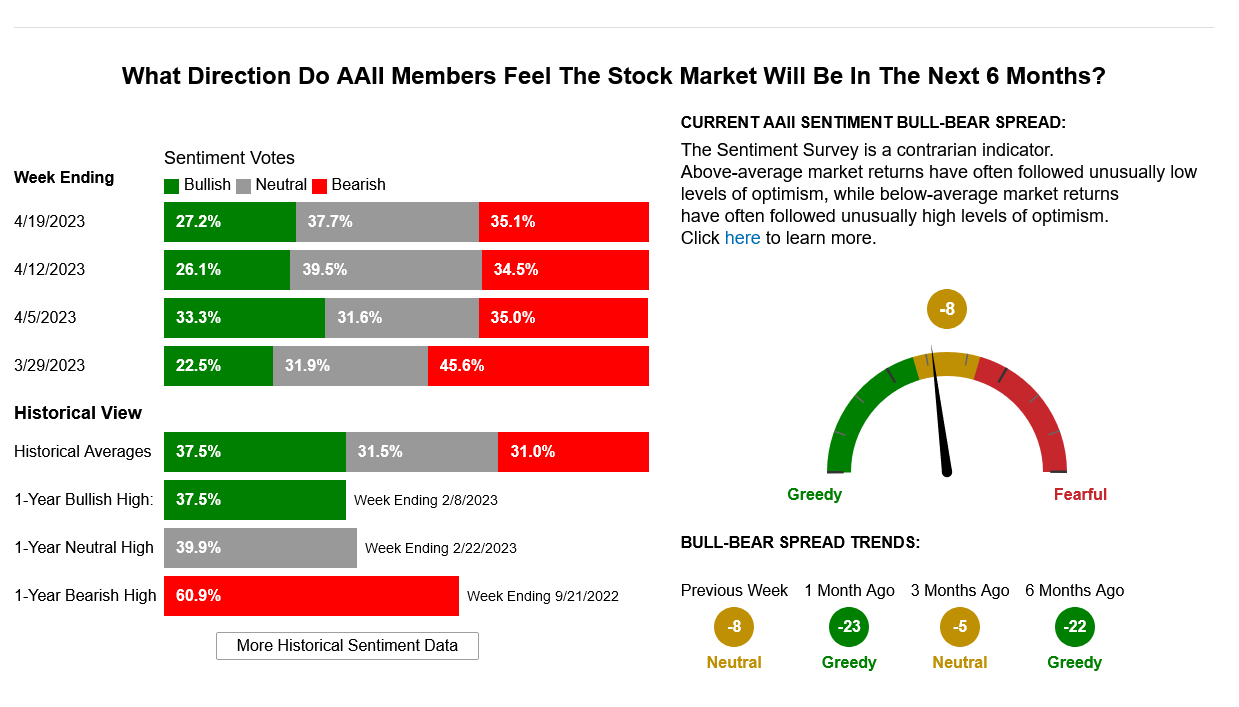
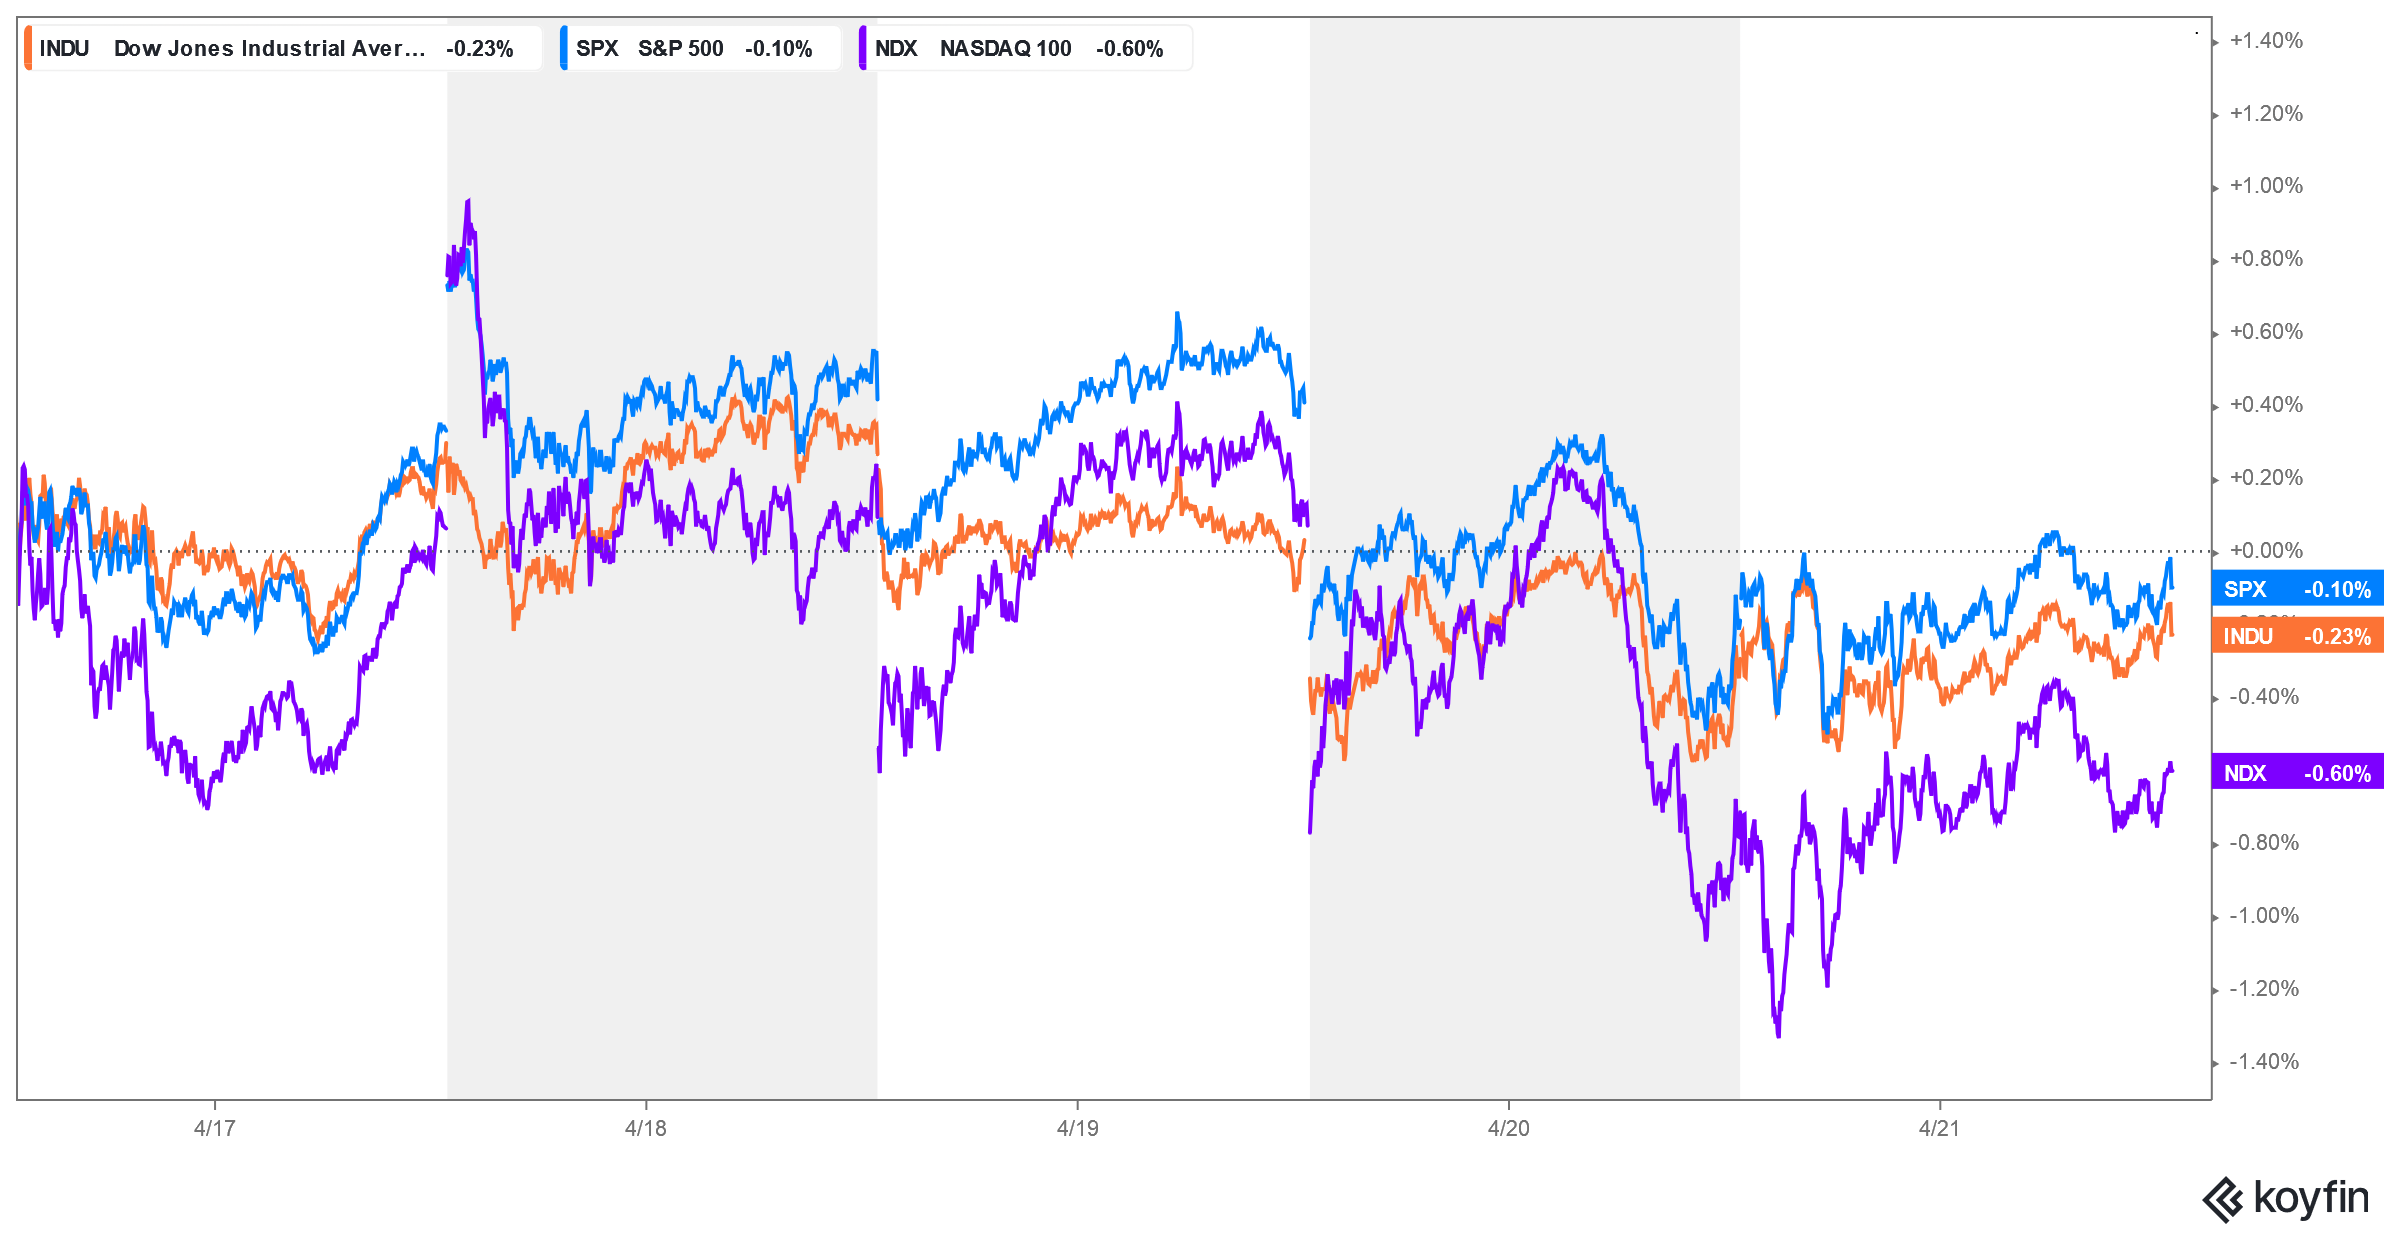 Stocks ended the trading week flat in extremely tight weekly ranges with all the major indices ending slightly lower on the week with the Dow down -0.22%, the S&P down -0.10 and the Nasdaq down -0.42. Now, with critical timing for stocks running through Monday’s trade, the question is whether the old adage of “Never sell a dull one.” will hold true heading into next week’s trade. Sentiment remains neutral to greedy and the 52-week, high-low ratio turned positive again, ending last week at +0.56%. The tight trade relieved some of the overbought conditions on the daily as that chart builds what looks like a bull flag. That flag looks like a triangle on the hourly chart with that chart totally neutral on the oscillators. The weekly oscillators are still trying to hook higher as prices flirt with overhead trendlines on the intermediate-term charts. The extremely tight ranges does very little to the support and resistance numbers for the major indices. Note that the VIX is now reaching into nearly one year plus lows as prices tighten.
VIX Index Weekly HLC
Dow Jones Industrial Average Weekly HLC
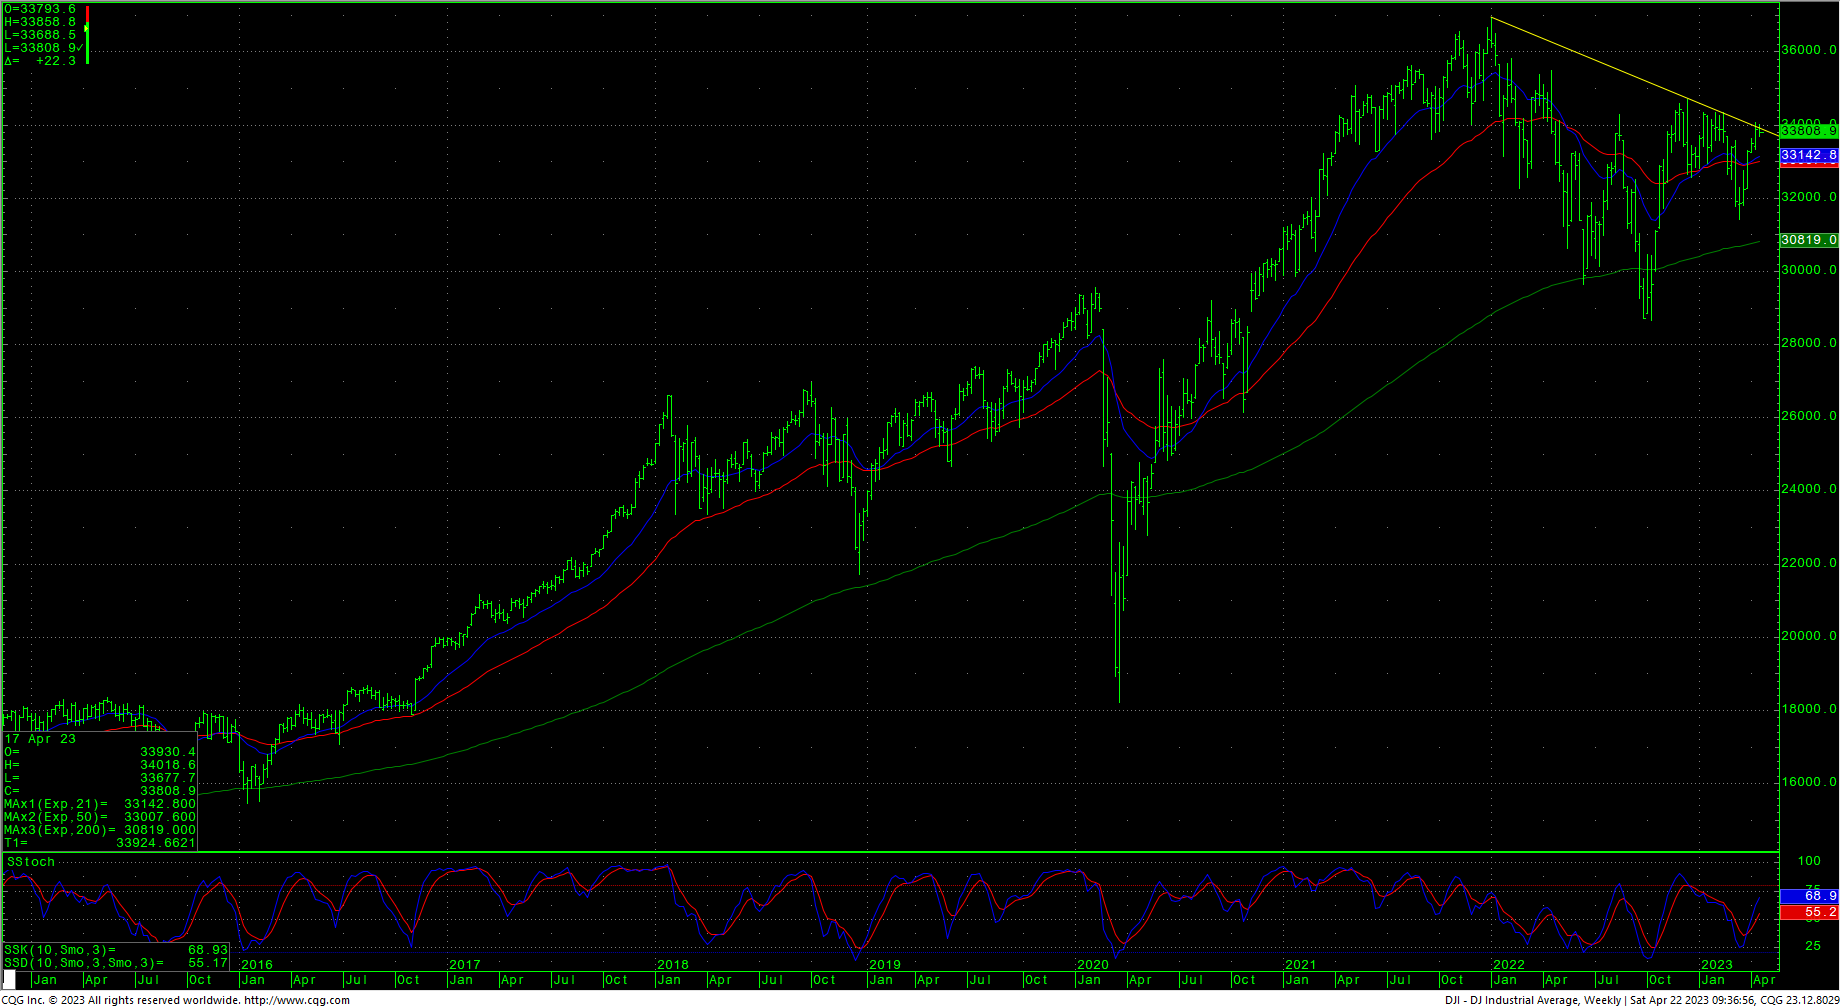
The Dow is still poking away at significant trendline resistance on the daily/weekly charts and this area 33891/33937 remains as a near-term pivotal point. Continued rallies with closes over 33937 are bullish and opens counts to 34712 with resistance at 34222 and 34334/34342. A drive over 34712 can test significant long-term resistance at 34879 and 34995 and offers full counts back critical resistance at 35492. Closes over 35492 will open counts to 35824.
Dow Jones Industrial Average Hourly HLC
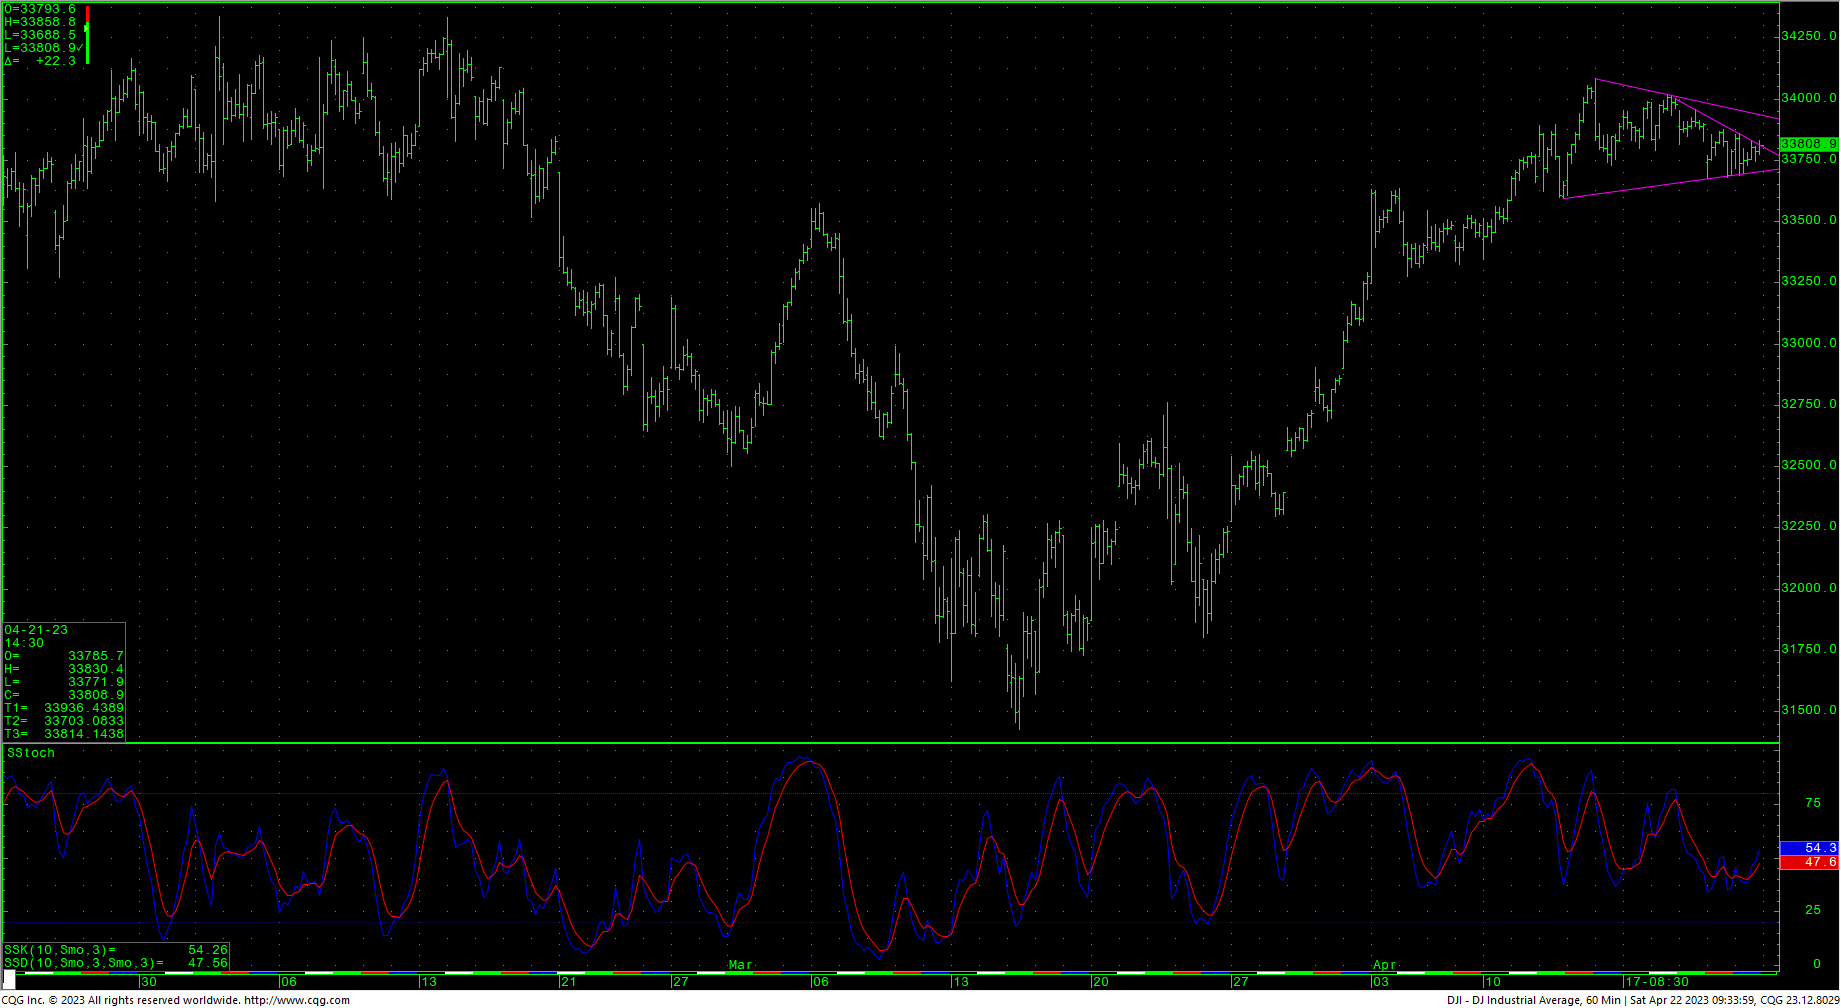
Support for the Dow is 33695/33677 and 33456. A breakdown under 33456 can test 33262 with counts to pivotal short-term support of 33068/33060. Daily closes under 33060 setup a test of 32756 with potential to critical short-term support of 32443/32430. Closes under 32430 set up a move to intermediate support in the 31727/31686 level. A breakdown with closes under 31686 will open counts into the 30972/30960 level with support of 31429/31423 and 31160. There is a gap on the daily chart that runs from 31160 to 31119.
Resistance
- 33937 *** ↑
- 34041 **
- 34082 ** ↑
- 34130 **
- 34222 *** ↑
- 34334/34342 *** ↑
- 34395 **
- 34495 **
- 34595 **
- 34712 *** ↑
- 34879 ***
- 34995 *** ↑
- 35112 **
- 35225 **
- 35372 ***
- 35492 *** ↑
CNN Fear & Greed Index
AAII Investor Sentiment Survey
Support
- 33730 **
- 33695/33677 *** ↓
- 33593 **
- 33456 *** ↓
- 33360 **
- 33262 *** ↓
- 33200 **
- 33068/33060 *** ↓
- 32968 **
- 32850 ***
- 32756 *** ↓
- 32660 **
- 32532 **
- 32443/32430 *** ↓
- 32360 **
- 32260 **
- 32149 **
- 32055 ***
- 31950 **
- 31809 ***
- 31727 *** ↓
- 31686 *** ↓
S&P 500 Cash Index
The S&P closed flat on Friday as prices also narrowed into an extremely tight range. The action last week relieved some of the seriously overbought indicators on the daily chart as that chart continues to trade just under the 2023 highs. Like the Dow, the hourly chart is neutral and Friday’s action pulled the oscillators up from slightly oversold conditions. Resistance remains key at 4155. Further rallies with daily closes over 4155 should test the overhead gap area at 4203 to 4218 and longer-term counts to critical resistance of 4311/4315. Daily closes over 4315 open counts to 4385 with full potential to long-term critical resistance of 4486/4505. Closes over 4505 can carry to 4593 with full potential toward 4637. A breakout above 4637 opens potential toward 4748 and ultimately 4818.
S&P 500 Index Weekly HLC
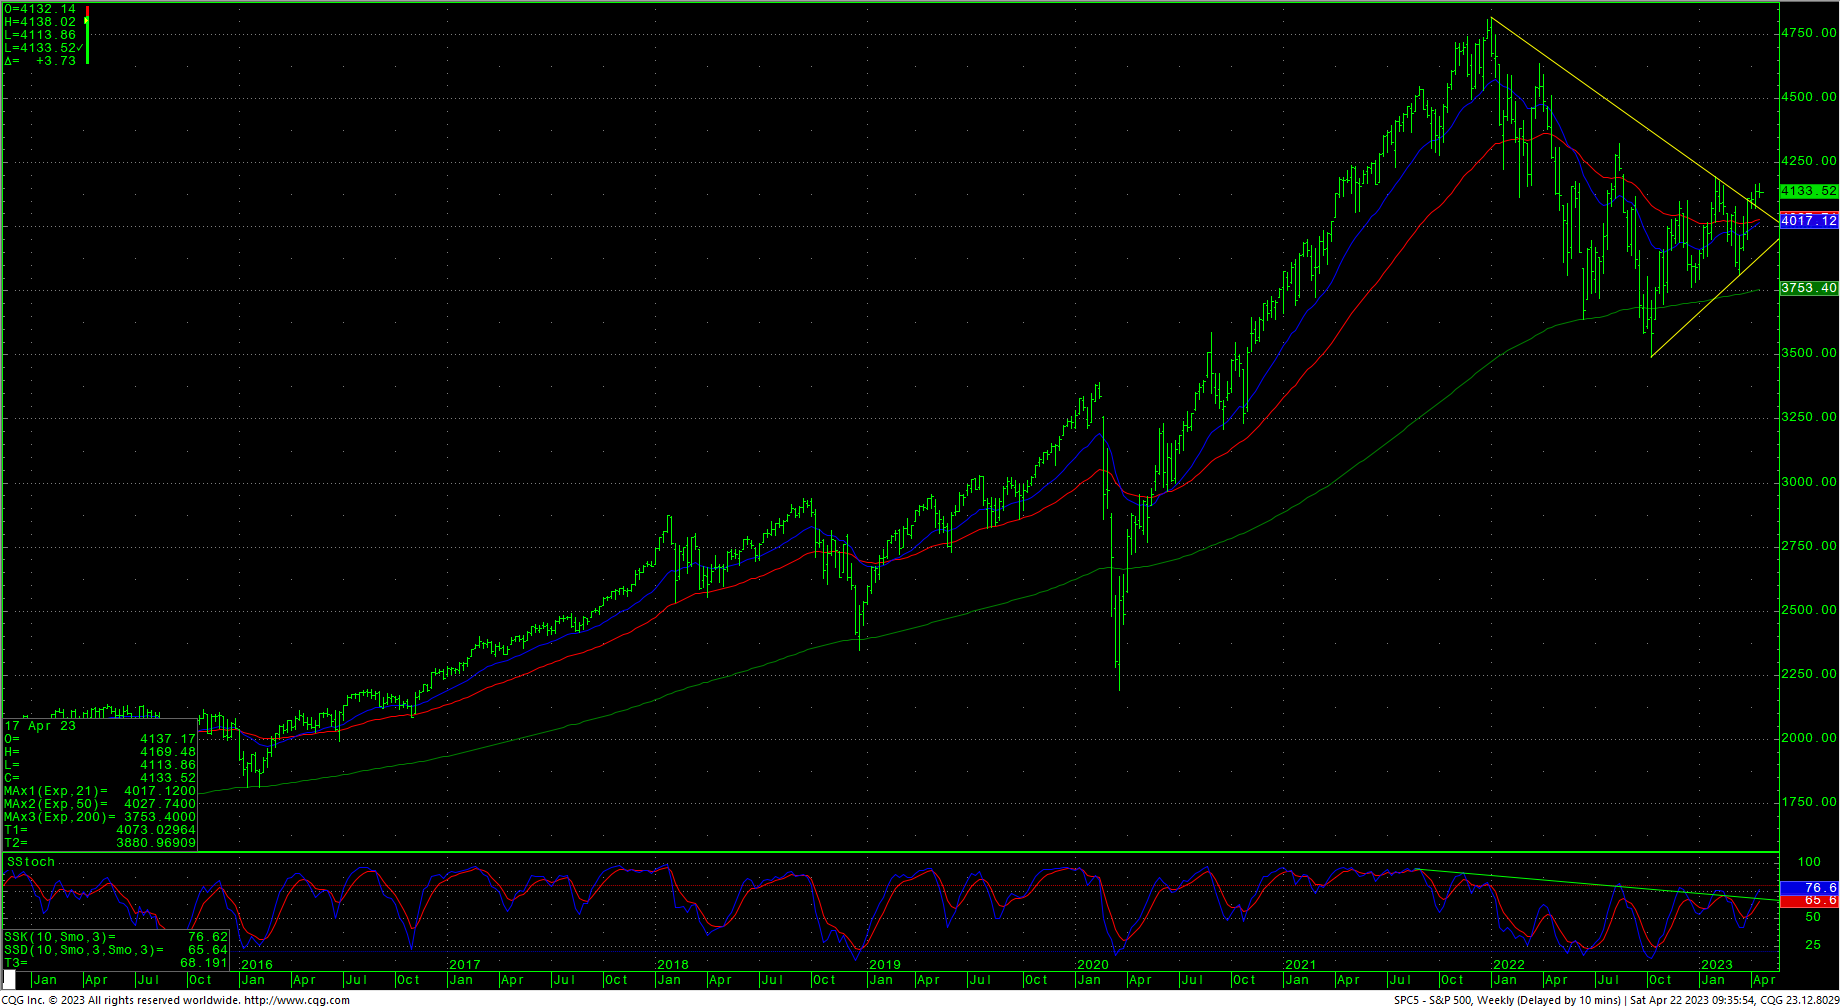 Support is 4113/4111 and, short-term, a key band is at 4079/4069. A breakdown under 4069 should test 4053 with counts to 4027/4024. Closes under the 4024 level should carry to 3986 with counts to pivotal near-term support of 3944/3940. Closes under 3940 setup a retest of 3868/3865. A breakdown under 3865 can test 3808 through 3797. A breakdown with closes under 3799/3797 opens counts to critical support against the 3760/3750 level. Under 3750 sets up a move to 3657 and full potential back to critical long-term support of 3505/3491.
Resistance
- 4155 *** ↑
- 4169 *** ↑
- 4203/4218 ***
- 4311/4315 *** ↑
- 4350 **
- 4385 *** ↑
- 4430 **
- 4486 *** ↑
- 4505 *** ↑
- 4593 **
- 4637 *** ↑
Support
- 4113/4111 *** ↓
- 4096 **
- 4079/4069 *** ↓
- 4053 *** ↓
- 4027/4024 ***↓
- 3995 ***
- 3965 **
- 3944/3940 *** ↓
- 3868/3865 *** ↓
- 3845 **
- 3808 *** ↓
- 3799/3797 *** ↓
- 3760/3750 *** ↓
- 3667/3657 *** ↓