
TECHNICAL ANALYSIS
Major Indices Week of May 26, 2023
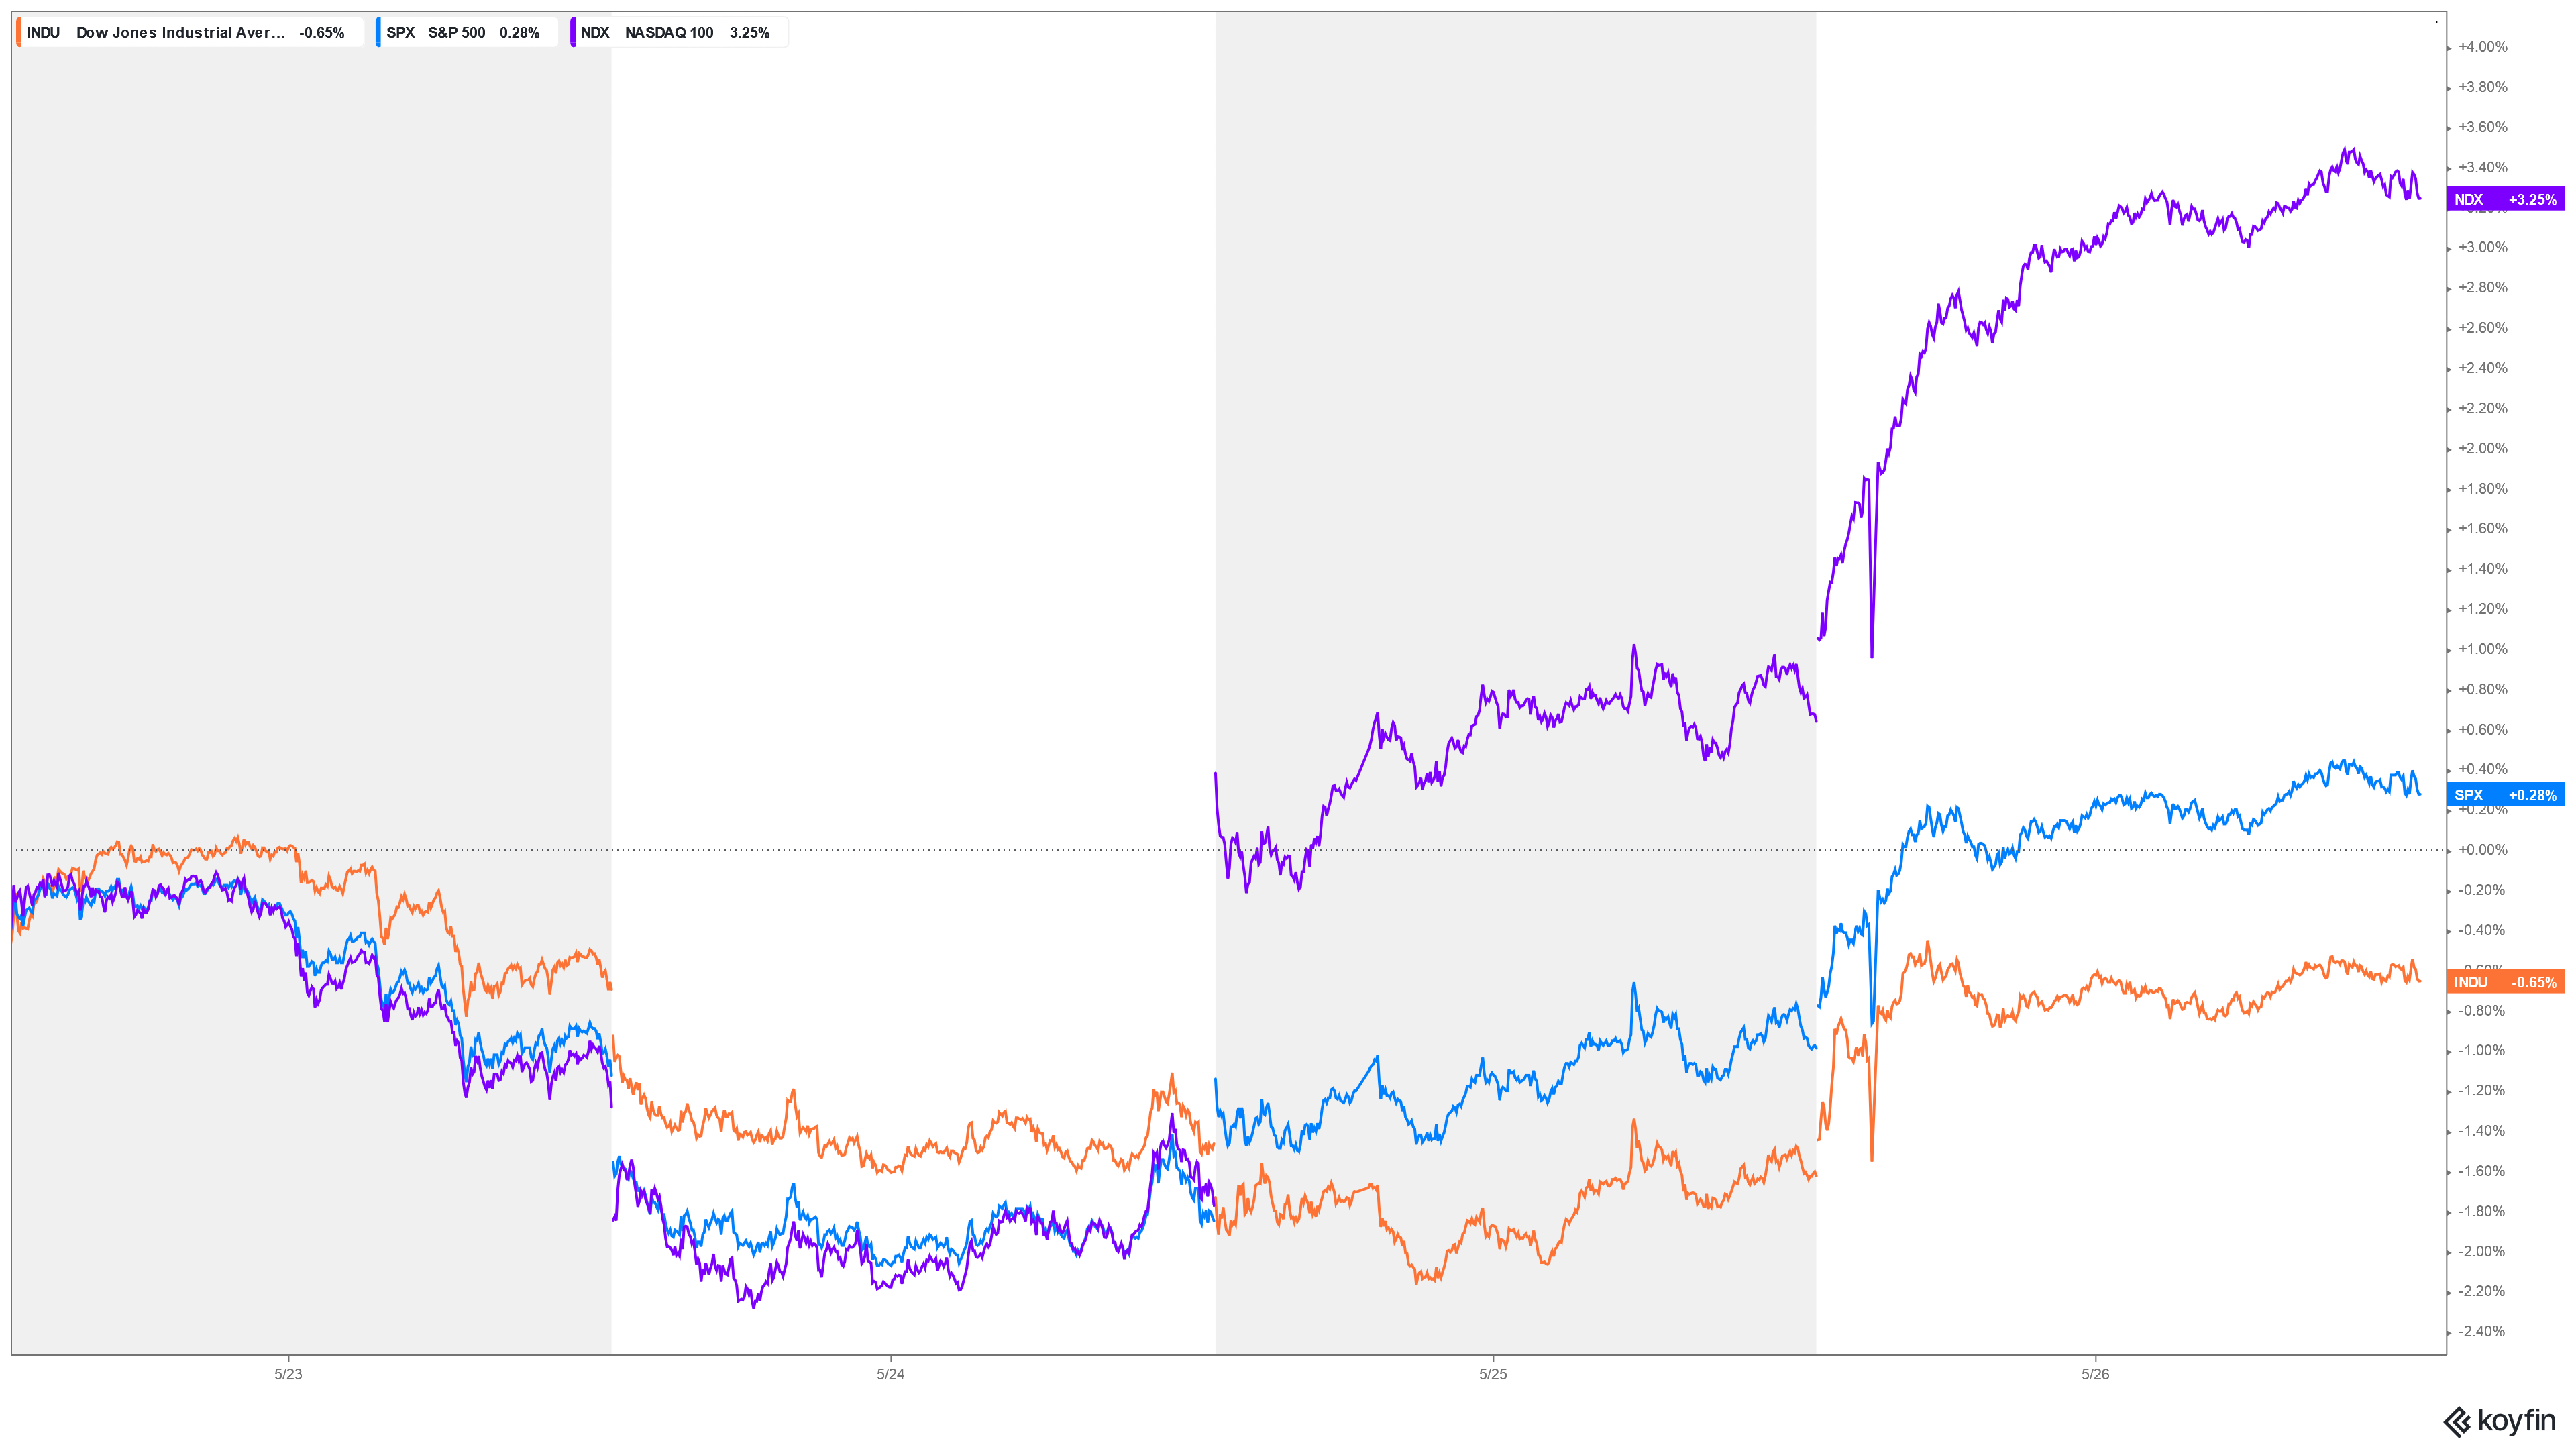
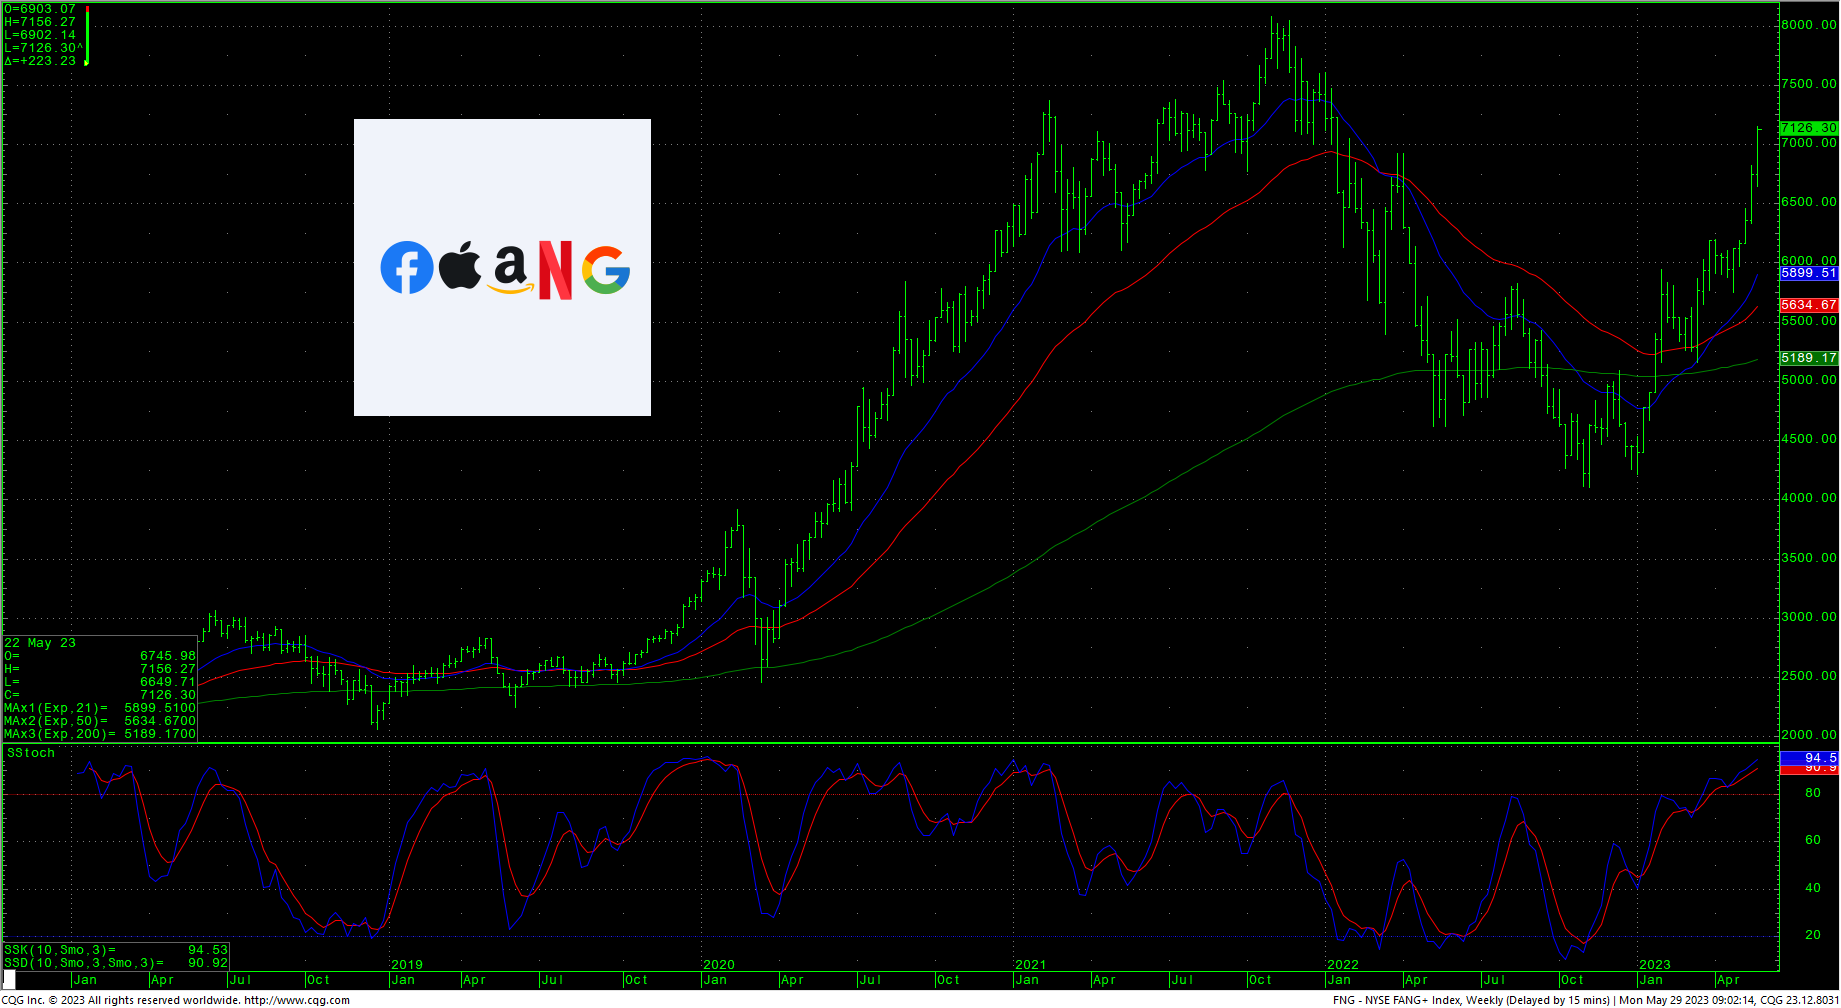
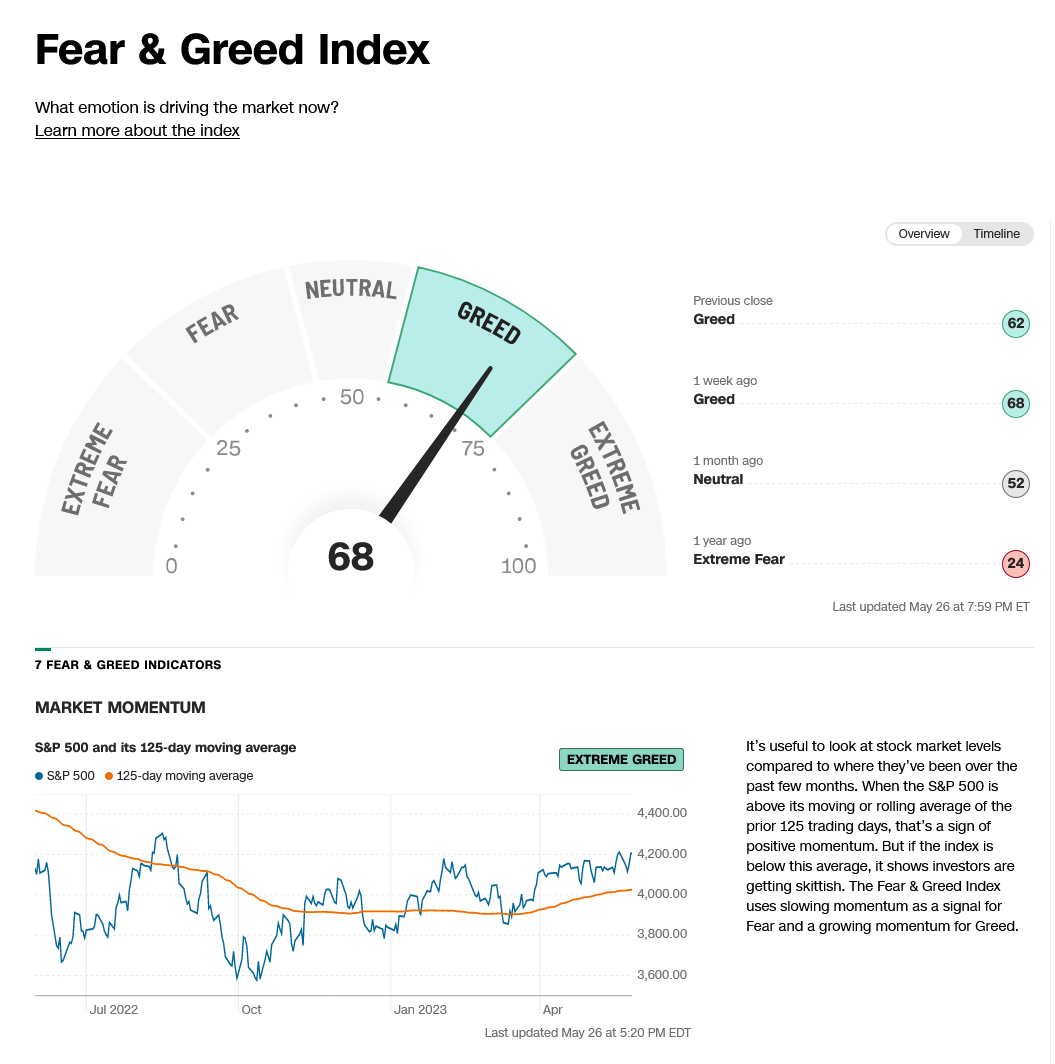
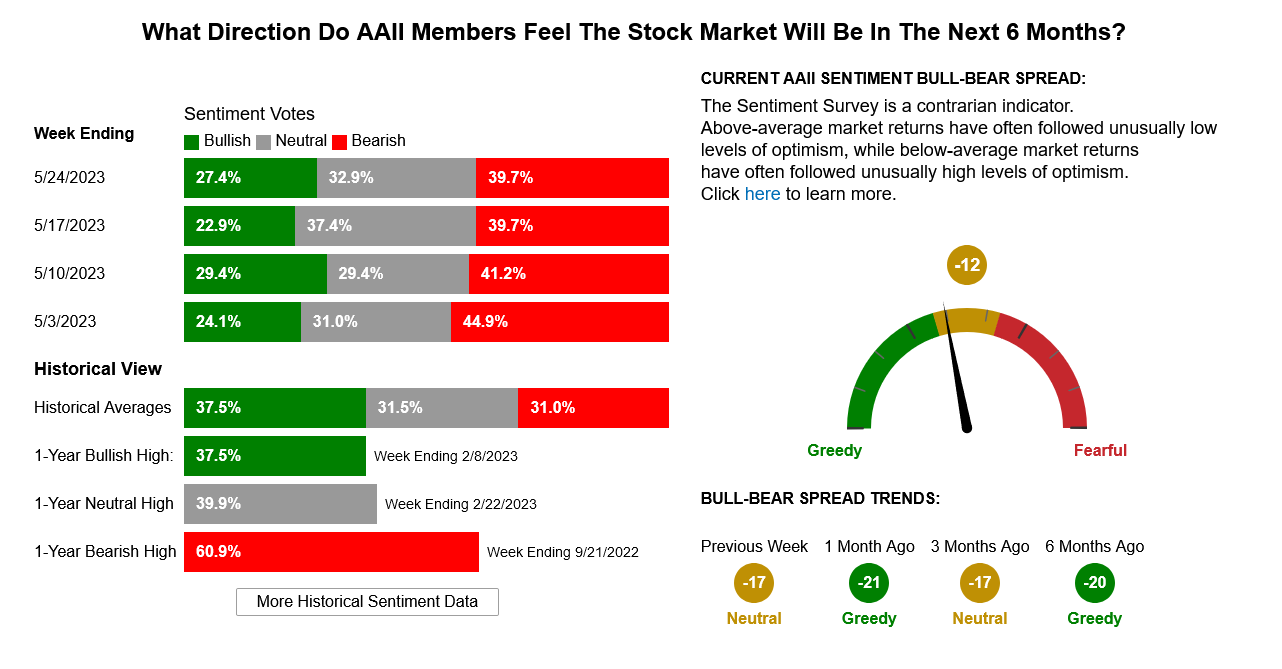
Stocks saw another extremely volatile week last week, once again led by tech stocks. The Dow saw a two-month trading low against lower trendline support in Thursday’s minor cycle timing point and then all indices rallied with the Nasdaq and the FANG leading the way, closing up another whopping +5.64%. Friday’s pre-Memorial Day weekend move left the short-term charts slightly overbought. The Dow daily is trying to hook up from oversold conditions. The S&P500 set the highest close since August of 2022 as that chart continues to flirt with the overhead trendline resistance and new 2023 trading highs. Sentiment remains neutral to greedy, and the Commitment of Traders (CoT) still appears to favor the commercial longs. Note that the AAII Survey has new recorded the 14th straight week of ‘above average’ pessimism. The Dow ended the week down -1.00%, S&P was up +0.32%, The Nasdaq ended up +2.51% and the Russell down -0.04%.
BRKA Daily Chart
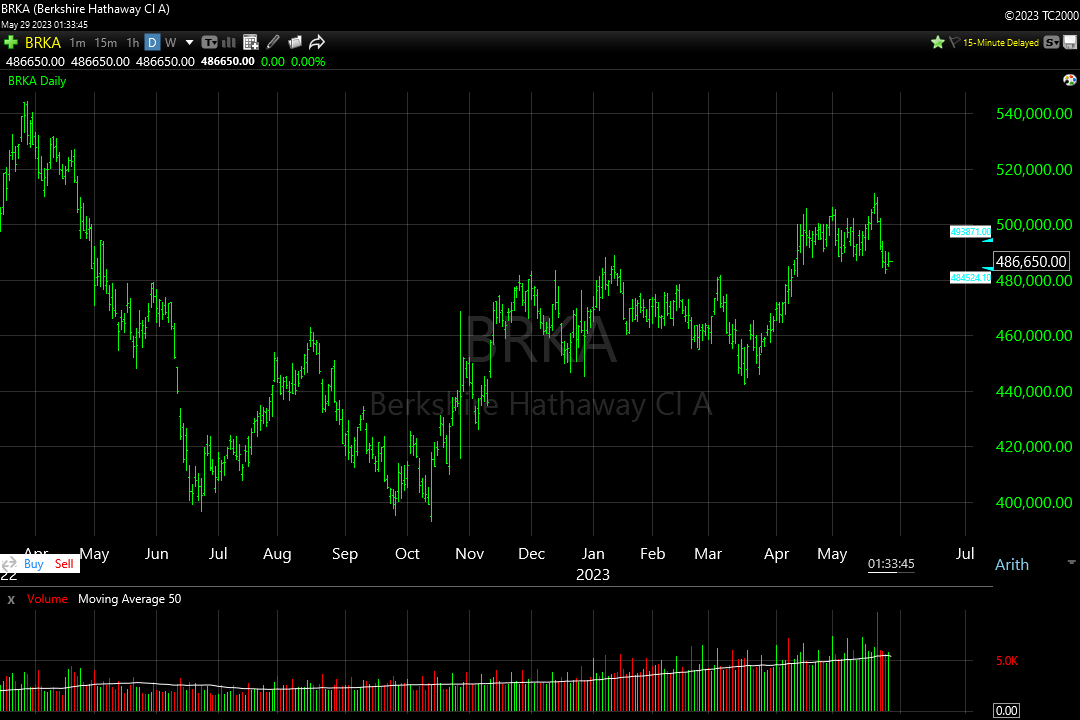
One development last week was the high-volume failure of BRKA. Prices are now retesting the original breakout area on the daily chart after spiking above 511K the previous week. Intermediate-term, BRKA still has overhead objectives in the 540K area, and holding the previous tops (breakout area) should lead to renewed rallies toward those objectives. Note: The next key timing point is June 5th and it stands out as an area where there may be large moves and a possible extreme.
Timing Points
- 05/30 **
- 06/05 *** X important
- 06/16 **
- 06/21 **
- 06/30 *** fast moves
CNN Fear & Greed Index
AAII Investor Sentiment Survey
Dow Jones Industrial Average Weekly HLC
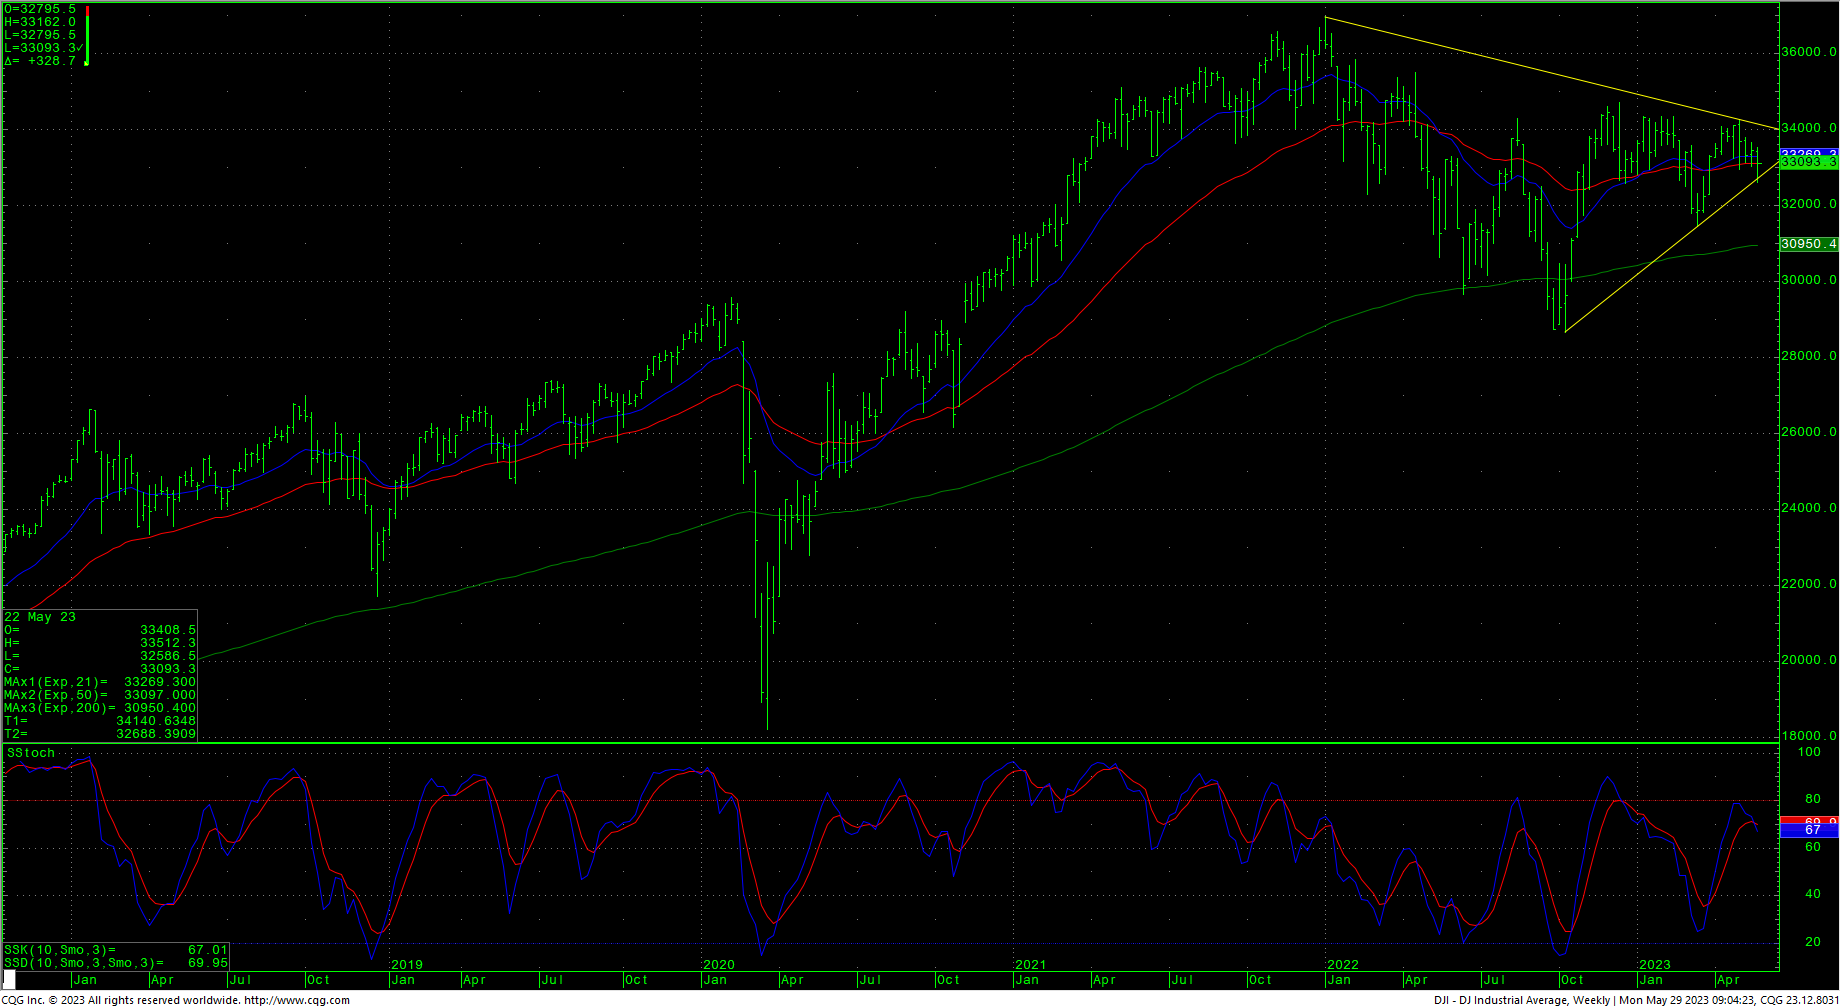
The weekly stochastics hooked lower last week but moving averages continue to hang on to threadbare uptrends. Resistance for the Dow is 33224, 33422 and pivotal at 33619/33625. A drive above 33625 should test wave resistance at 33811 and a rallies through that area are friendly and should test 33927/33946 with a shot at 34257. Expect resistance to continue at 34222/34257 and 34334/34342. Closes over 34342 are friendly. A drive over 34712 can test significant long-term resistance at 34879 and 34995 and offers full counts back critical resistance at 35492. Closes over 35492 will open counts to 35824. Closes over 35492 should minimally test a gap area on the daily at 35996 to 36044.
Support for the Dow is at 32843 and 32795. A breakdown under 32843 sets up a test of critical support of 32510/32500. Closes under 32500 set up a move to intermediate support in the 31727/31686 level. A breakdown with closes under 31686 will open counts into the 30972/30960 level with support of 31429/31423 and 31160. There is a gap on the daily chart that runs from 31160 to 31119.
Resistance
- 33224 **
- 33422 ***
- 33619/33625 *** ↑
- 33715 **
- 33811 ** ↑
- 33927/33946 *** ↑
- 34092 **
- 34130 **
- 34222/34257 *** ↑
- 34334/34342 *** ↑
- 34395 **
- 34495 **
- 34595 **
- 34712 *** ↑
- 34879 ***
- 34995 *** ↑
- 35112 **
- 35225 **
- 35372 ***
- 35492 *** ↑
- 35800/35824 *** ↑
Support
- 33020 **
- 32937 **
- 32843 *** ↓
- 32683 *** ↓
- 32510/32500 *** ↓
- 32396 **
- 32295 ** ↓
- 32136/32097 *** ↓
- 31950 **
- 31828/31805 *** ↓
- 31727 ***
- 31686 *** ↓
- 31624 ***
- 31530 **
- 31429/31423 *** ↓
S&P 500 Cash Index
The S&P settled into a new closing high for 2023 to end the week last week. Once again prices are flirting with a key intermediate-term trendline and the large gap area left last August at 4203/4218. The daily stochastics look Schizophrenic and last week’s action leaves most of the technical points pretty much the same. Further rallies through the 4218 area should carry to critical resistance of 4311/4315. Daily closes over 4315 open counts to 4385 with full potential to long-term critical resistance of 4486/4505. Closes over 4505 can carry to 4593 with full potential toward 4637. A breakout above 4637 opens potential toward 4748 and ultimately 4818.
S&P 500 Index Weekly HLC
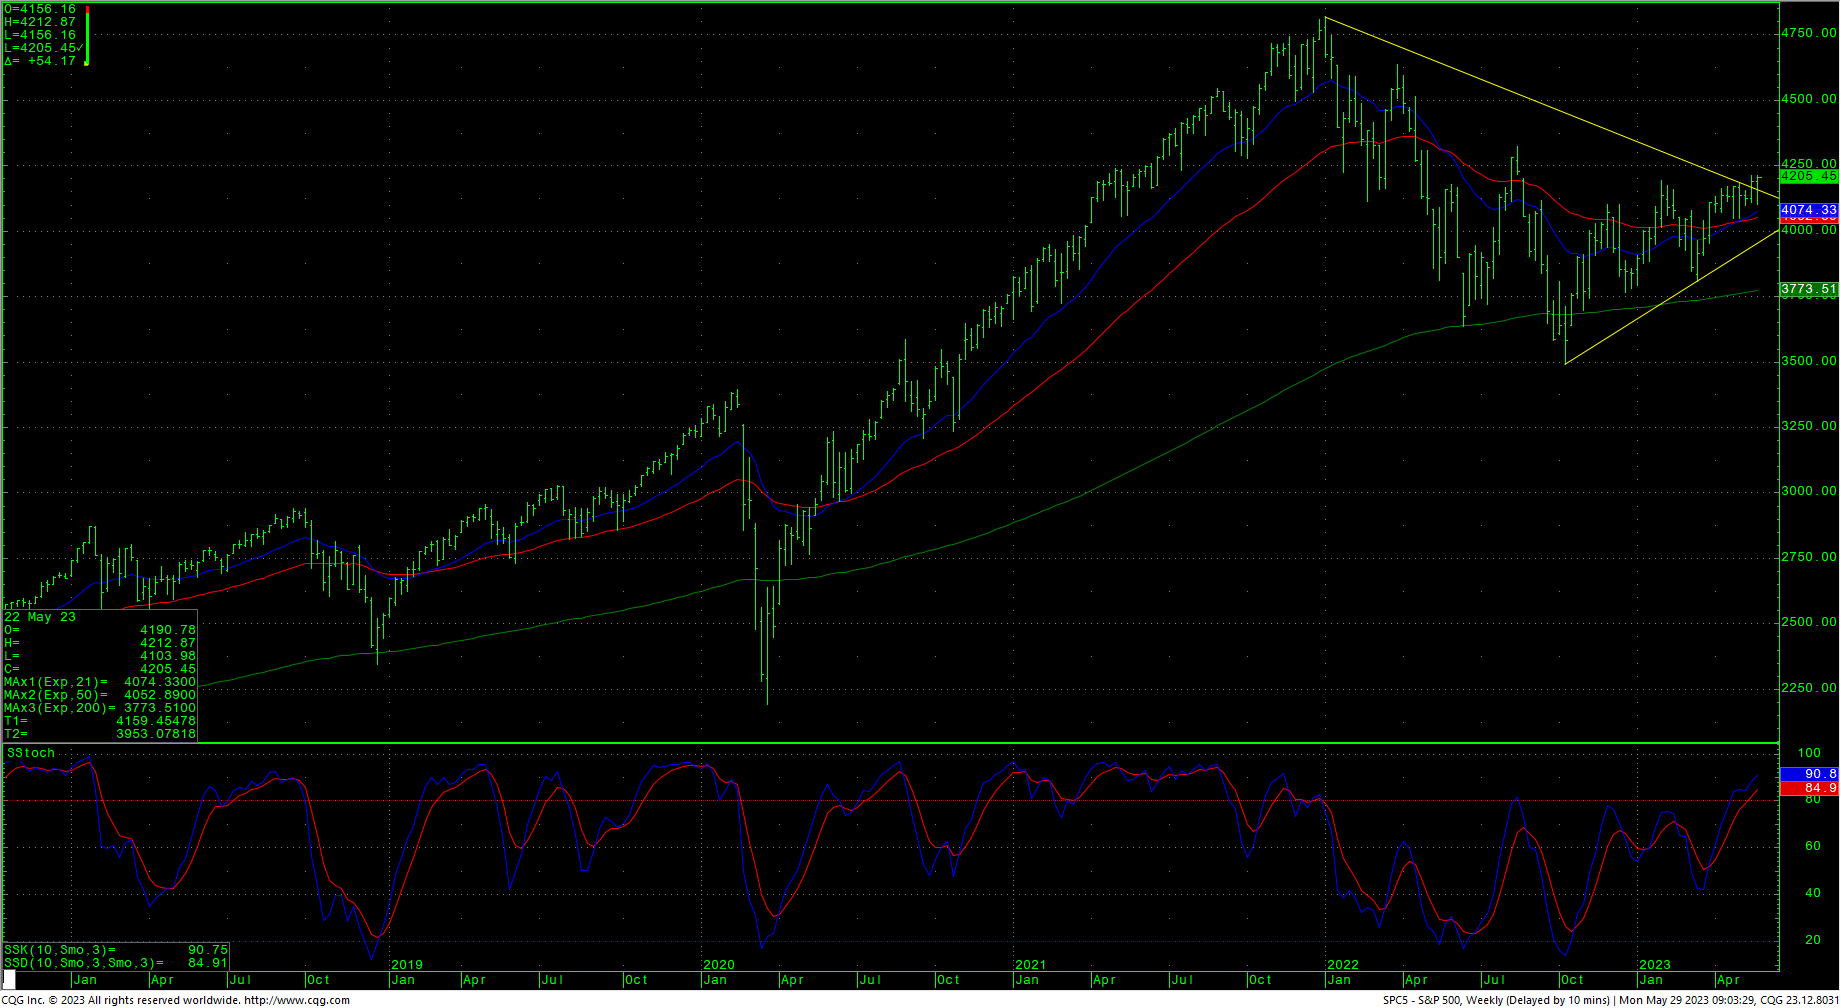
Support is 4171, 4158, and short-term pivotal at 4145/4142. A breakdown under 4142 should retest 4058/4057. Closes below 4057 open counts to 4010 with potential toward critical support of 3963/3958. Closes under 3958 setup a retest of 3868/3865. A breakdown under 3865 can test 3808 through 3797. A breakdown with closes under 3799/3797 opens counts to critical support against the 3760/3750 level. Under 3750 sets up a move to 3657 and full potential back to critical long-term support of 3505/3491.
Resistance
- 4212/4218 ***
- 4311/4315 *** ↑
- 4350 **
- 4385 *** ↑
- 4430 **
- 4486 *** ↑
- 4505 *** ↑
- 4593 **
- 4637 *** ↑
- 4665 **
- 4748 *** ↑
- 4818 *** ↑
Support
- 4171 **
- 4158 ***
- 4145/4142 *** ↓
- 4111 **
- 4099 **
- 4058/4057 *** ↓
- 4010 *** ↓
- 3965 **
- 3963/3958 *** ↓
- 3901 **
- 3868/3865 *** ↓
- 3845 **
- 3808 *** ↓
- 3799/3797 *** ↓
- 3760/3750 *** ↓
- 3667/3657 *** ↓