
TECHNICAL ANALYSIS
Major Indices Week of June 30, 2023
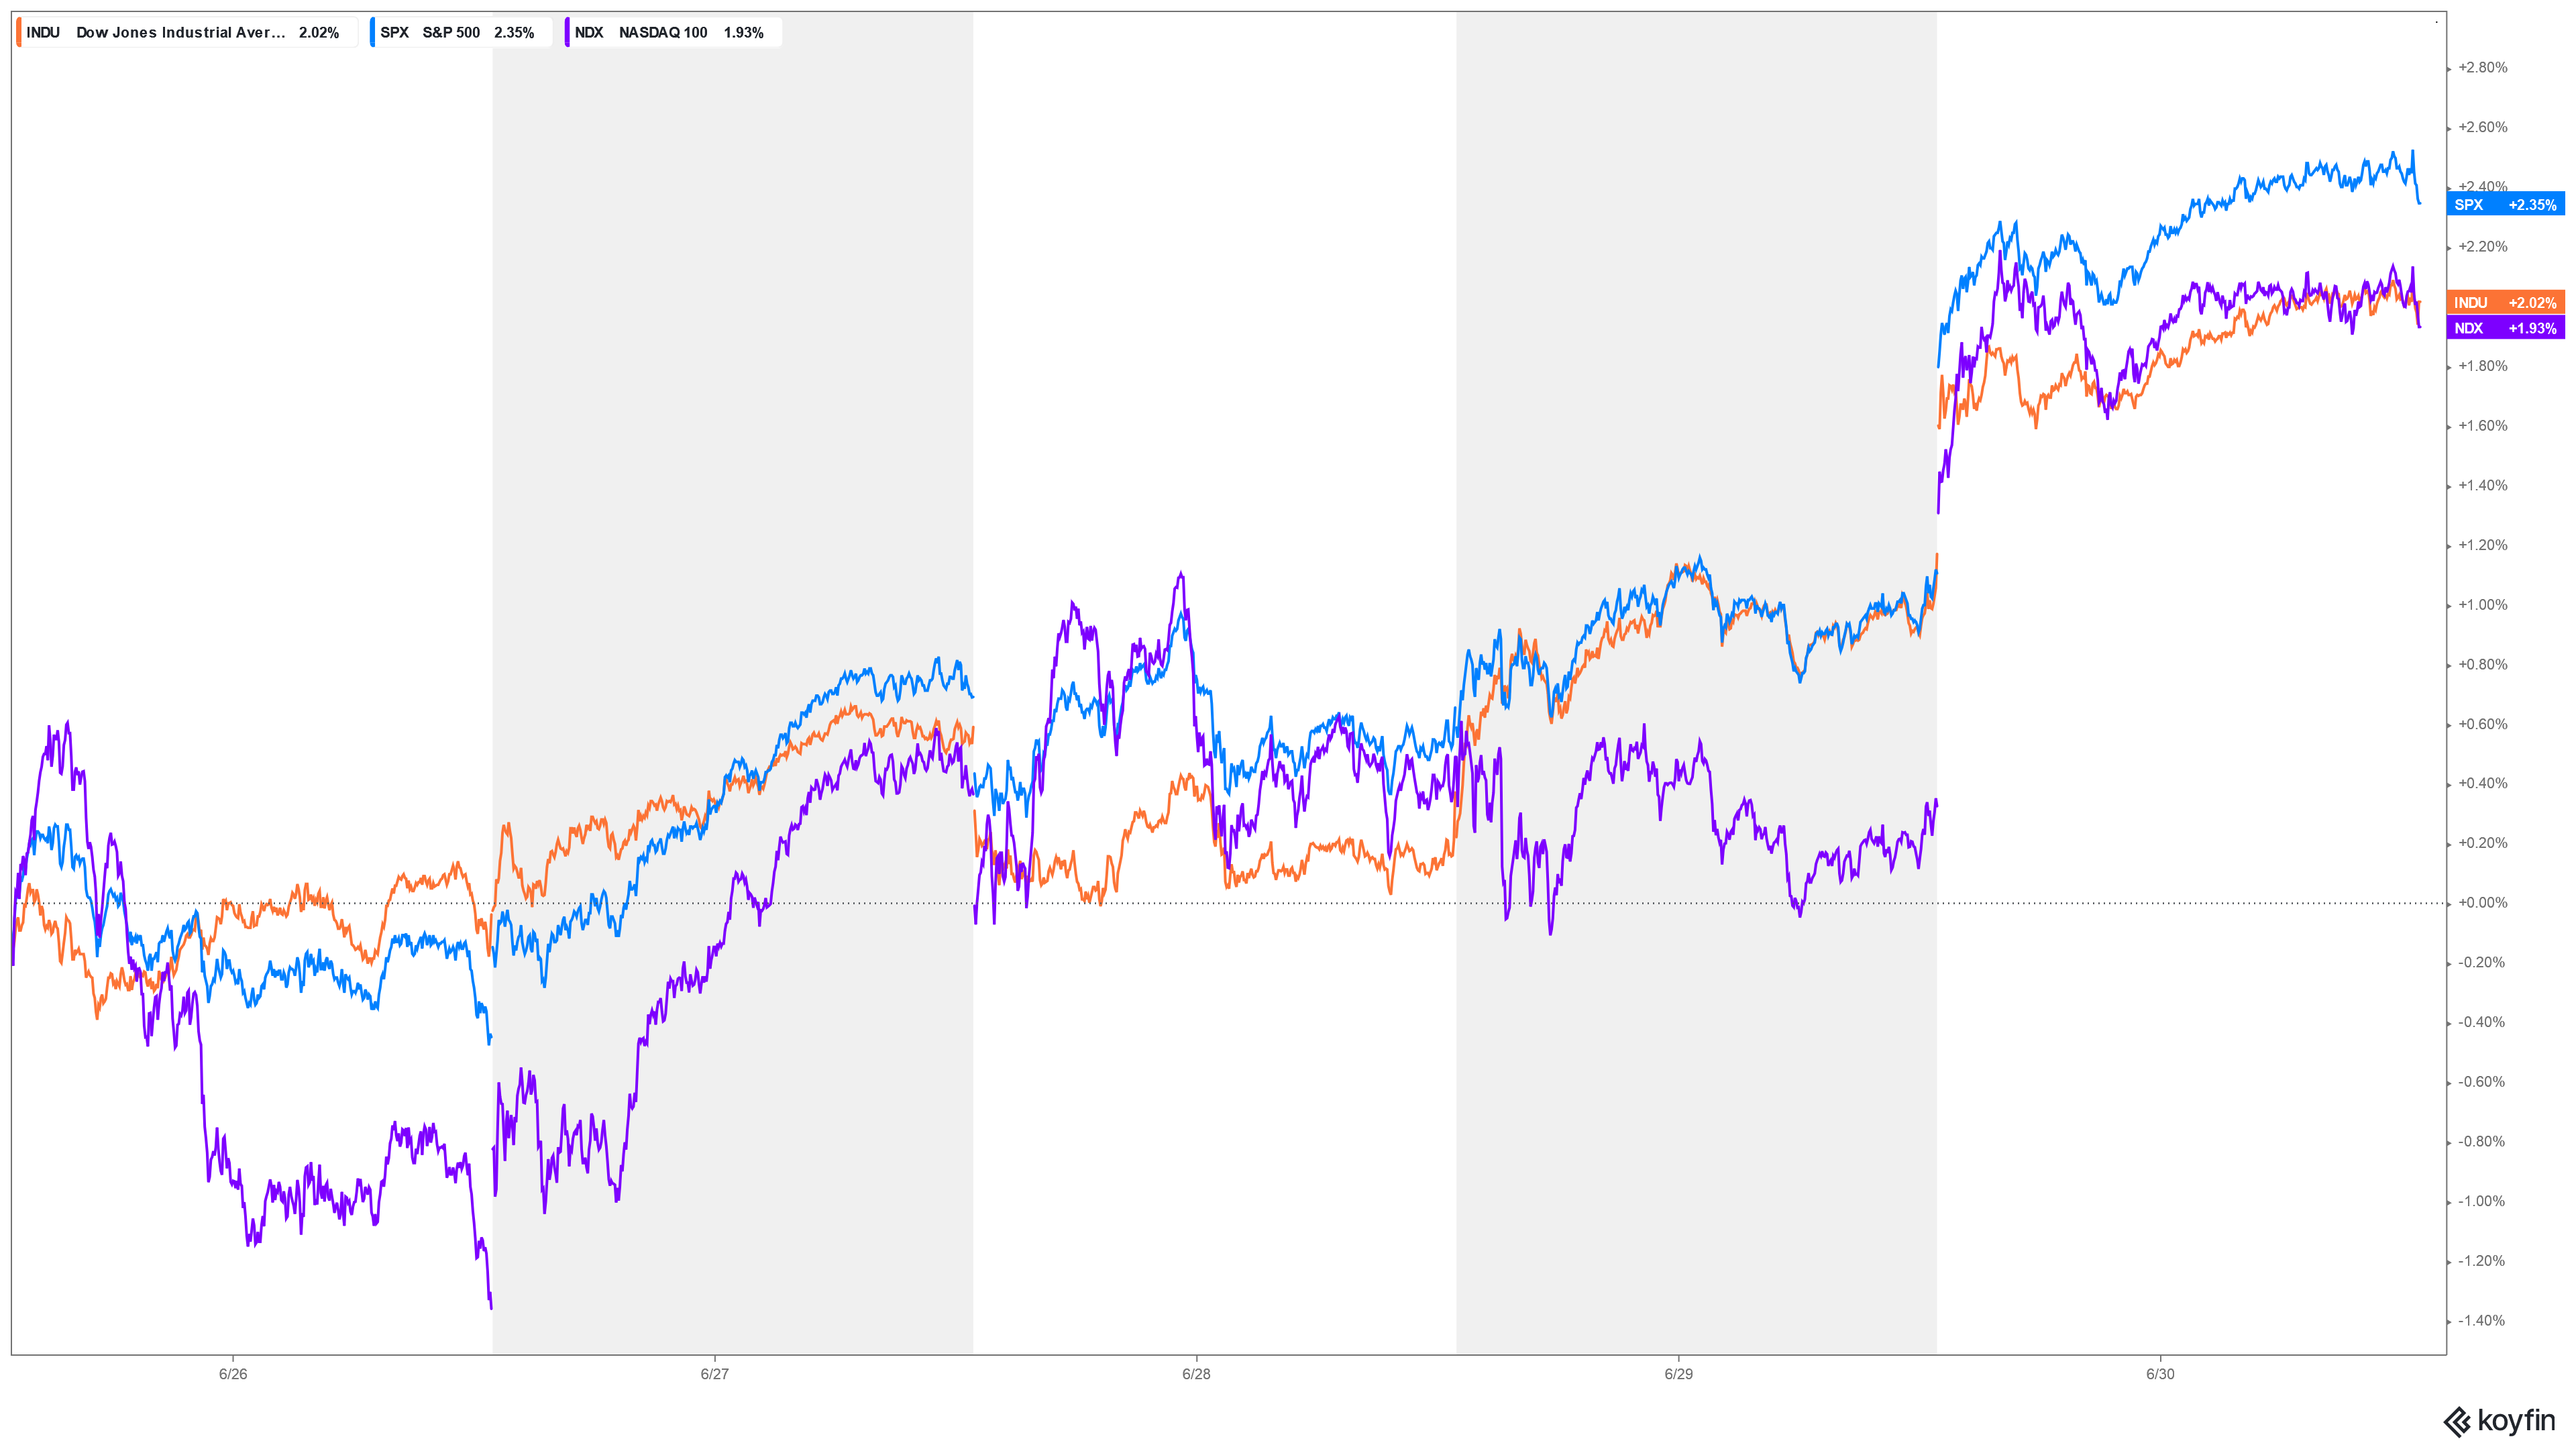
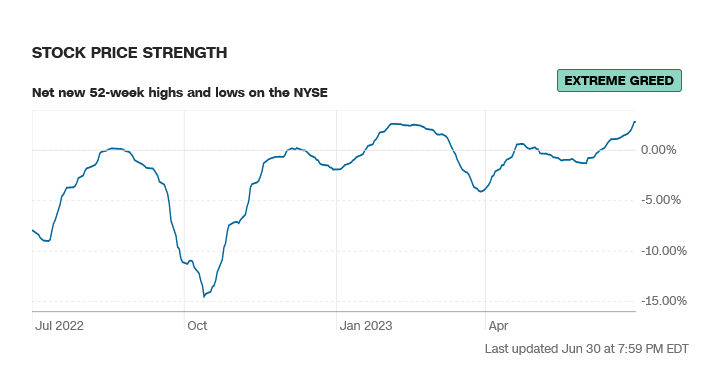
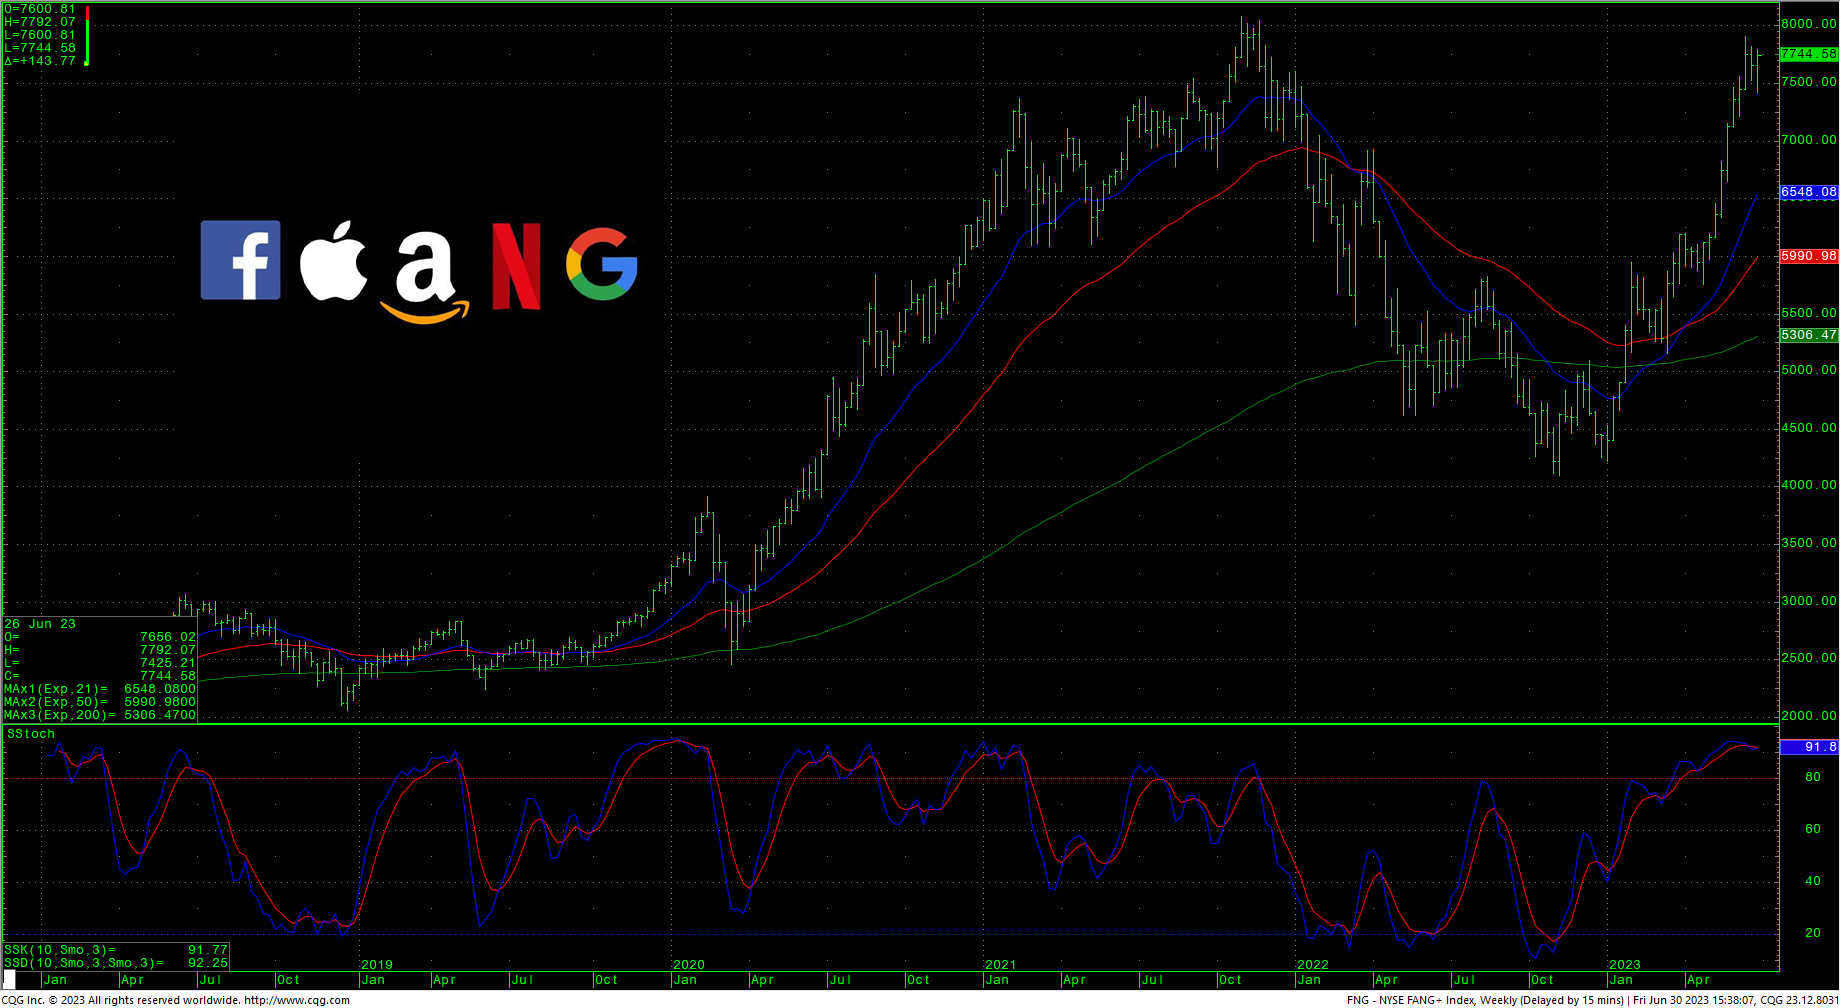
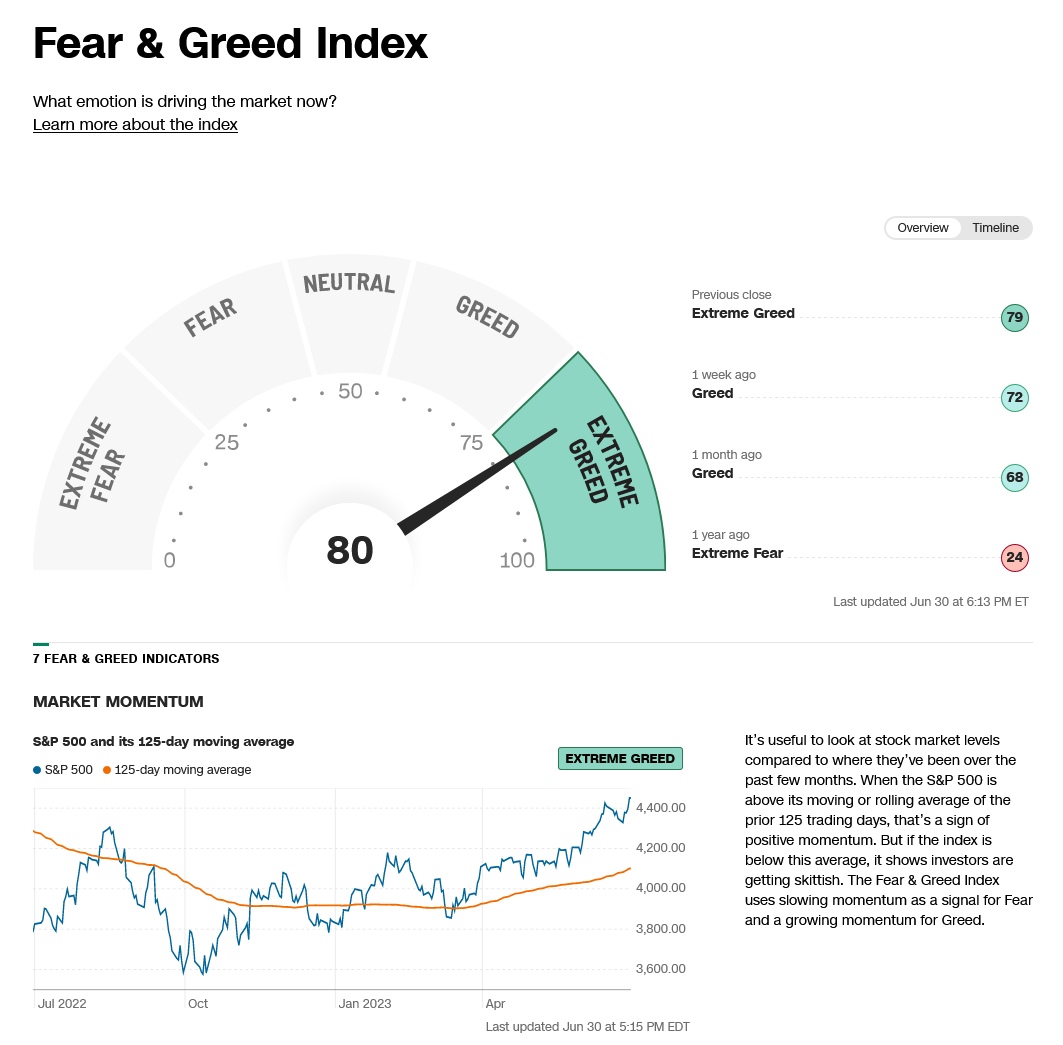
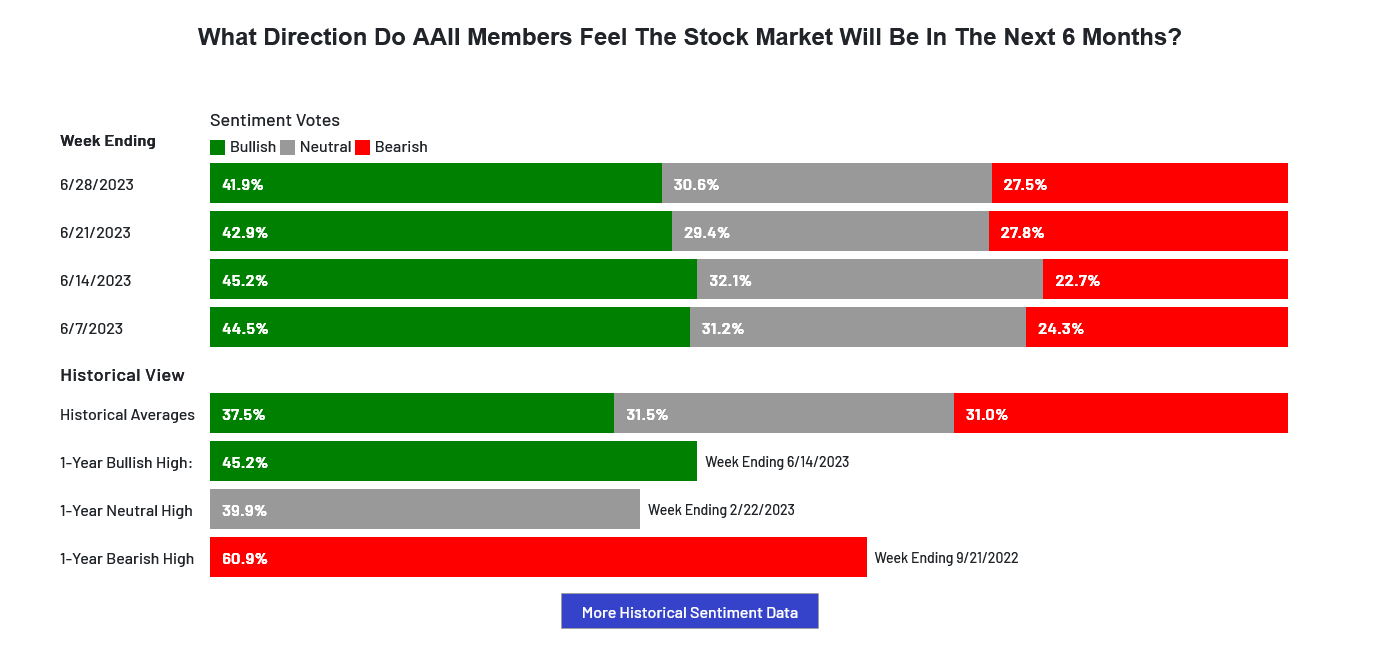
Stocks traded an outside week up and closed near the high end of the week’s range. Friday’s gap activity left island reversals on the daily charts for both the Dow and the S&P. Both the Dow and the S&P settled at the highest weekly close for the year with the S&P moving into new trading highs for 2023 in Friday’s critical cycle timing. For the Dow, the close is the highest weekly close since 28 November 2022 and for the S&P the close is the highest weekly close since 04 April 2022. Friday’s strong end-of-quarter trade was led by tech stocks with the Nasdaq closing out the first half of 2023 with the best first half year performance EVER recorded, closing the first six months of the year up +39%. The S&P weekly is overbought and the Dow weekly is in a schizophrenic pattern on the oscillators. Sentiment still sits in a Greedy/Bullish posture and the CoT continues to show a shift between commercial traders and speculators. Institutional investors are still buying and leveraged funds have been moving back into the market the past few weeks. The VIX is still sitting at a 2 1/2 year low and the 52-week A/D line is at a frothy +2.82%…now higher than the reading when prices peaked in early 2023. The AAII scored the fourth bullish sentiment week in a row. The next timing point is July 10th and is a minor date. The next CRITICAL timing point is July 20-21. The Dow closed the week up +2.02%, The S&P was up +2.34%. The Nasdaq ended the week up +2.20%, the FANG settled up +1.30% and the Russell was up +3.69%.
Timing Points
- 07/10 **
- 07/20-21 *** X Critical
CNN Fear & Greed Index
AAII Investor Sentiment Survey
Dow Jones Industrial Average Hourly HLC
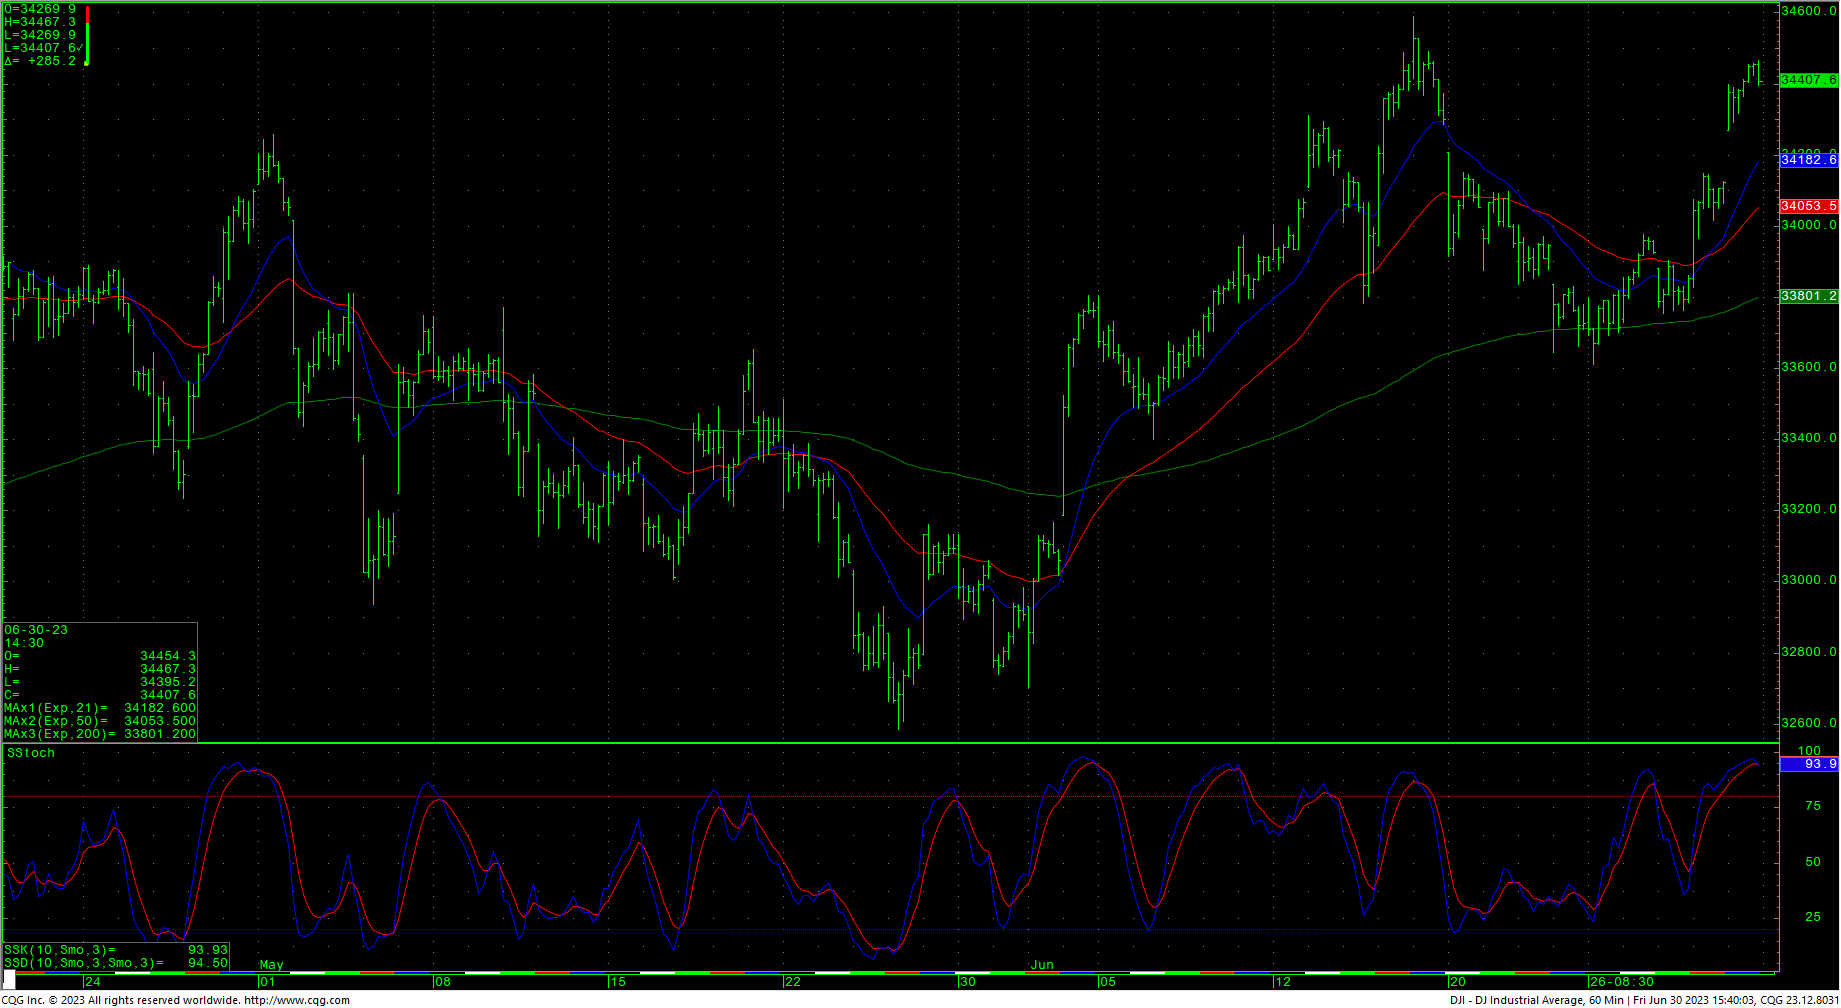
The Dow hourly is overbought on Friday’s close. The close is friendly and the technicals are suggesting the Dow may be setting up for a push to the late 2022 trading highs at 34712 with trading resistance at 34589. A drive with closes over 34712 can test significant long-term resistance at 34879 and 34995 and offers full counts back critical resistance at 35492. Closes over 35492 will open counts to 35824. Closes over 35492 should minimally test a gap area on the daily at 35996 to 36044. A reminder that holding the breakout of the inverted H&S pattern counts toward long-term targets at 37095.
Support for the Dow is at 34139, 34038 and 33937/33933. A breakdown under 33933 should test 33823 with counts toward 33588. Declines under 33588 have potential to pivotal short-term support of 33351/33340. Daily closes under 33340 open counts to 33009 with potential to critical near-term support of 32636/32620. Closes under 32620 will count to 32219/32175. A breakdown under 32175 sets up a test of intermediate support in the 31727/31686 level. A breakdown with closes under 31686 will open counts into the 30972/30960 level with support of 31429/31423 and 31160. There is a gap on the daily chart that runs from 31160 to 31119.
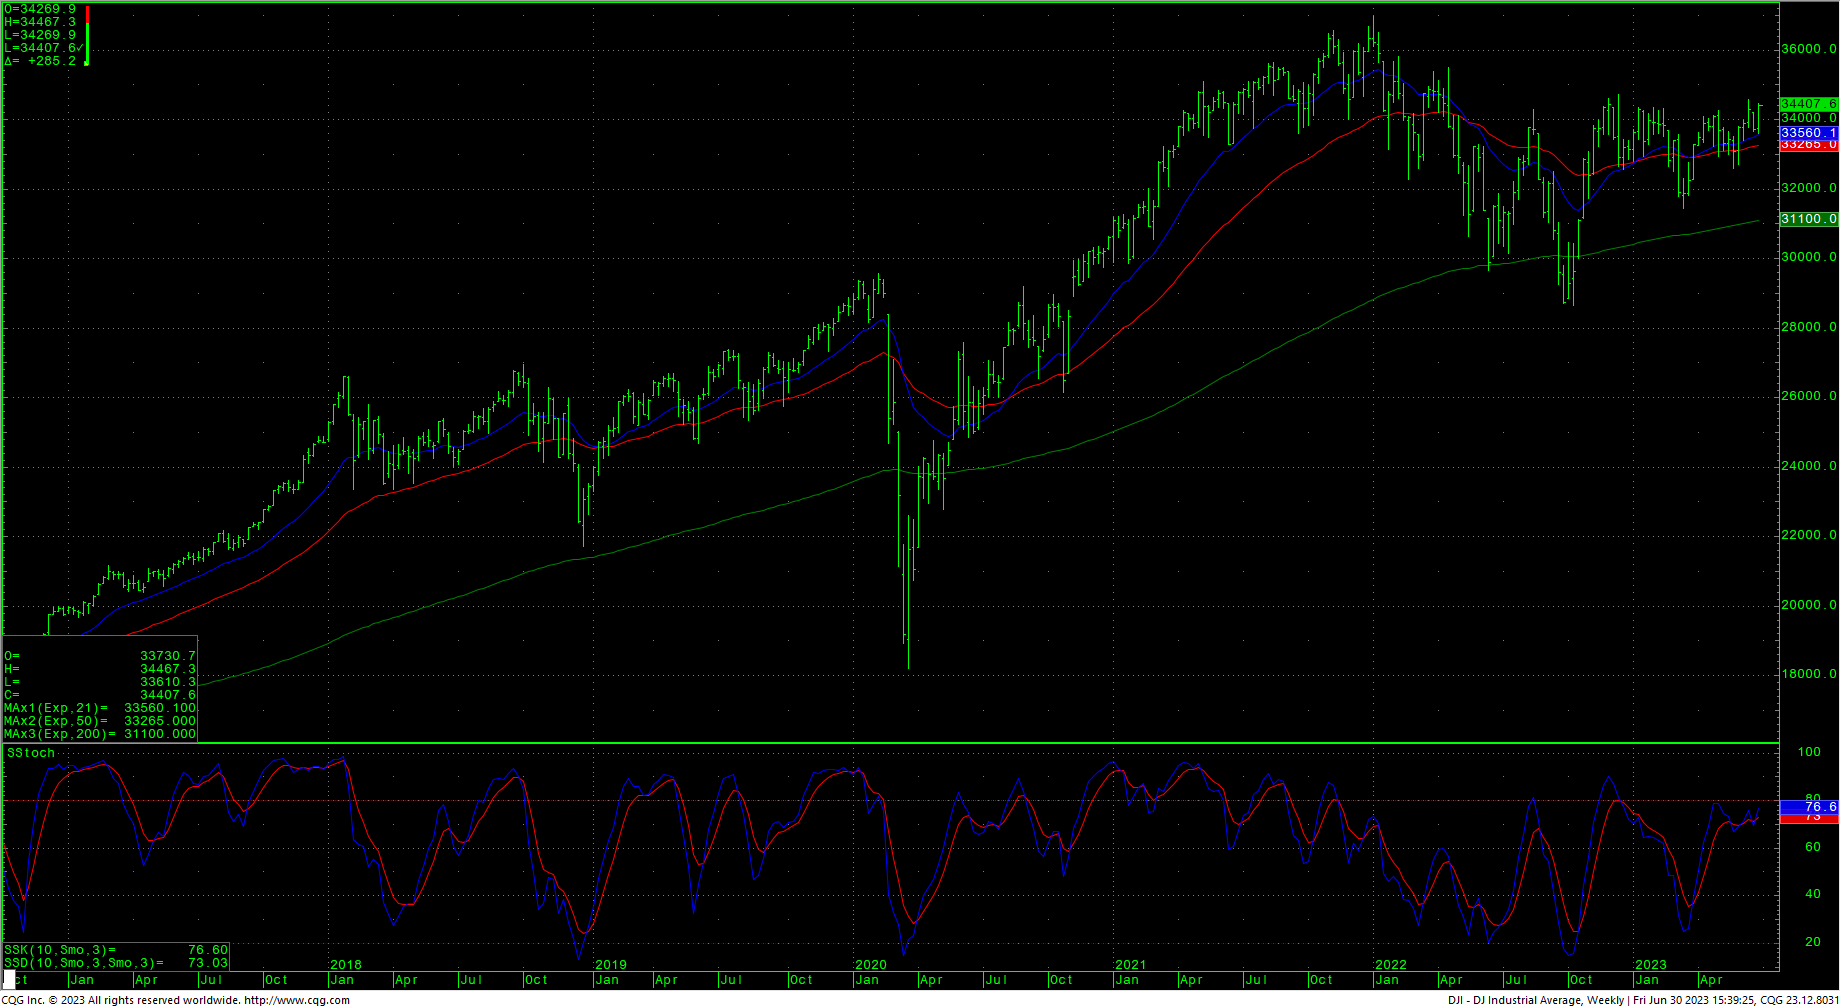
Dow Jones Industrial Average Weekly HLC
Resistance
- 34467 **
- 34495 **
- 34589 *** ↑
- 34712 *** ↑
- 34879 ***
- 34995 *** ↑
- 35112 **
- 35225 **
- 35372 ***
- 35492 *** ↑
- 35800/35824 *** ↑
- 35996 ***
- 36044 *** ↑
Support
- 34265 **
- 34139 **
- 34038 ***
- 33937/33933 ***↓
- 33823 ***
- 33646 **
- 33588 *** ↓
- 33381 **
- 33251/33340 *** ↓
- 33261 **
- 33195 **
- 330009/33000 *** ↓
- 32843 ***
- 32636/33620 ***
- 32500 **
- 32396 **
- 32319/32175 *** ↓
S&P 500 Cash Index
The S&P hourly is overbought on Friday’s close. Prices cleared resistance at 4407/4410 and are positioned for a test of long-term critical resistance of 4486/4505. Closes over 4505 can carry to 4593 with full potential toward 4637. A breakout above 4637 opens potential toward 4748 and ultimately 4818. Above the record highs opens counts to 4952/5000.
Support is 4408, 4393 and 4377/4375. A breakdown under 4375 sets up a test of 4360/4358 with counts to 4328 and possibly 4305. Daily closes under 4305 setup a move to 4230 and 4210. Closes under 4210 open counts to 4133 and pivotal short-term support of 4057/4053. Daily closes below 4053 open counts to 3975 with potential to critical near-term support at 3860/3855. A breakdown with closes under 3855 opens counts to support against the 3691/3680 level. Under 3680 sets up a move to 3657 and full potential back to critical long-term support of 3505/3491.
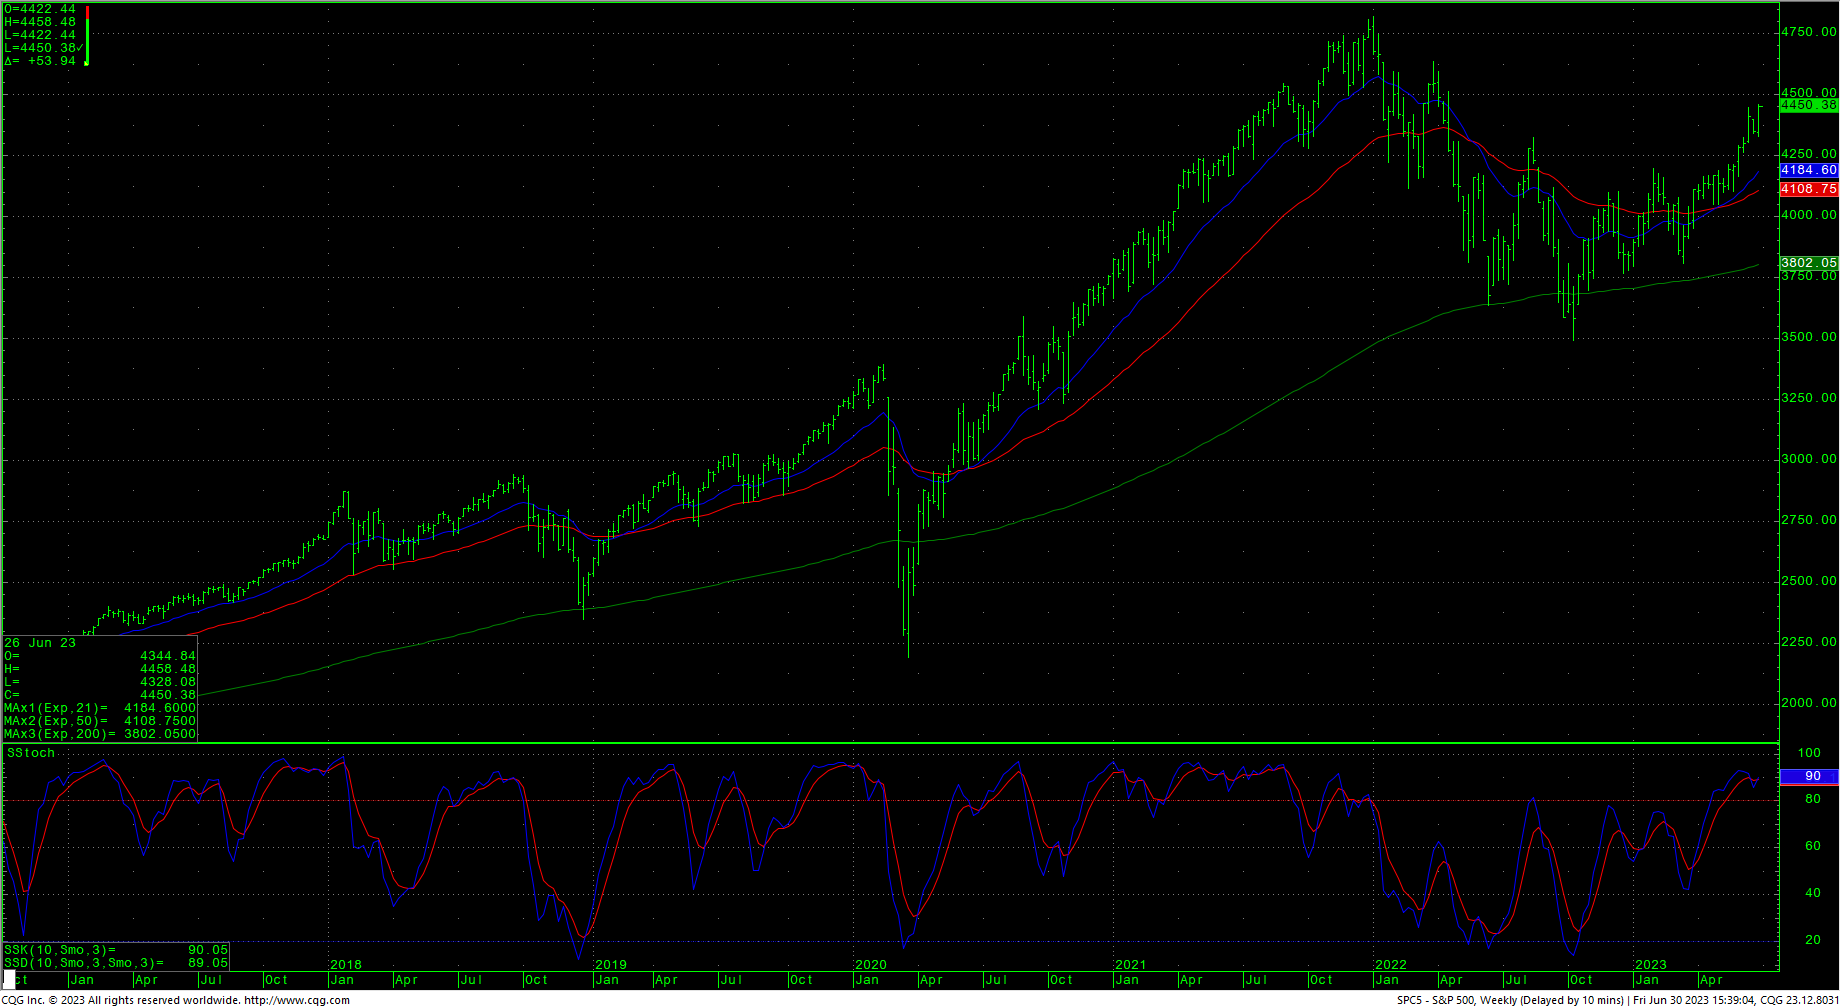
S&P 500 Index Weekly HLC
Resistance
- 4459 **
- 4486 *** ↑
- 4505 *** ↑
- 4593 **
- 4637 *** ↑
- 4665 **
- 4748 *** ↑
- 4818 *** ↑
- 4952 ***↑
- 5000 *** ↑
- 5072 **
- 5144 ***
Support
- 4408 **
- 4393 **
- 4377/4375 *** ↓
- 4358 ***
- 4328 *** ↓
- 4305 *** ↓
- 4230 **
- 4210 *** ↓
- 4133 *** ↓
- 4057/4053 *** ↓
- 3975 *** ↓
- 3860/3854 *** ↓
- 3765 **
- 3691/3680 *** ↓