
TECHNICAL ANALYSIS
Key Technical Insights from the Major Indices in the Week of September 8, 2023
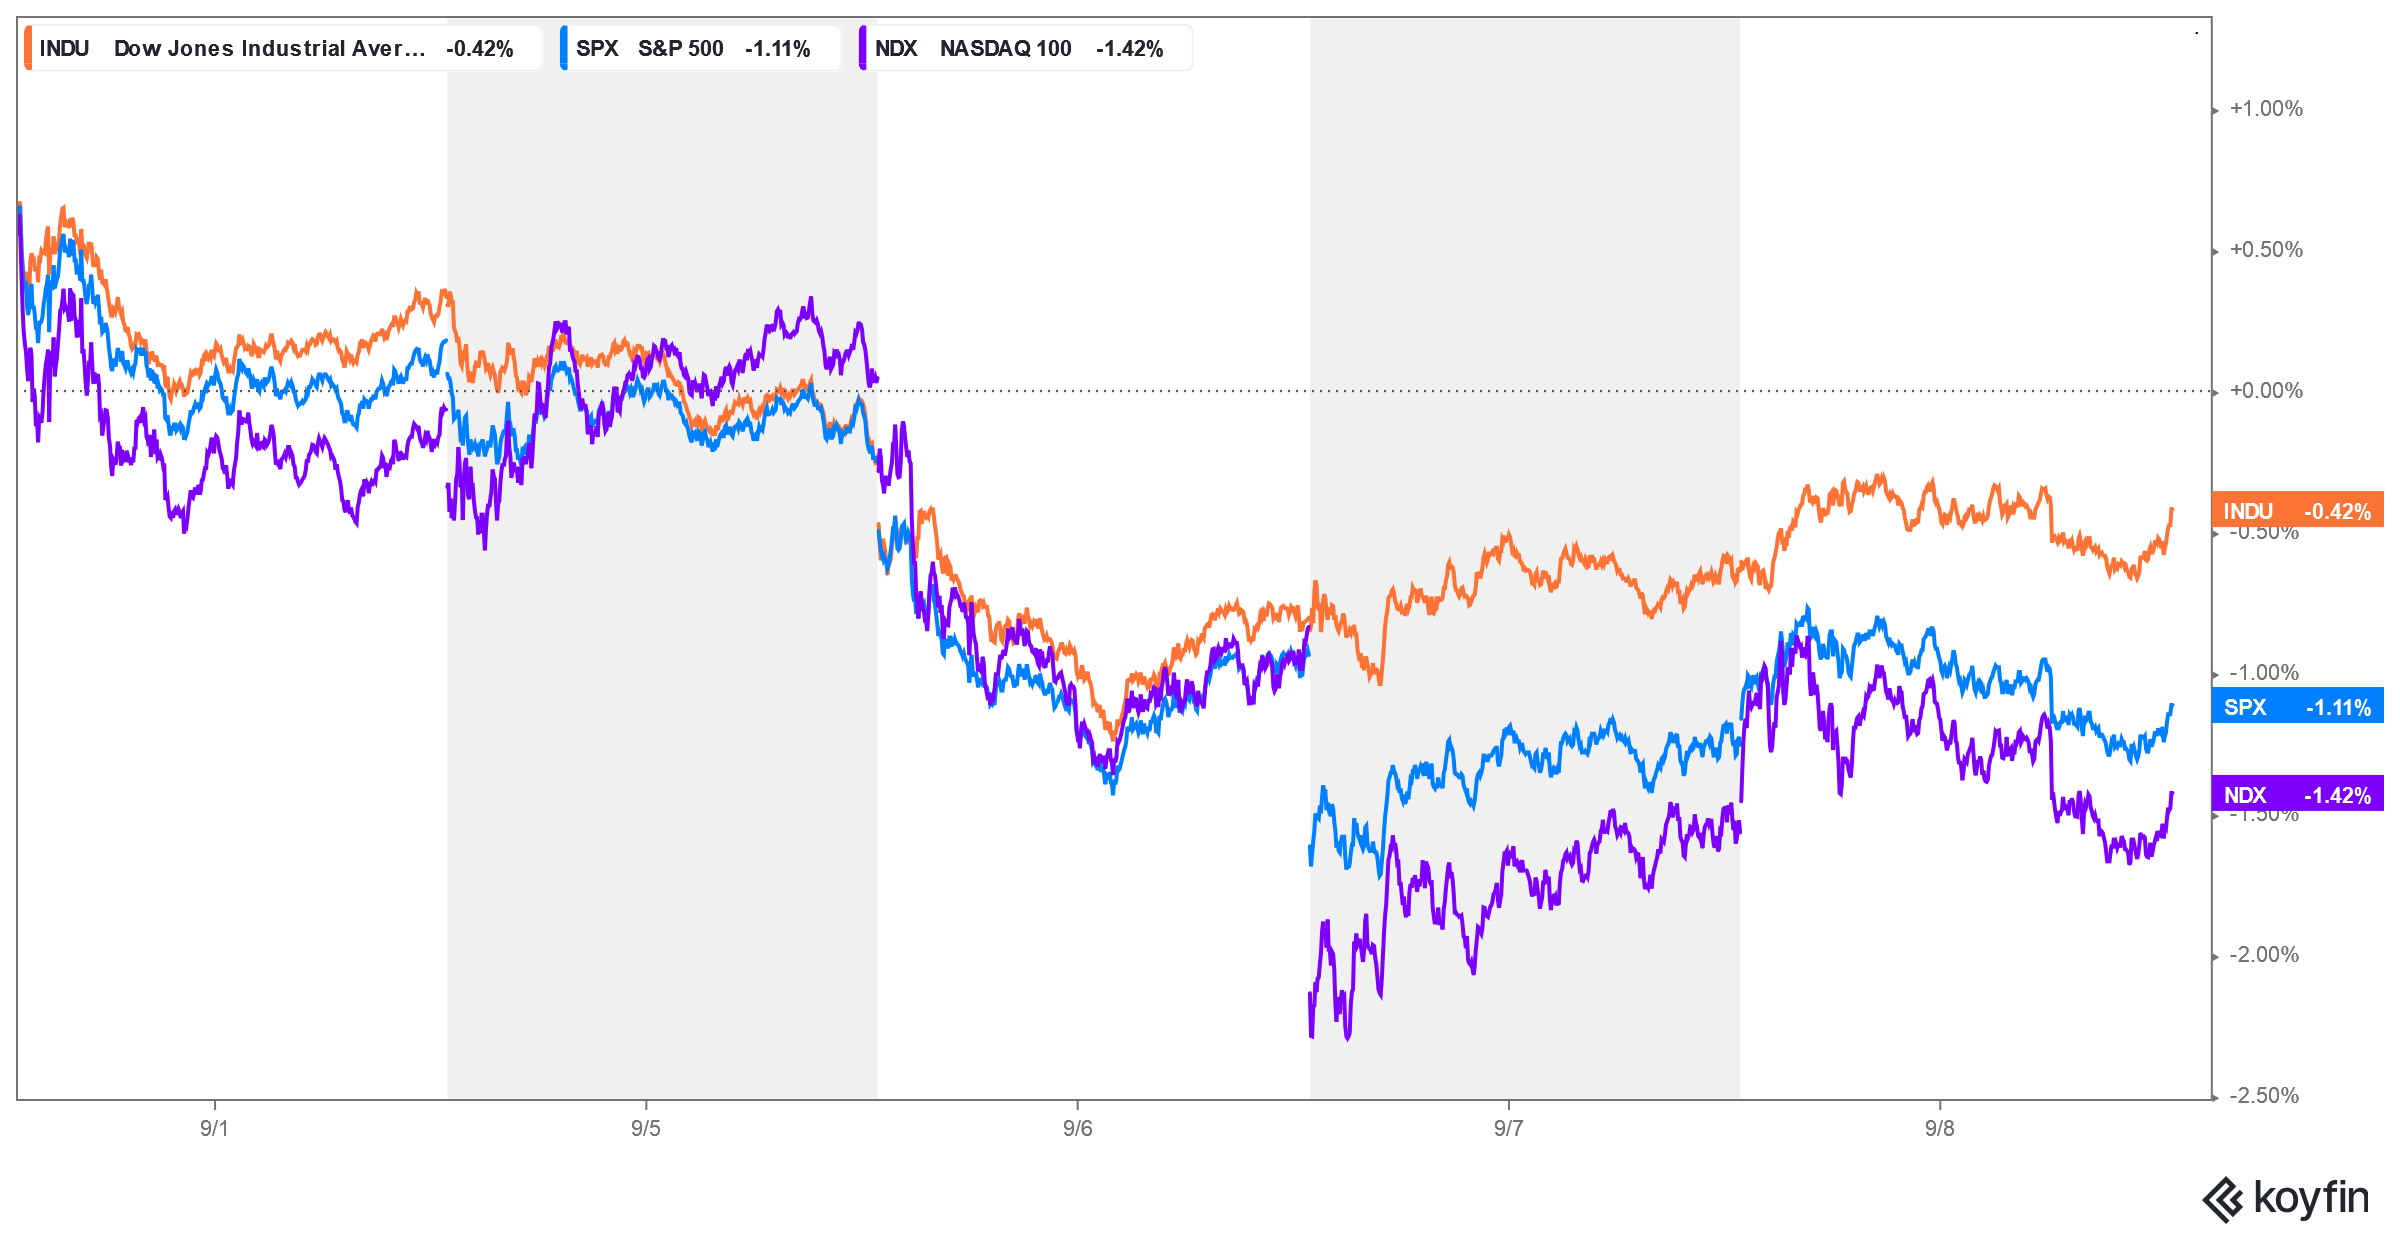
During the week, the stock market experienced widespread declines, with particular pressure on tech stocks and the Russell index. The S&P 500 saw a week of trading within a narrow range, closing closer to its lower end. Analyzing the charts, we note that weekly charts are adjusting from overbought conditions, daily charts are mostly neutral, and hourly charts briefly entered the overbought zone towards the end of the week.
Looking ahead, Monday’s trading activity had little impact, but Friday might mark a short-term shift as we enter the new week. Thursday presents a stronger short-term timing perspective, with a focus on bonds and potentially the dollar.
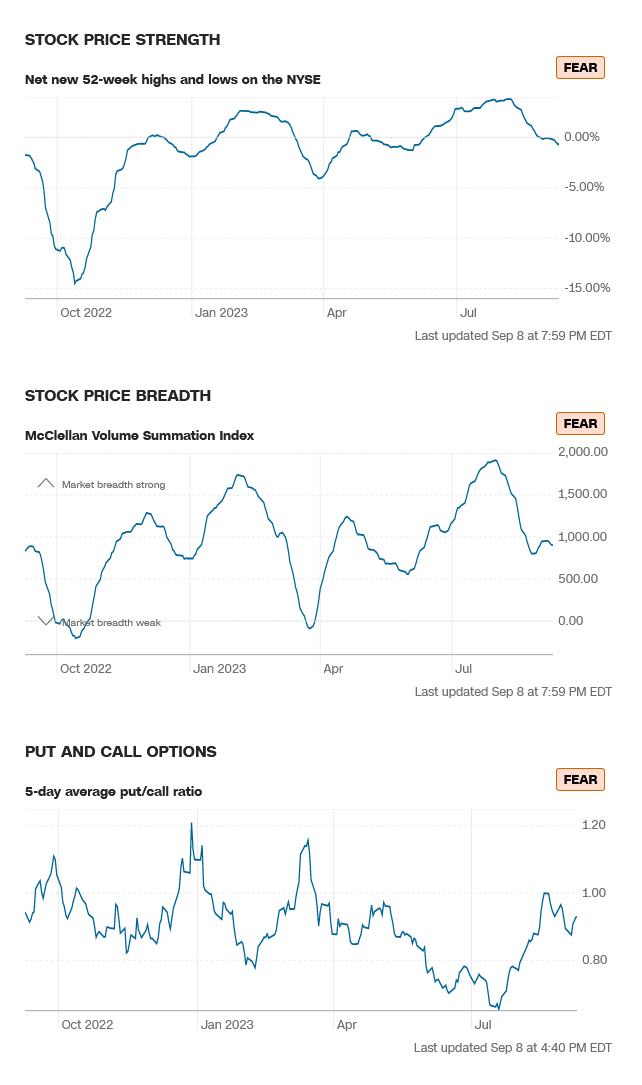
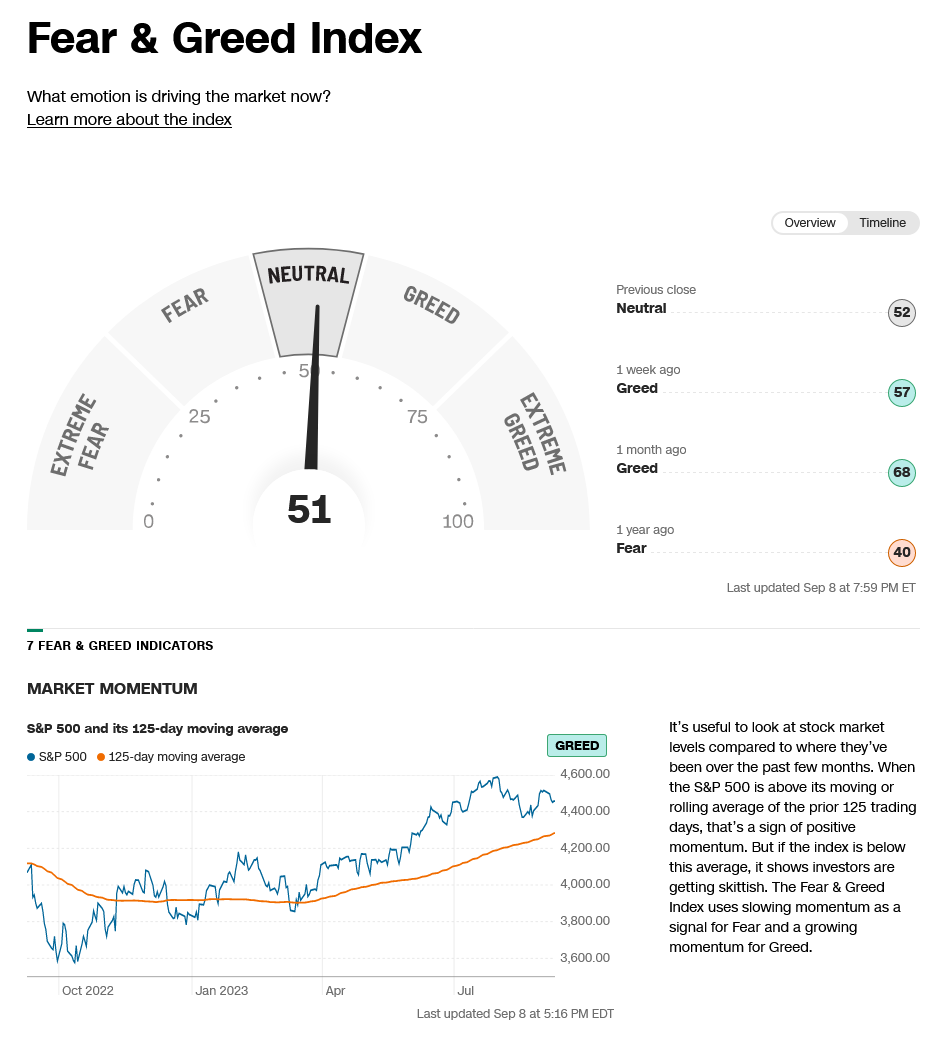
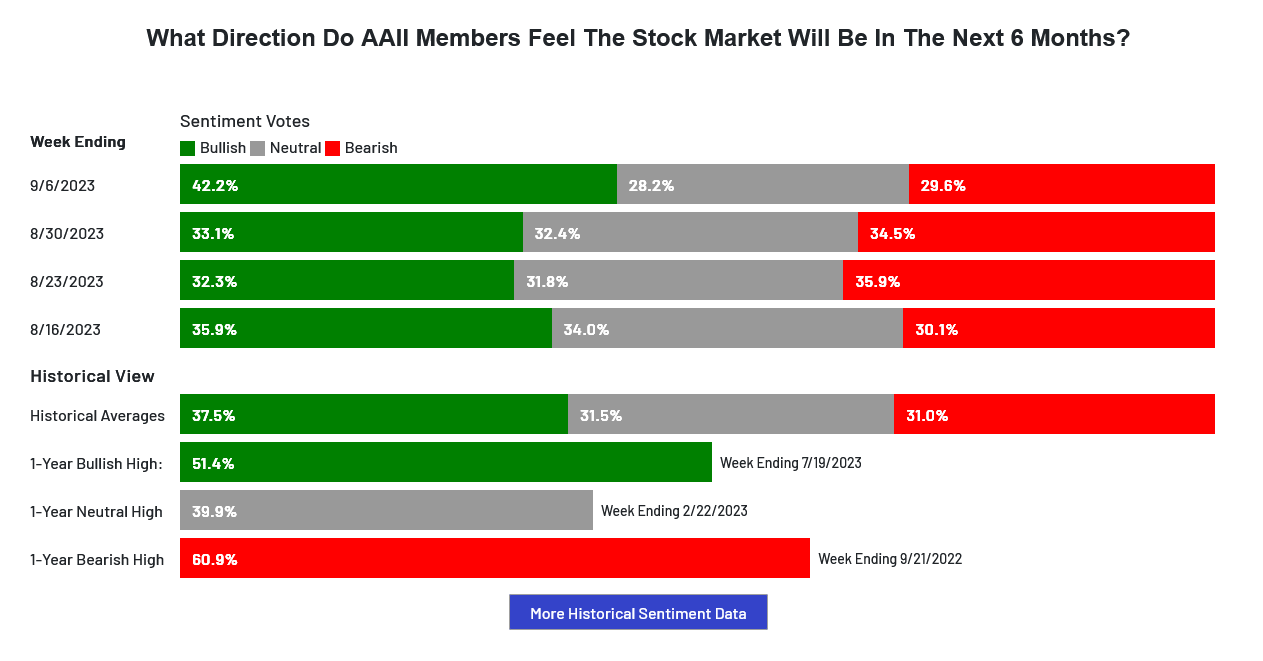
Sentiment in the market remains mixed, with polls showing a relatively flat or neutral sentiment. Fear still appears to dominate the sentiment spread between stocks and bonds. The AAII Sentiment Index, however, moved into a bullish reading for the first time in four weeks.
Examining market indicators, the VIX closed higher for the week but within the lower end of its weekly range, given the inside week’s trading. The 52-week A/D (Advance/Decline) ratio dropped to -0.69%, and the Put/Call ratio remained relatively steady at +0.93 for the past month.
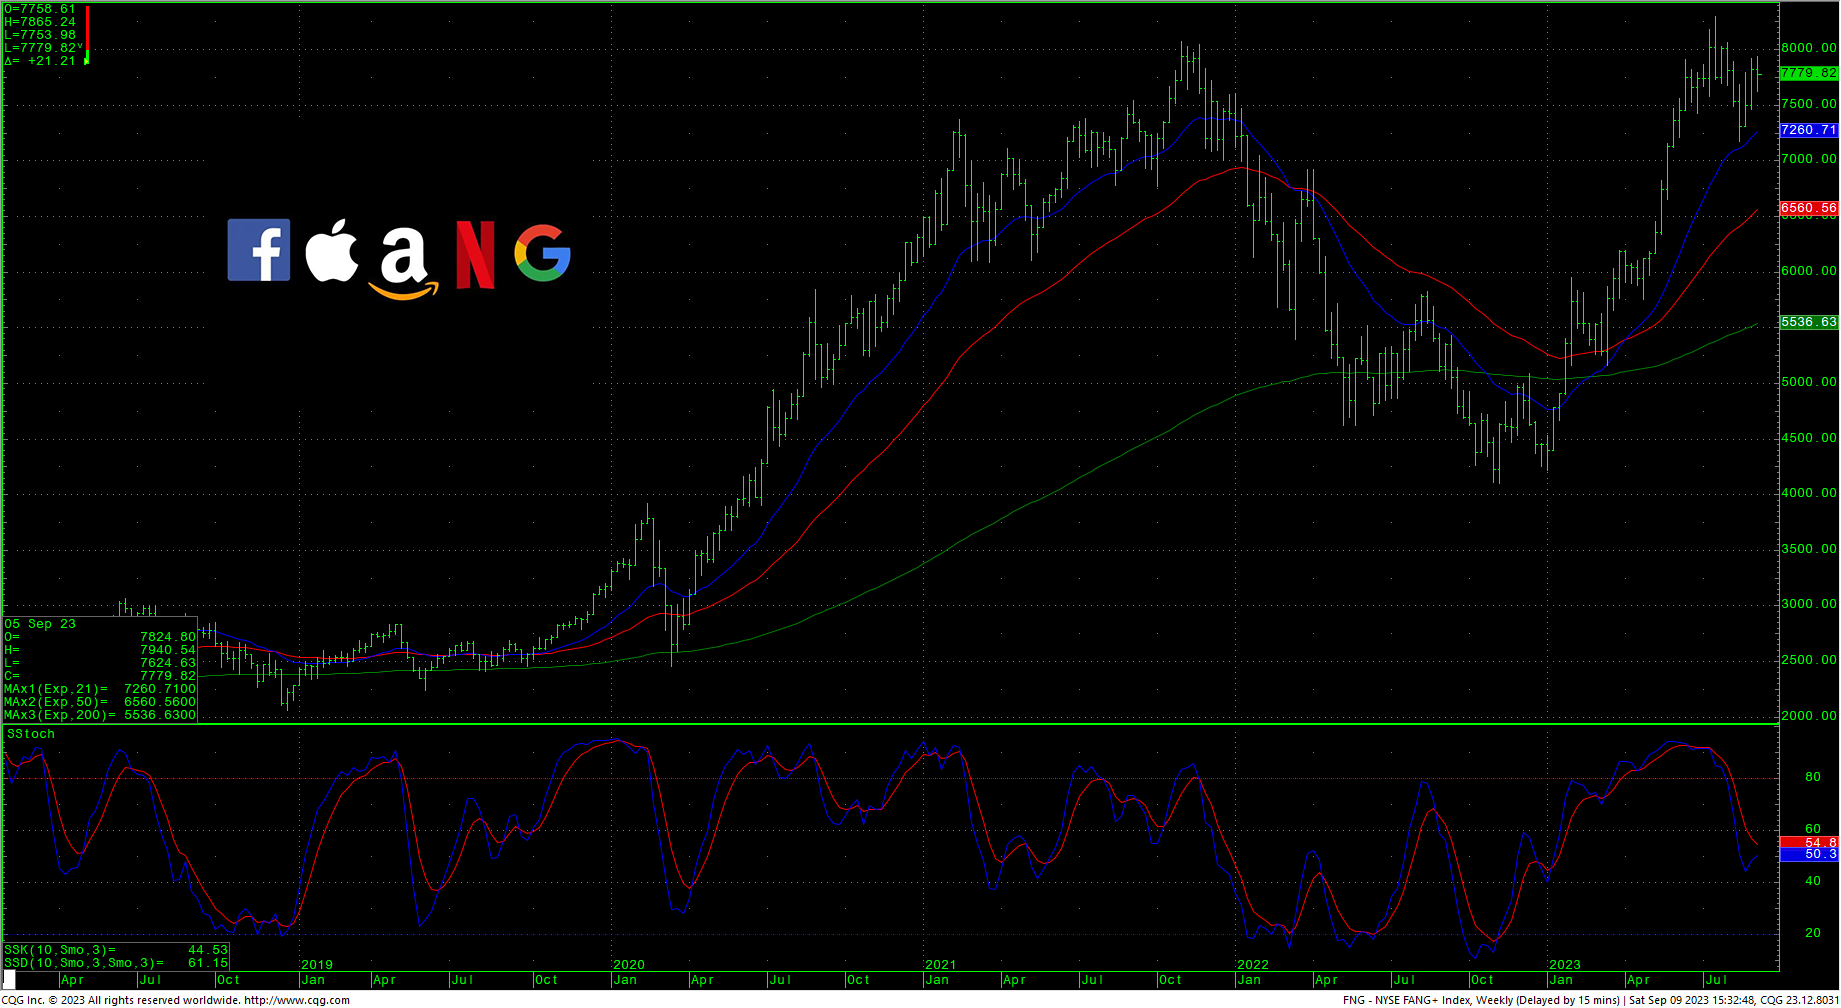
In terms of index performance, the Dow closed the week down by -0.75%, the S&P was down -1.29%, the Nasdaq declined by -1.93%, the FANG index saw a -0.58% drop, and the Russell suffered a sharp decline of -3.61%.
In the bond market, prices closed lower within a tight weekly range, and long-term charts continue to indicate oversold conditions. Commodities, on the other hand, experienced a rally, led by crude oil, which reached its highest levels since late 2022, setting new highs for 2023.
While examining the Commitment of Traders (CoT) report, it appears to be relatively stable with no significant changes lately. Commercial holdings have returned to their lowest levels since mid-2022.
Timing Points
09/14 *** bonds
09/22 **
09-28 *** X extreme/fast moves
Market Sentiment Indicators:
-
CNN Fear & Greed Index
-
AAII Investor Sentiment Survey
AAII Investor Sentiment Survey
Dow Jones Industrial Average (DJIA) Hourly Analysis:
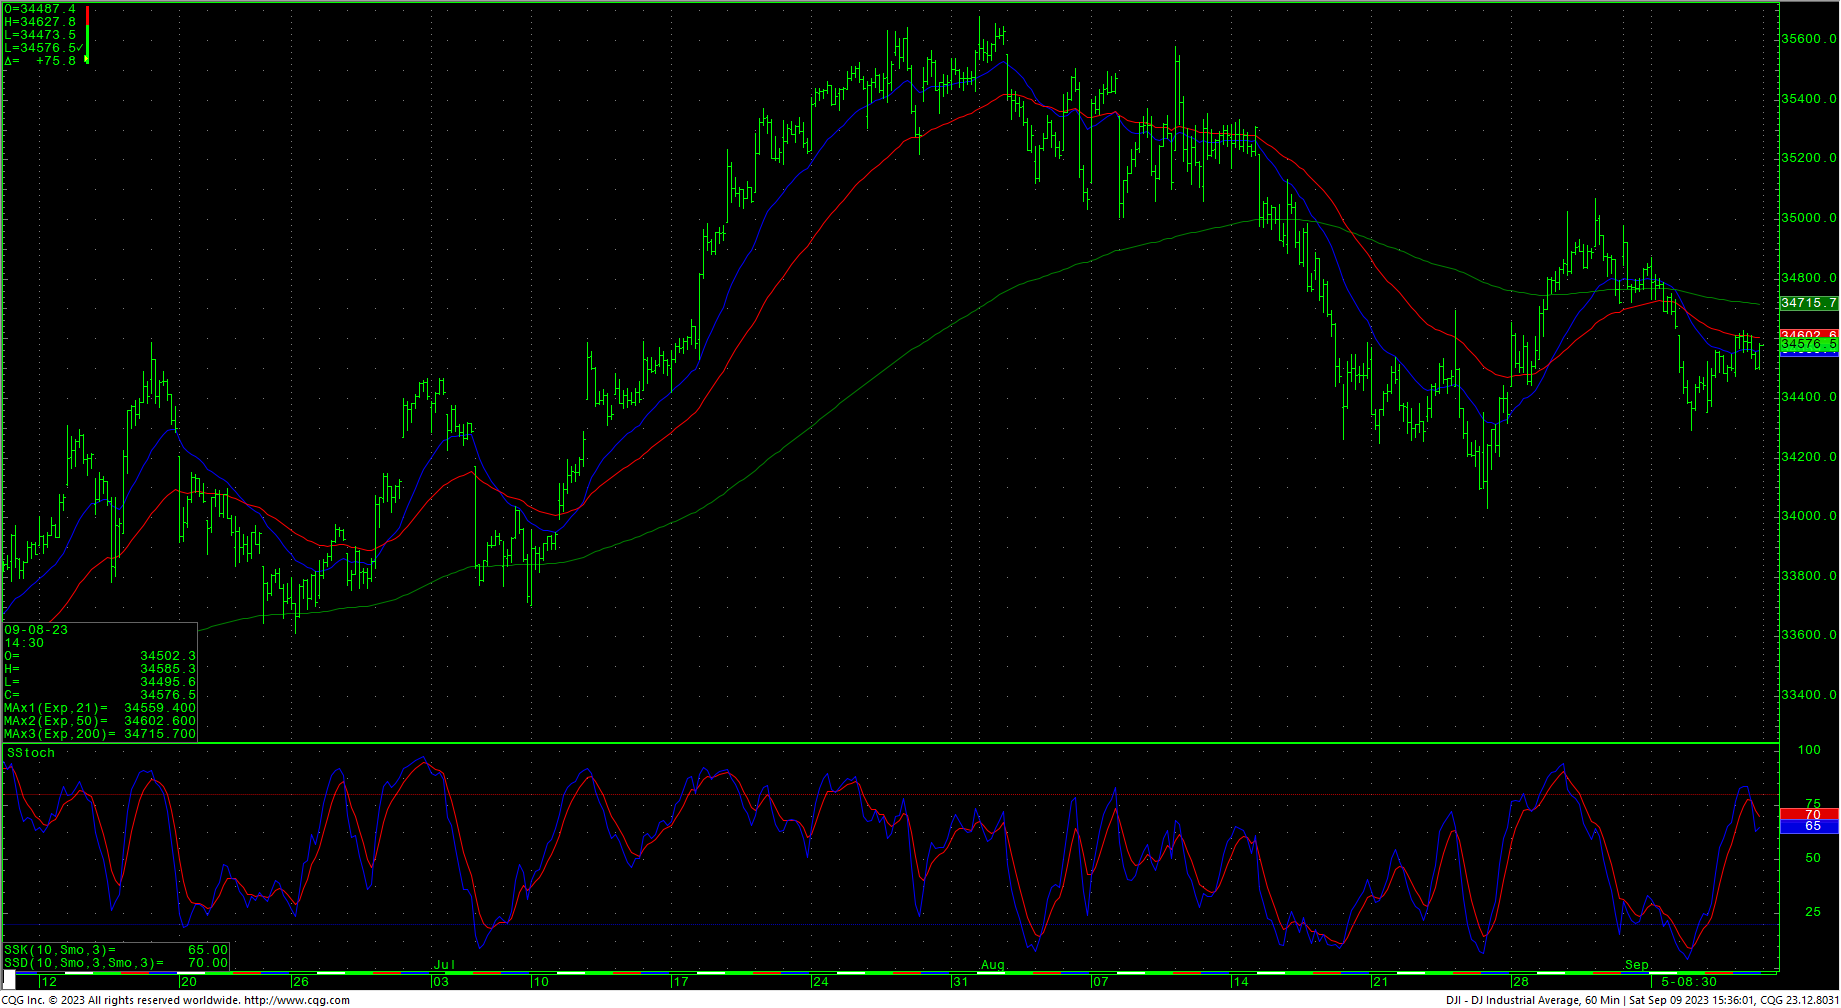
The DJIA’s hourly performance indicates a reaction to slightly overbought conditions in the short term. Support levels are at 34549, 34426/34420, with a potential further breakdown leading to tests at 34289/34274 and 34022. A significant breach under 34420 could retest 34289/34274 and open the door to short-term critical support at 33767/33760. Daily closes below 33760 may lead to a test of major short-term support in the 33359 through 33316 area. If closes go below 33316, it could test 32998, potentially moving to critical intermediate-term support at 32586/32580. Going below 32580 might suggest a move to 32170, with potential counts to critical intermediate-term support at 31341/31330.
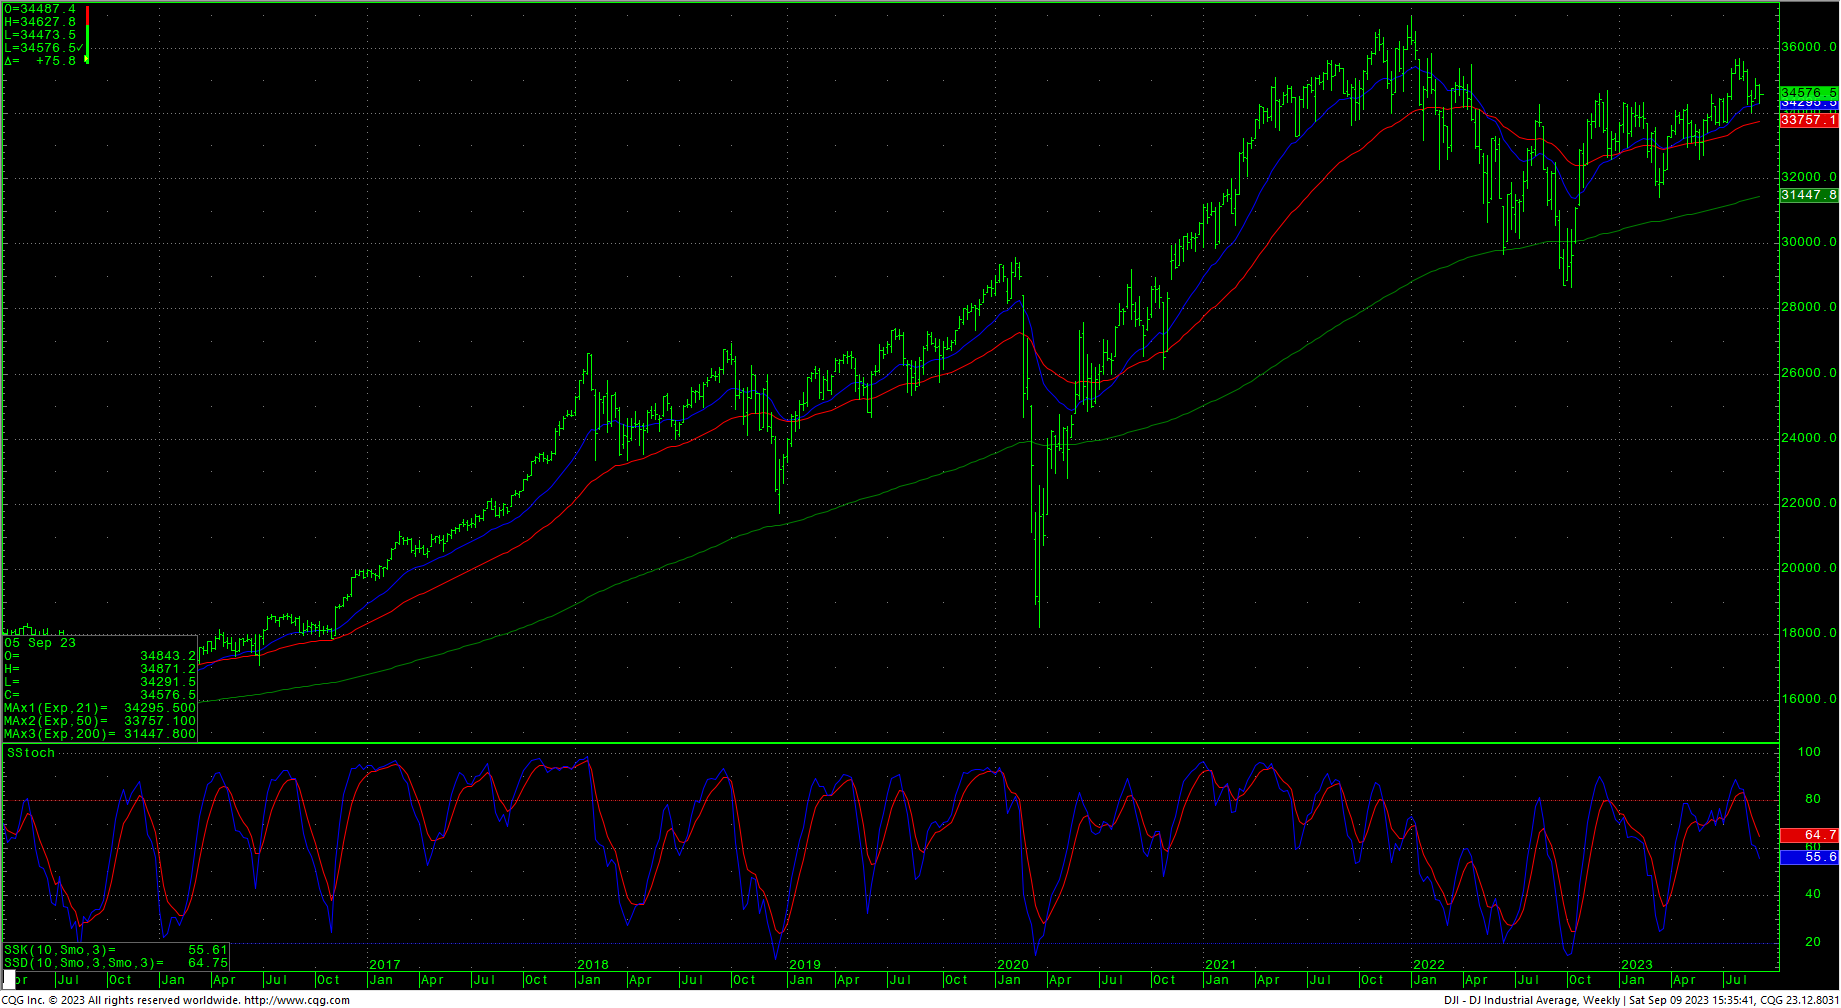
Resistance levels for the DJIA are at 34659, 34854, and short-term pivotal points at 35048/35055. If the DJIA rallies with closes above 35055, it could test last-gasp resistance at 35266/35289. Closes above 35289 could set up a test of the trading highs at 35679, with intermediate counts to 35824 and longer-term counts leading into a gap area on the daily chart at 35996 to 36044. A breakout over 36044 may open the door to the 36513 area, with potential to test the all-time record highs at 36952. It’s important to remember the larger inverted H&S (Head and Shoulders) pattern on the DJIA weekly, which suggests long-term targets at 37095.
Dow Jones Industrial Average Weekly HLC
Support
- 34549 ***
- 34426/34420 ***↓
- 34132 **
- 34020/34022 *** ↓
- 33865 **
- 33767/33760 *** ↓
- 33610 *** ↓
- 33537 **
- 33400/33399 *** ↓
- 33359 ** ↓
- 33316 ** ↓
- 33187 ** ↓
- 33091 *** ↓
- 32998 *** ↓
Resistance
- 34659 **
- 34854 *** ↑
- 34941 **
- 35048/35055 *** ↑
- 35266/35289 *** ↑
- 35354 ** ↑
- 35432 **
- 35578 ** ↑
- 35670 *** ↑
- 35800/35824 *** ↑
- 35996 ***
- 36044 *** ↑
- 36271 **
- 36390 **
- 36513 ***↑
- 36636 **
- 36934/36952 *** ↑
- 37095/37096 *** ↑
S&P 500 Cash Index
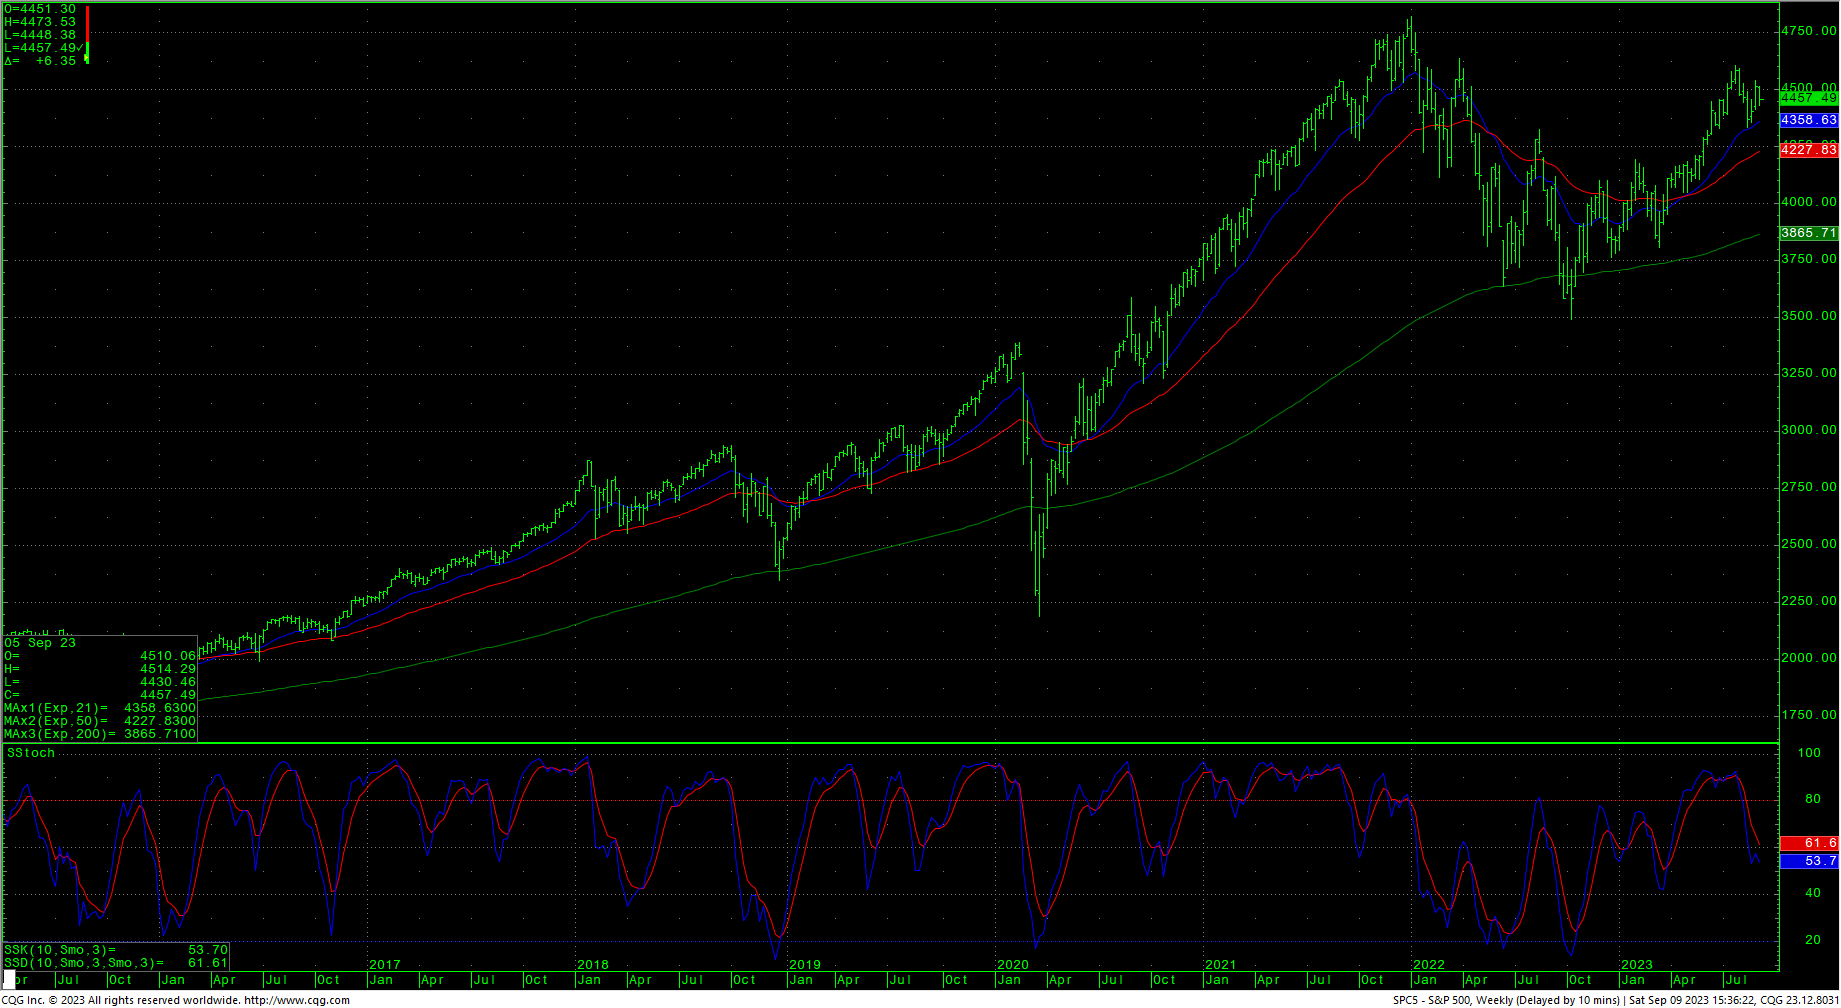
The S&P 500’s hourly performance also indicates slightly short-term overbought conditions while remaining neutral. Prices have retreated under pivotal resistance at 4503/4510, with further resistance at 4474 and 4503/4510. Rallies with closes above 4510 could set up a minimal test of 4550 and 4575. Closing above 4575 would be bullish for a test of the swing high at 4607, with potential for a minimal test of 4637. A breakout with closes above 4637 could open the path toward 4748 and ultimately 4818. Beyond the record highs, it could lead to counts at 4952/5000, with potential to reach 5144.
Support for the S&P 500 is at 4434/4430, with near-term pivotal points at 4413/4410. Closing below 4410 may lead to tests at 4328. A breakdown with closes under 4328 could set up a move to 4180/4177. Closes under 4177 open counts to 4049 and critical short-term support at 3917/3910. Daily closes below 3910 may open counts to 3754/3750, with potential support at 3503/3491.
S&P 500 Index Weekly HLC
Support
- 4434/4430 *** ↓
- 4413/4410 ***↓
- 4380 **
- 4356 **
- 4335/4328 *** ↓
- 4304 **
- 4280 **
- 4261 *** ↓
- 4180/4177 *** ↓
- 4049 *** ↓
- 3917/3910 *** ↓
- 3875 **
- 3754/3750 *** ↓
- 3625 **
- 3500/3491 *** ↓
Resistance
- 4474/4475 ** ↑
- 4503/4510 *** ↑
- 4527 **
- 4541 **
- 4550 *** ↑
- 4575 *** ↑
- 4593 **
- 4607 *** ↑
- 4637 *** ↑
- 4665 **
- 4748 *** ↑
- 4818 *** ↑
- 4952 ***↑
- 5000 *** ↑
- 5072 **
- 5144 *** ↑