TECHNICAL ANALYSIS
SPECIAL REPORT
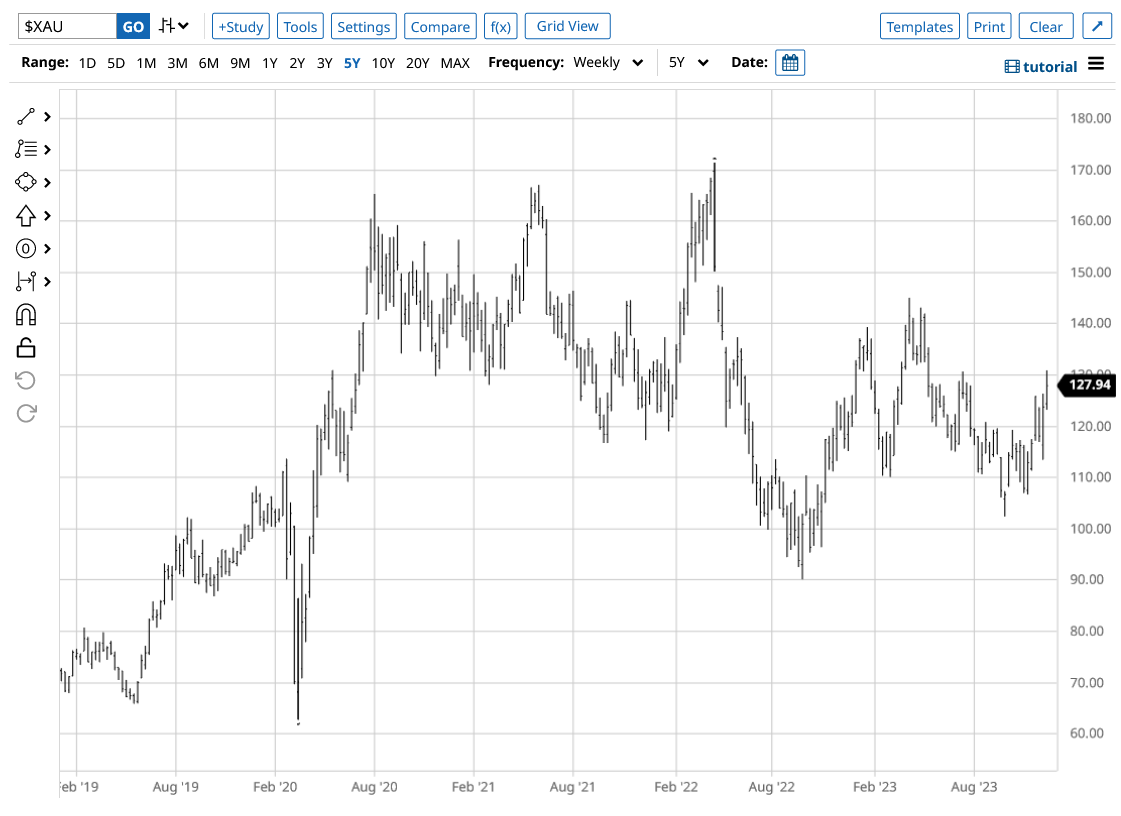
PHLX-XAU Gold/Silver Index
 HUI Gold Bugs Index
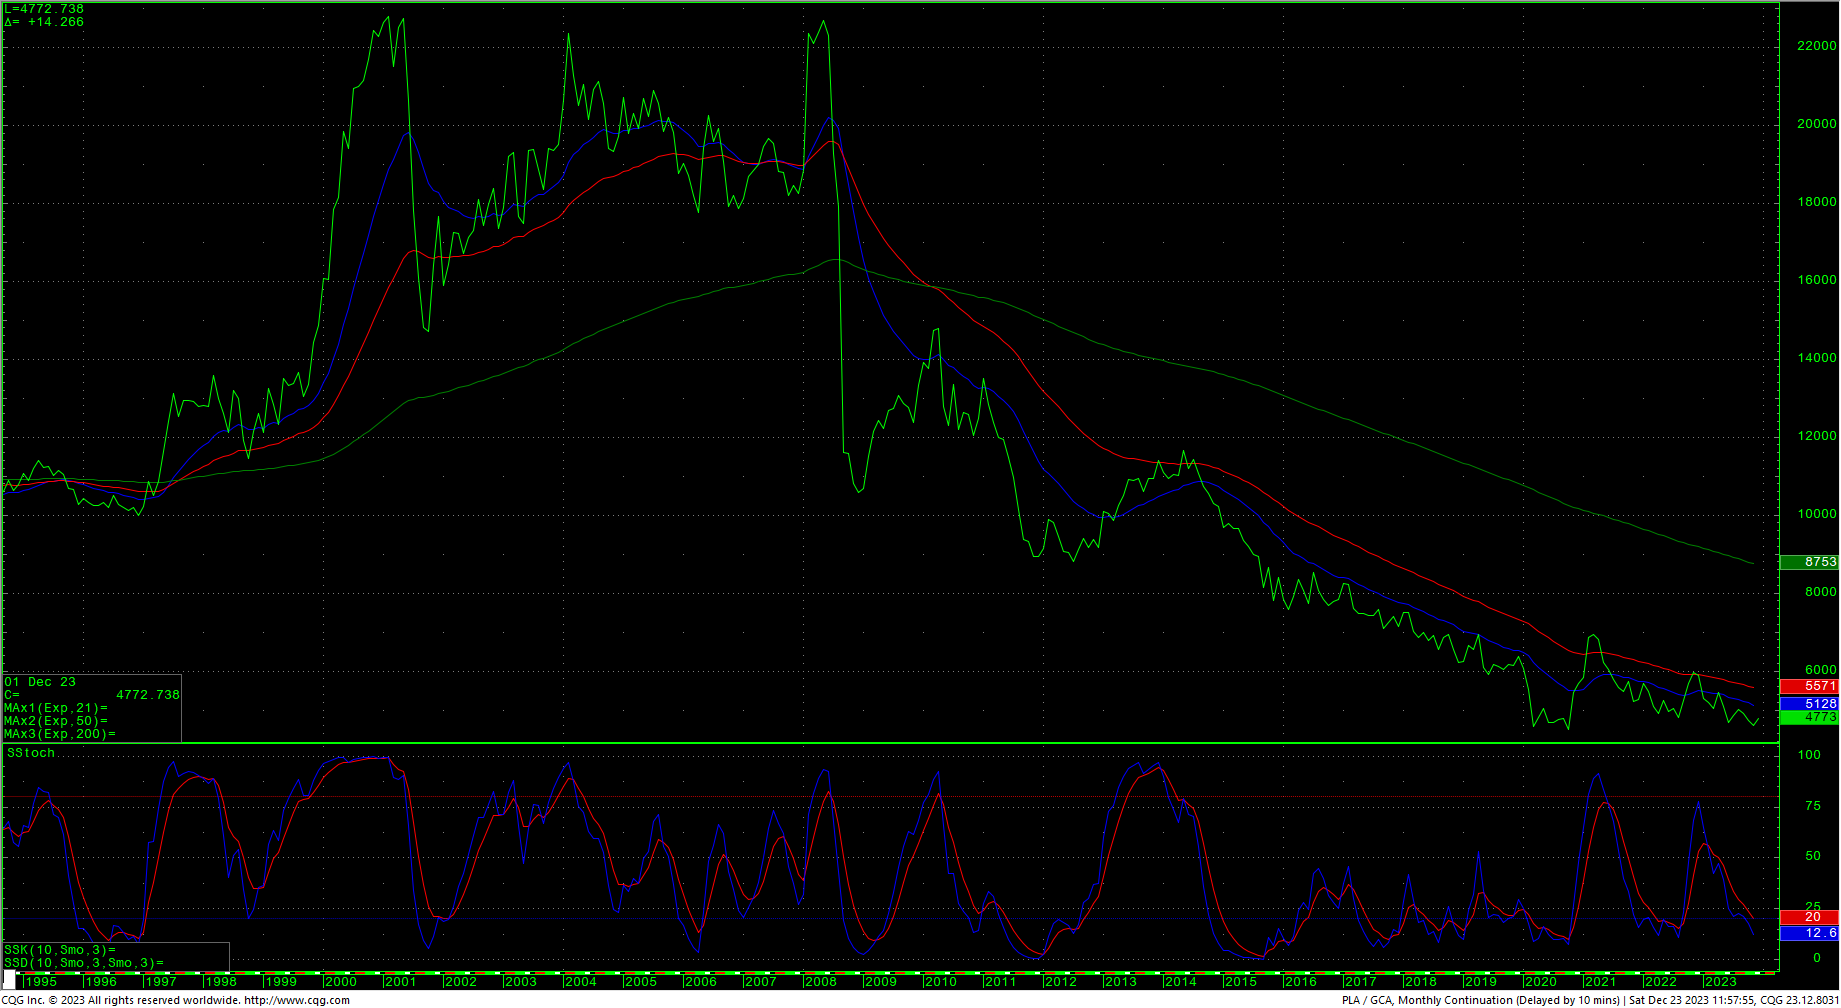
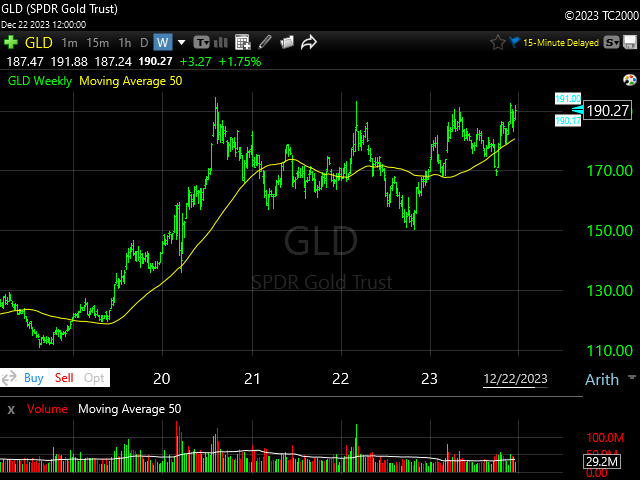
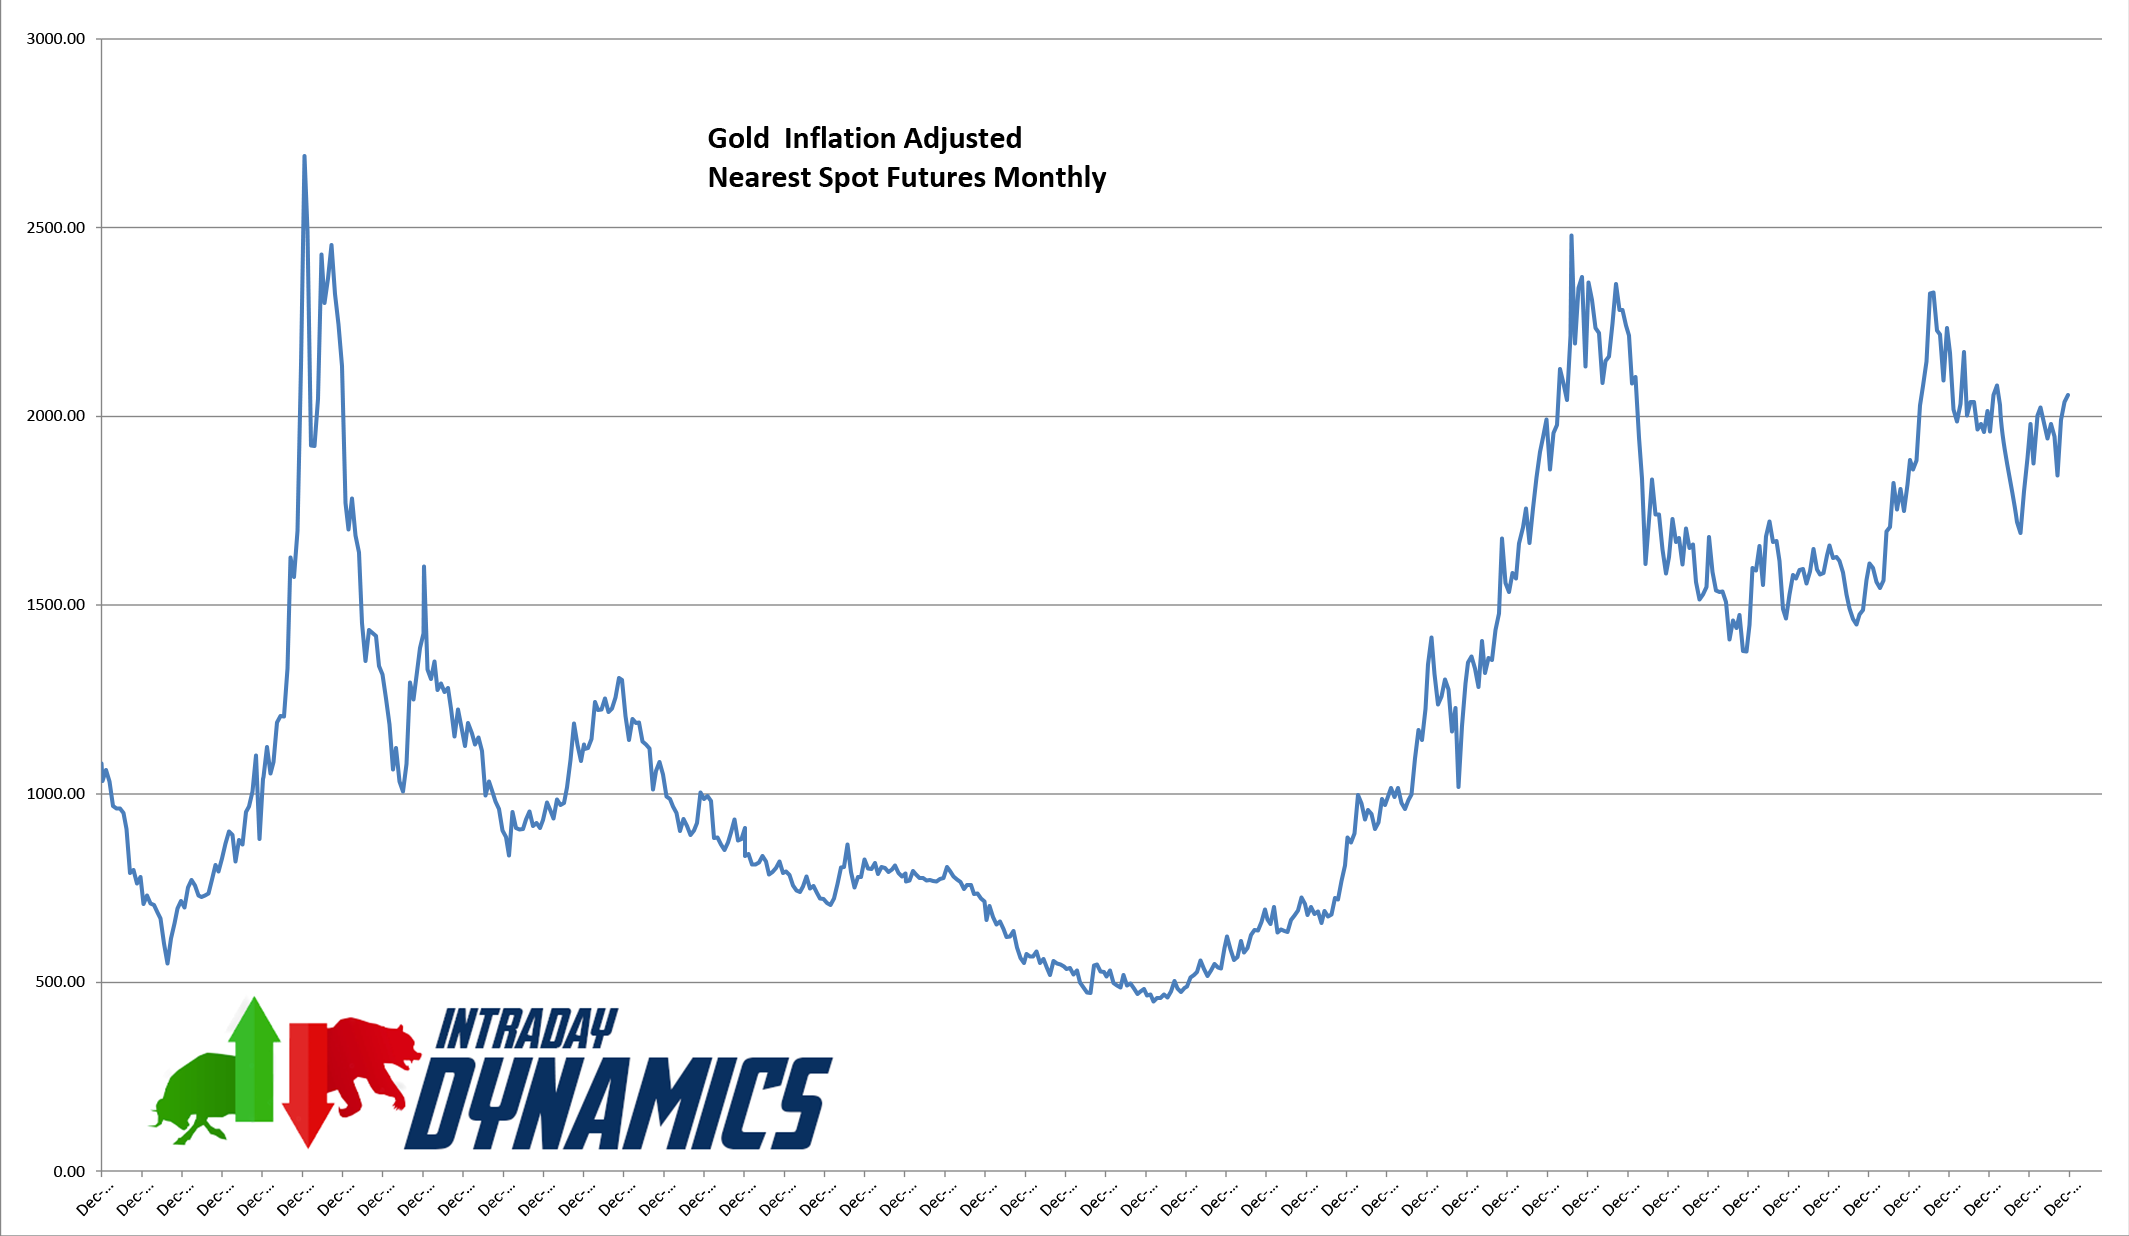
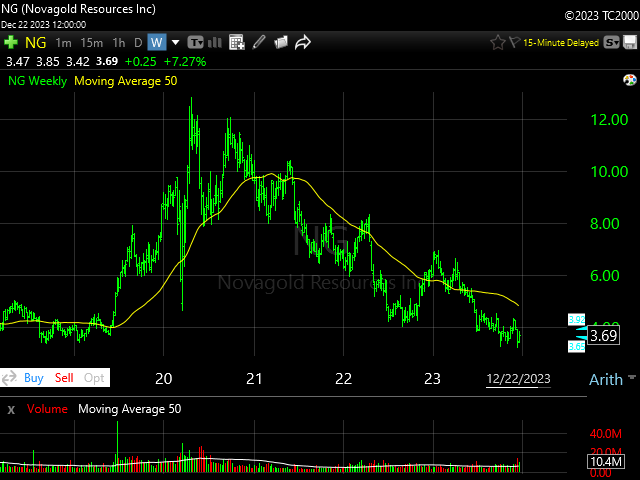
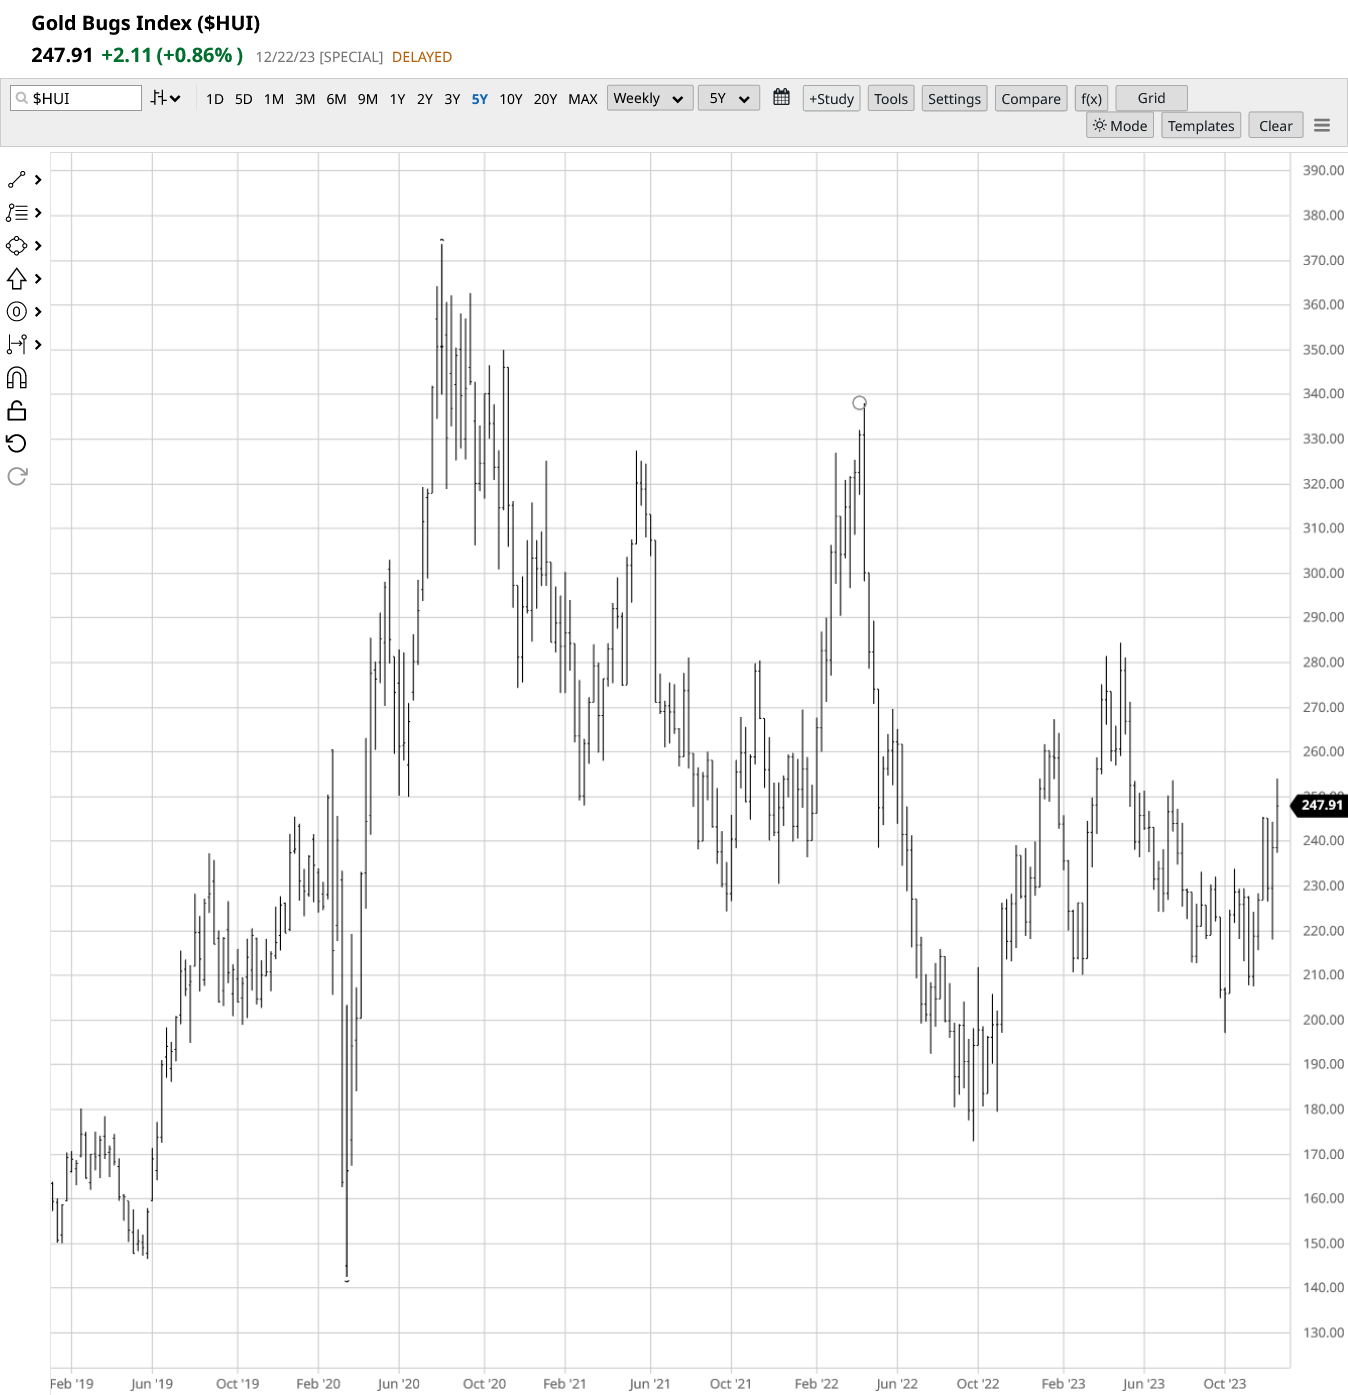 Gold futures set an all-time record high on 4 December 2023 at 2130.20 basis spot and then collapsed sharply before regaining the ‘uptrend’ heading into Christmas Week with a rally that carried spot to the second highest weekly close. The weekly is overbought and the monthly is neutral but the near-term trend in the CoT shows commercials liquidating while speculators are climbing on board. Many gold stocks, and some of the indices are lagging seriously behind the futures (see charts above). The recent technical action does indicate higher targets for spot prices. Volume and Open Interest is neutral. That said, with the commercials dumping and the reality that the neighborhood tends to include a cast of people that are accessorizing their bunkers…otherwise known preppers or doomsday survivalists, the next few weeks should be indicative as to the life of these long-term trends. Outside of the Inflation-Adjusted chart leaving lots of room on the upside, it can be noted that at the last major bottoms the commercials were way out of step as they loaded up on shorts. The SPDR GLD chart is threatening to take out the last few years of tops. The Platinum/Gold ratio remains inverted at an extreme discount.
Platinum/Gold Monthly Continuation
 SPDR Gold Trust
 Monthly Gold Futures Inflation-Adjusted
 Monthly Gold Futures H-L-C Log Scale
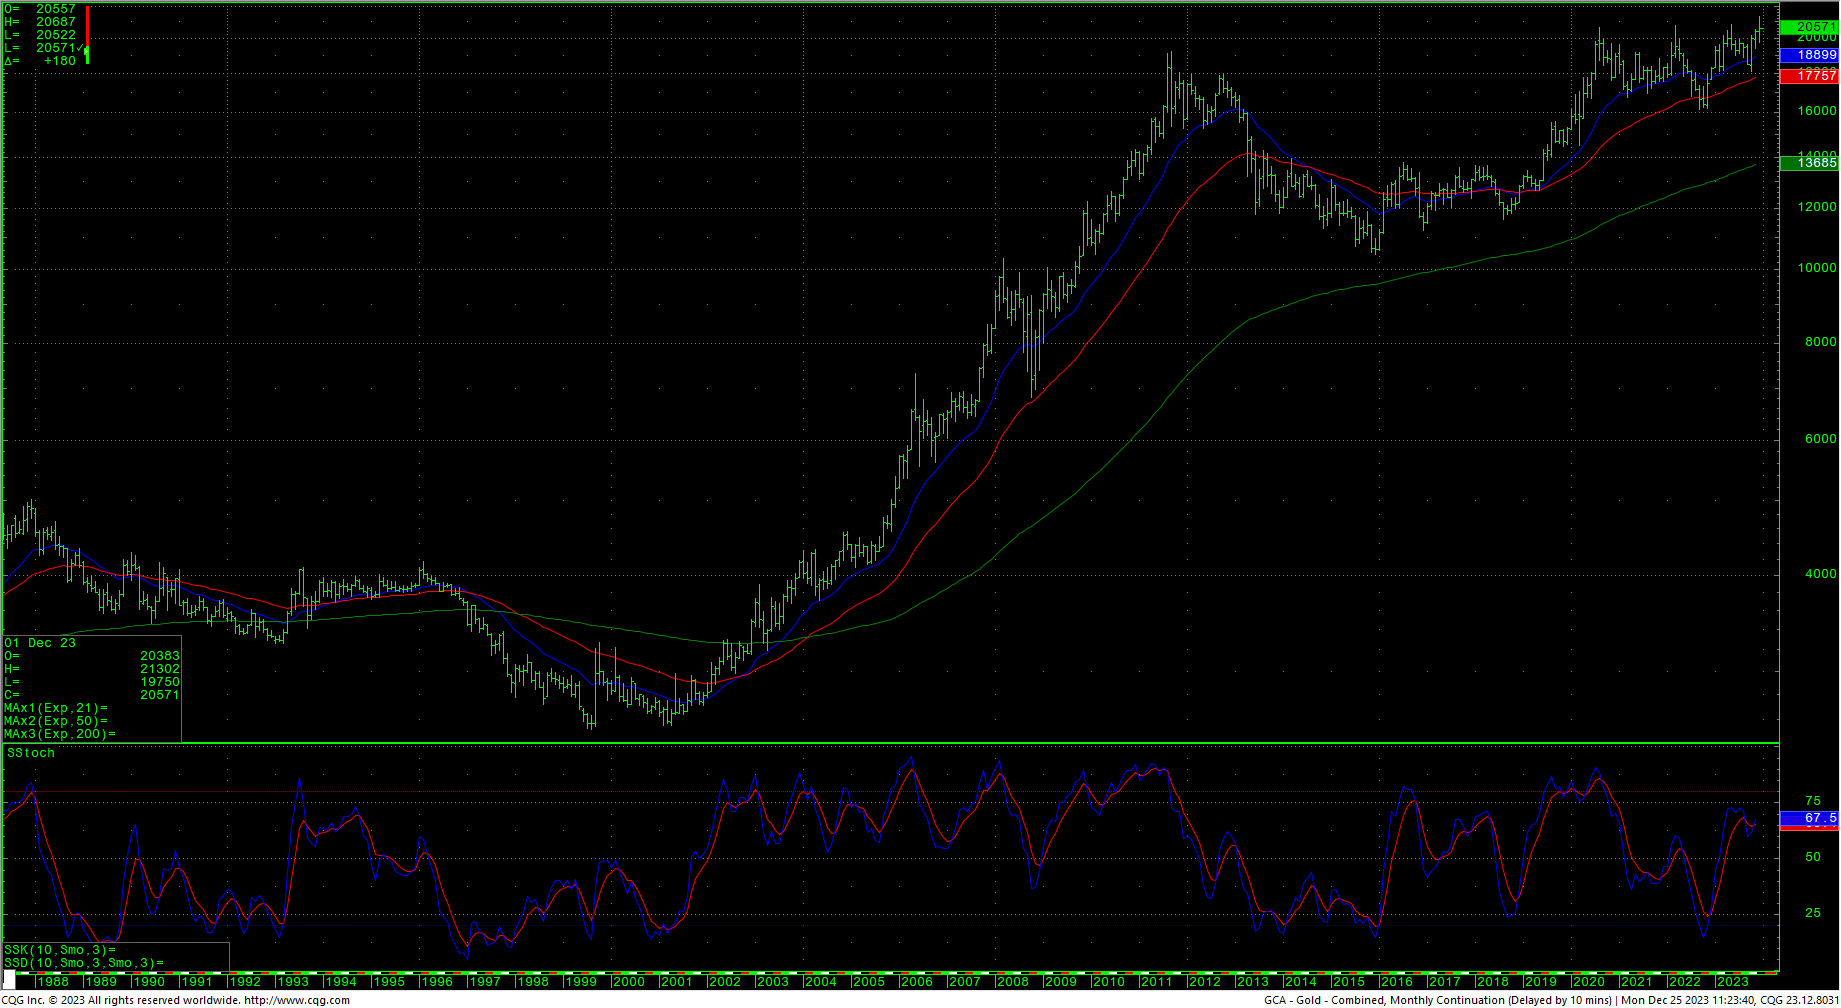 Resistance (basis the FEB: GCG4), short-term, is 2078.8, 2083.0 and pivotal at 2089.4/2091. Closes over 2091 suggest a move to 2111/2113 with potential to the contract highs at 2152.3. A drive with closes over 2152.3 gives upside counts to 2215.1/2232 with resistance at 2196. Closes over 2215 should carry to 2232 with counts to 2268. The FEB-FEB monthly chart offers counts to 2538.5.
FEB-FEB Gold Futures Weekly
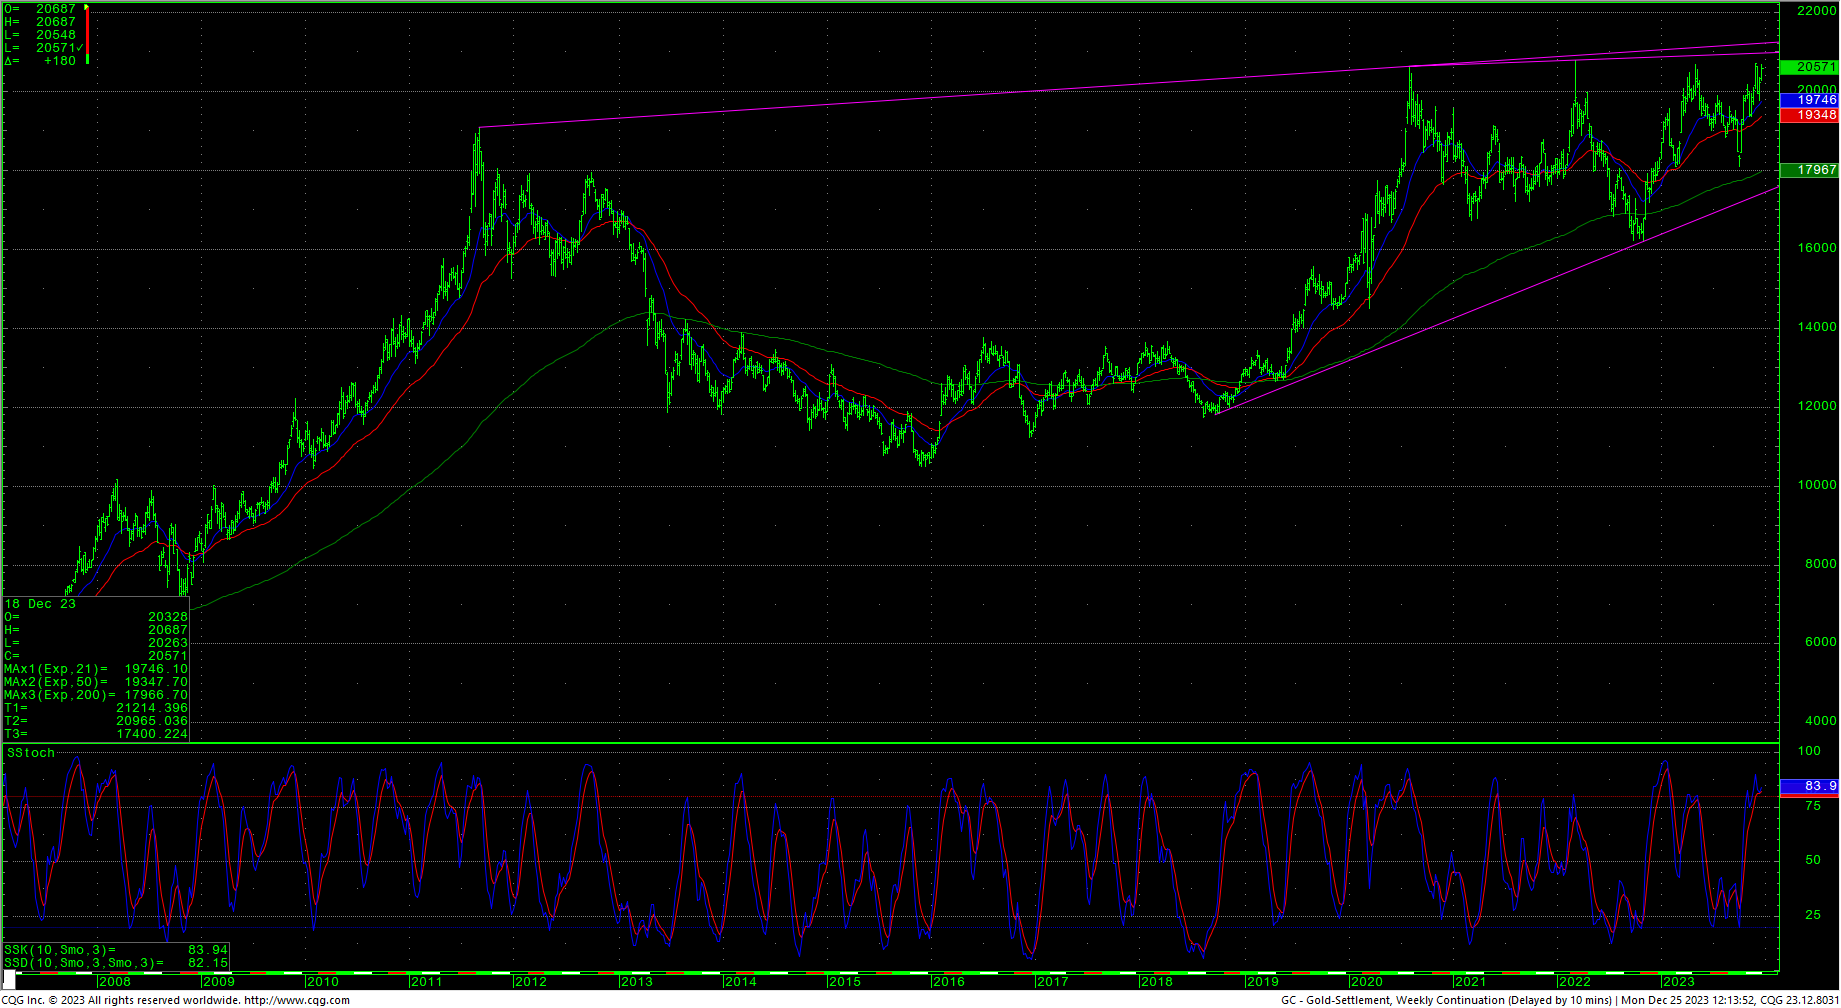 Support, basis the FEB (GCG4) contract is 2063/2061, 2047.9, 2037.1 and pivotal at 2012.8/2011. Closes under 2011 minimally count to 1990.4/1987.9. Closes in GCG under 1987.9 opens counts to 1940.4 with support of 1974.3 and 1955.4. Closes under 1940.4 suggest a move to critical support of 1890.4/1889.
Charts courtesy of CQG, Inc.