
TECHNICAL ANALYSIS (by Intraday Dynamics)
Major Indices Week of March 15, 2024
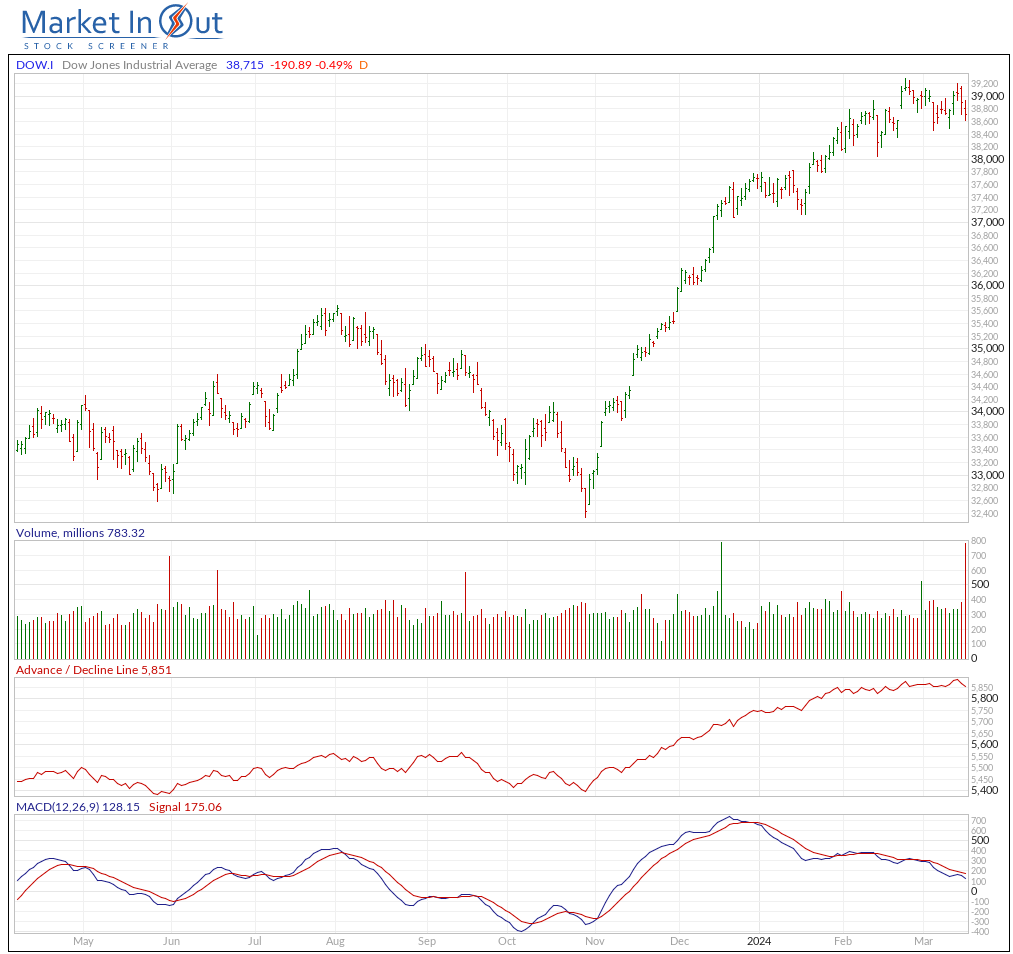
 Stocks traded another manic week, finishing out a high-volume, triple-witching Friday with selloffs across the board. At this juncture, the Dow has now moved into a trading range and charts are testing sharply sloping trendlines. Technically, everyone can see what is going on here. Trendlines, very sharp ones, are being challenged as the oscillators continue to show massive divergences. The sketchy price action has brought out a raft of super-bears who have not only announced that the ‘top is in,’ but that a massive crash is imminent because of ‘the bubble.’ The current psychology in the markets is a close mirror to 1987, where insistent predictions of a massive crash were met with surges in prices that carried the Dow to record highs for six months until the highs were in. Briefly, this is an awful lot of hoopla for basically an unchanged week. The Dow is down -1.07% from the record high. Short-term charts are deeply oversold. The Dow monthly looks healthy.
 CFTC S&P 500 Speculative Net Positions
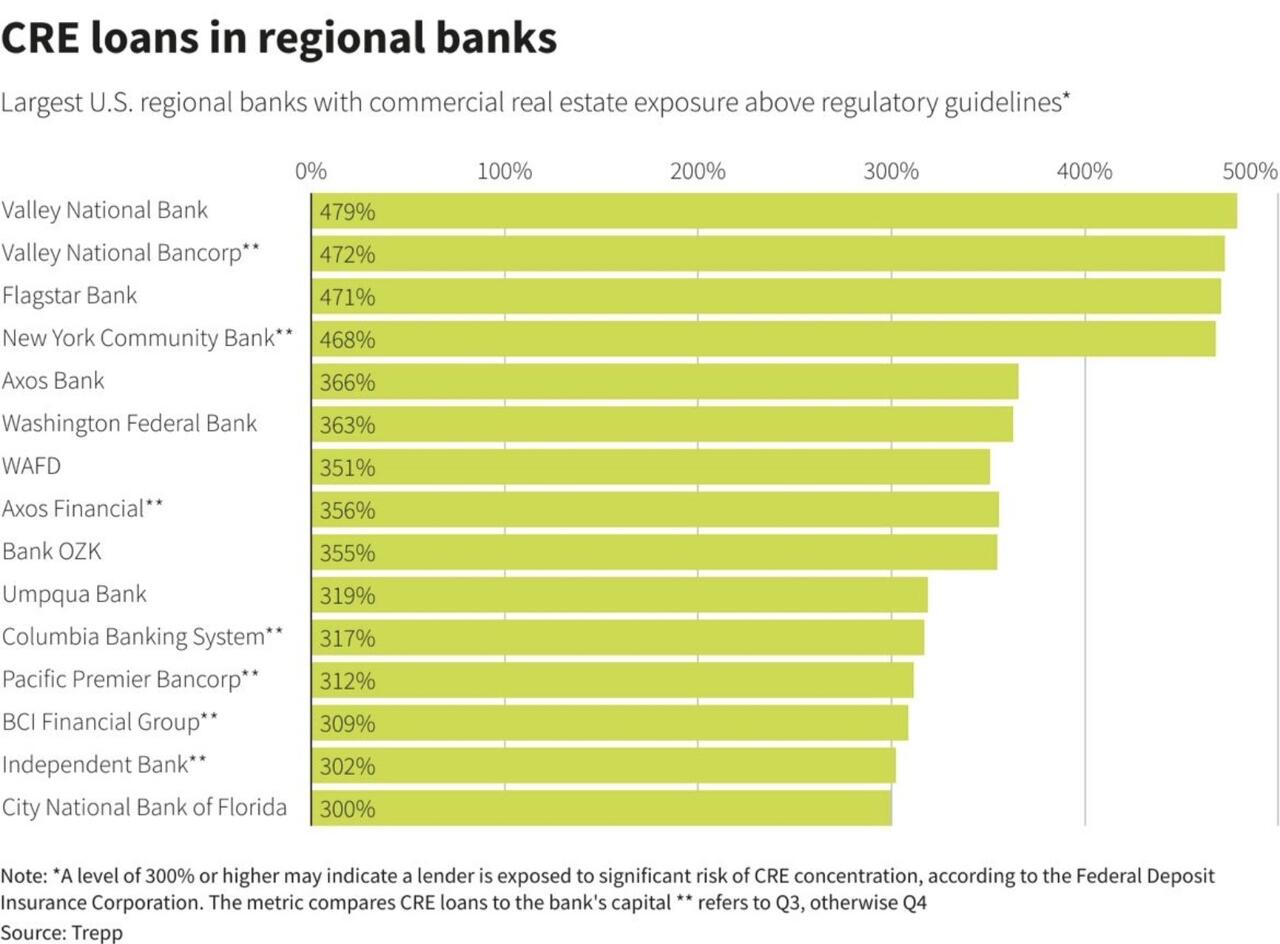
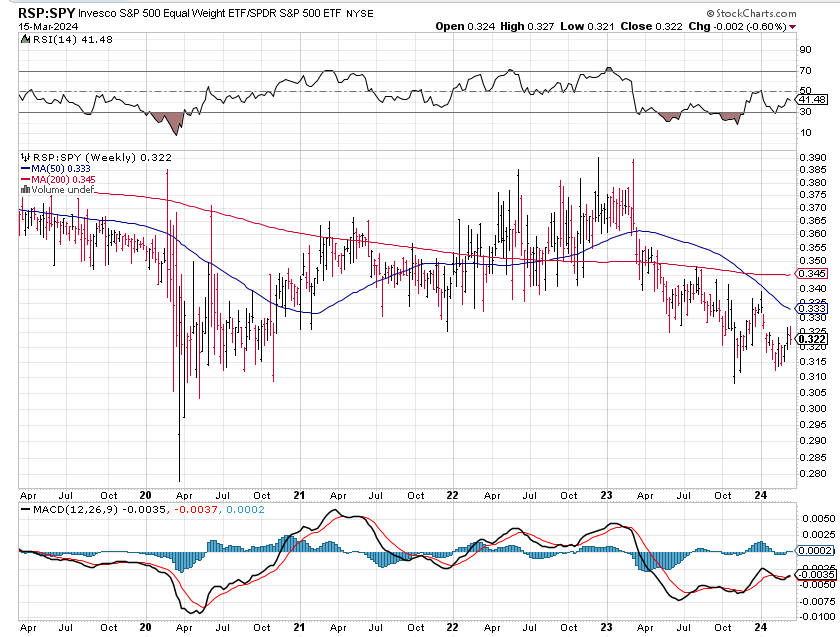
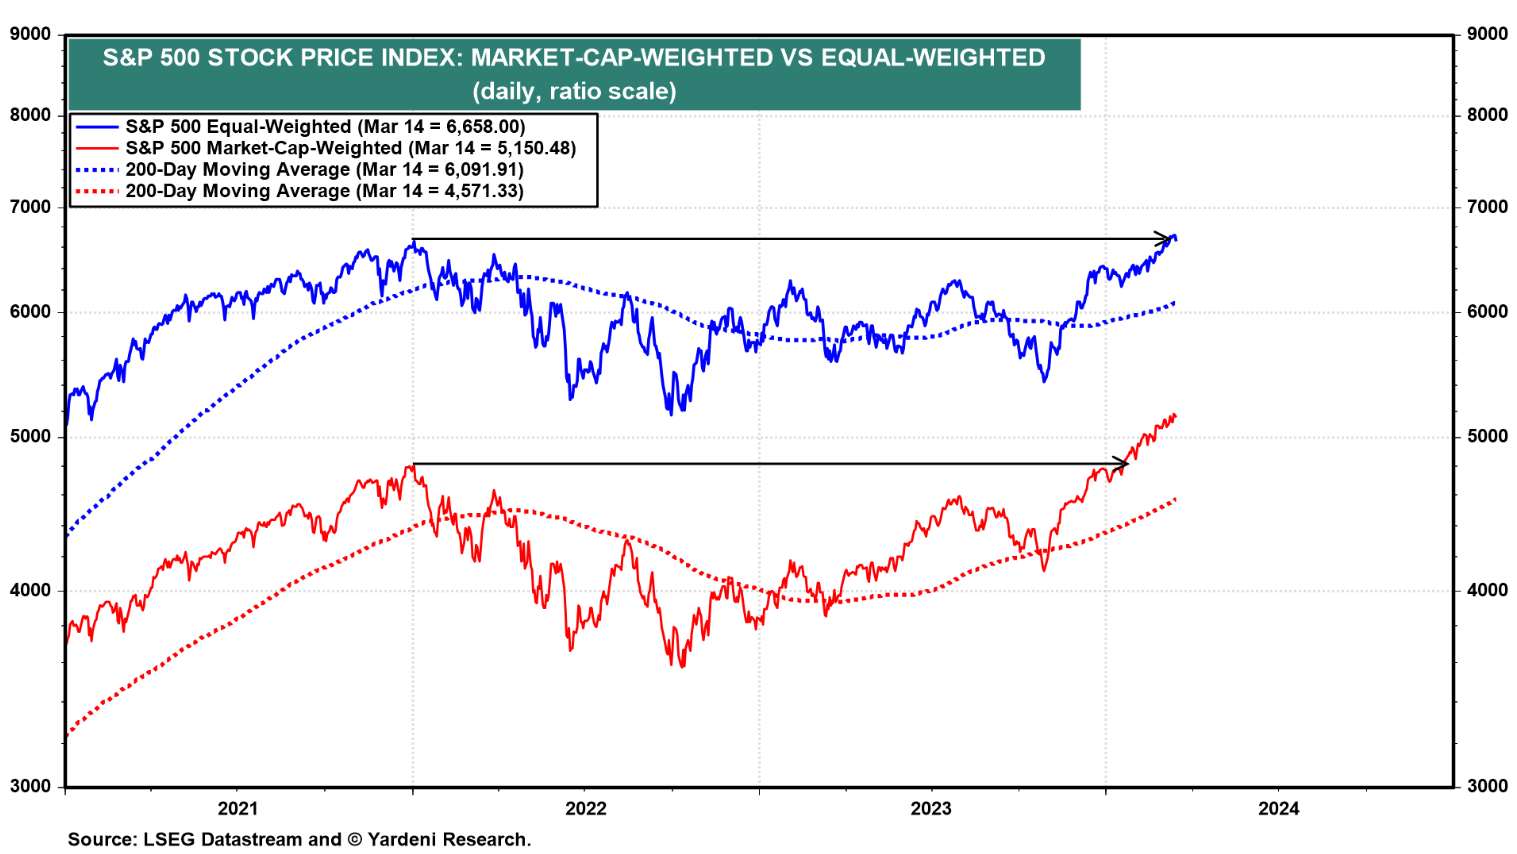
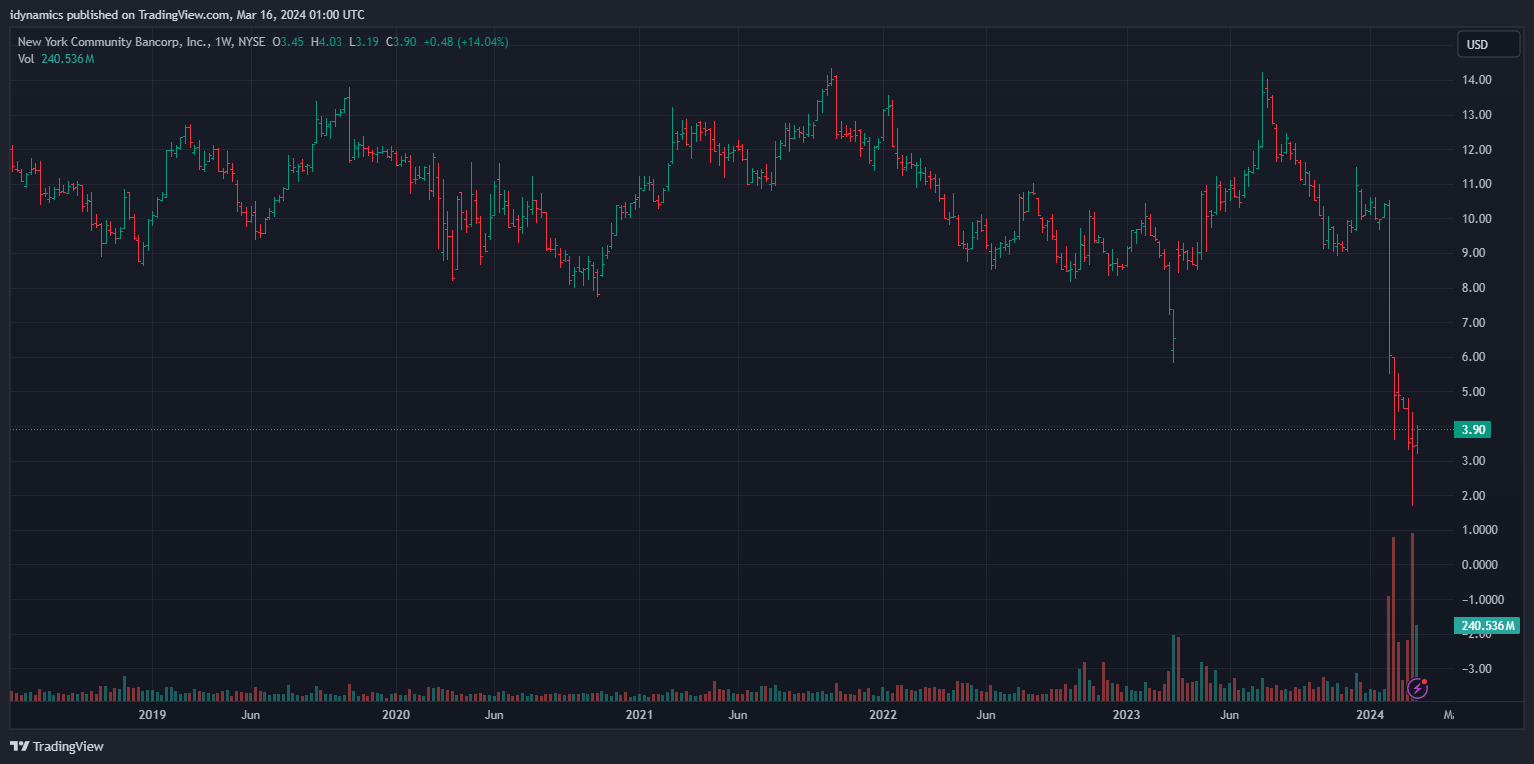
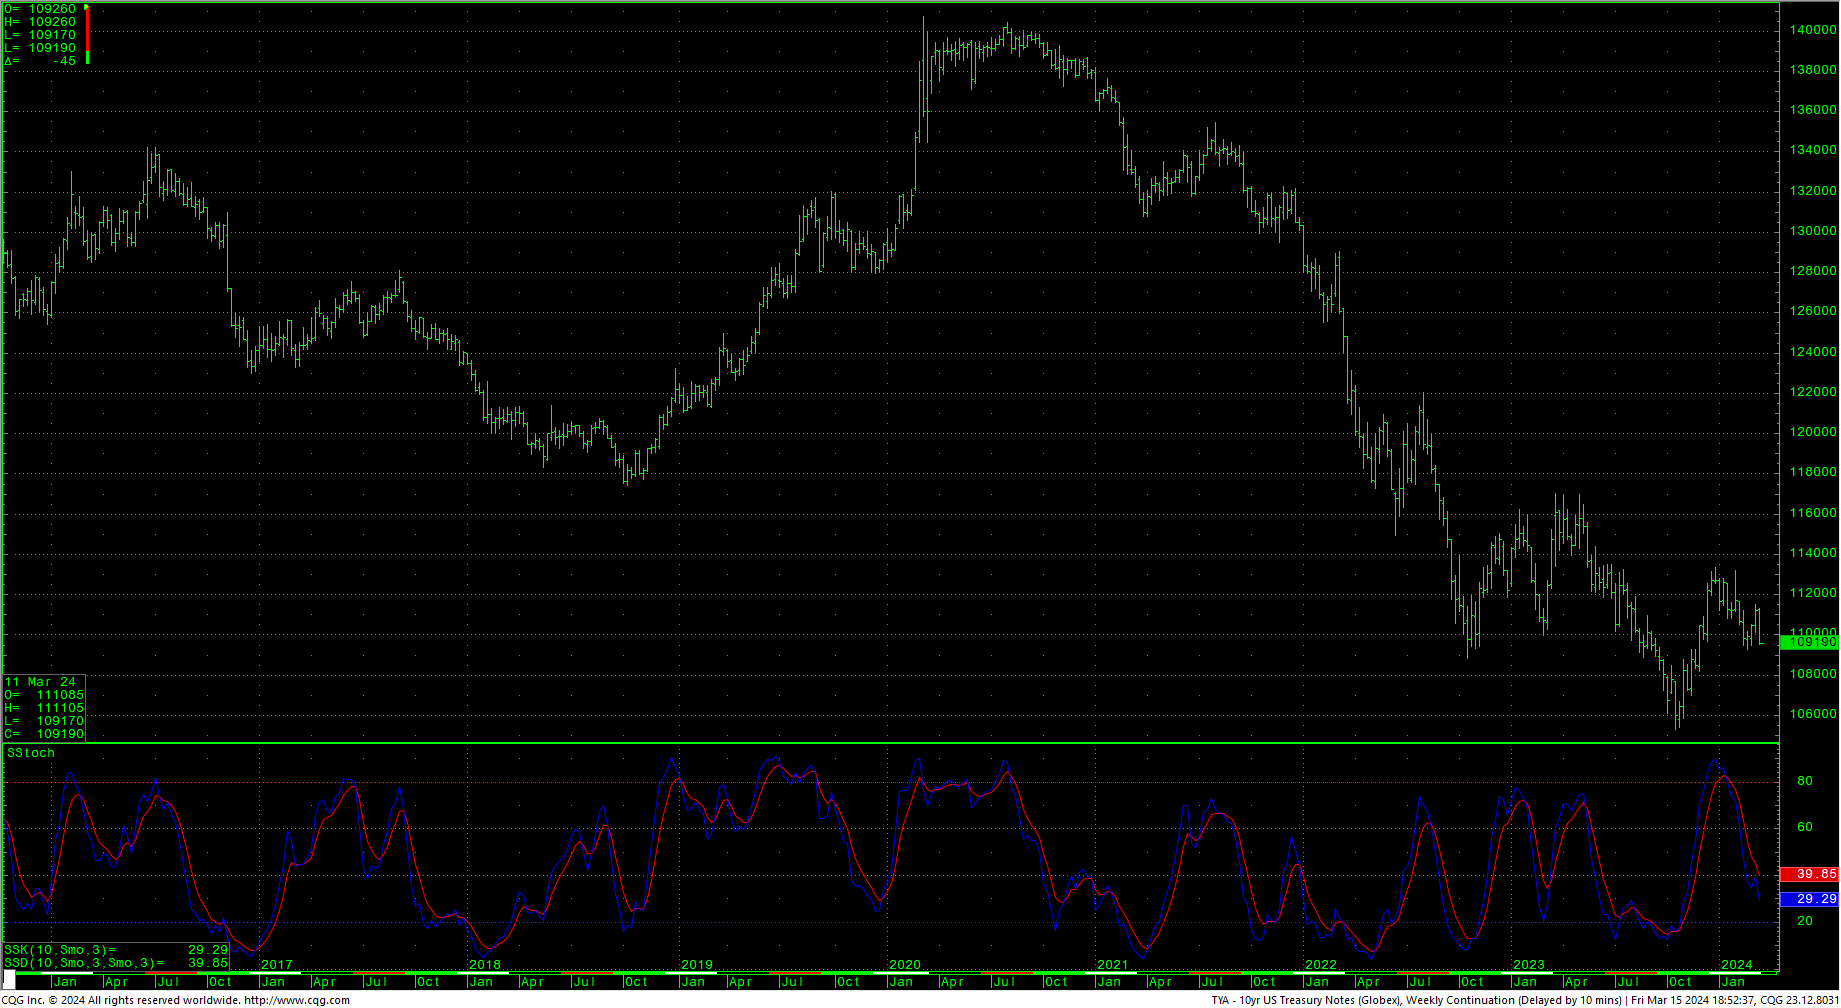
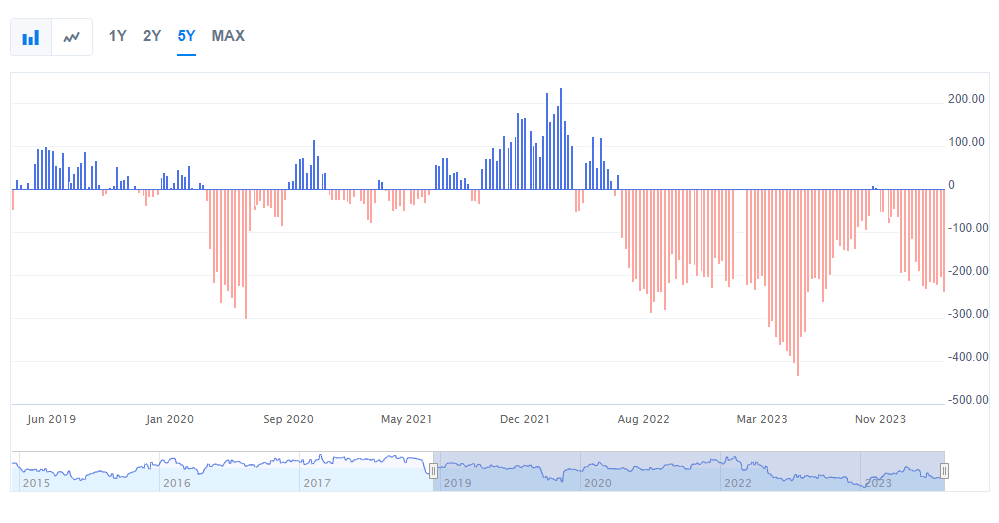 Sellers have definitely found solid ground to their footing here as rallies have stalled over the past three weeks. And it looks like the room is getting crowded. Right now, shorts only have a 2-day window to work with. The secondary markets took it on the chin as predictions of a pickup in small and mid-size businesses was met with the harsh reality of hot CPI data and a slight dip in Consumer Sentiment…putting pressure on the equal-weighted index. The reality is that the pressure is on the Fed now to continue to try to manage the so-called ‘soft landing.’ Bonds and fixed income markets came unglued last week with 2-YR notes dropping to new swing lows and the 10-YR testing the last swing lows. Sentiment remains frothy but pulled back a bit last week. The crash in NYCB is sending tremors through the markets as regional banks are vastly over-stretched on commercial real estate. As Warren Buffet stated once: “The buildings remain, but the ownership changes hands.”
 Bubble? Weight of High Momentum Stocks
 Dow Jones Momentum
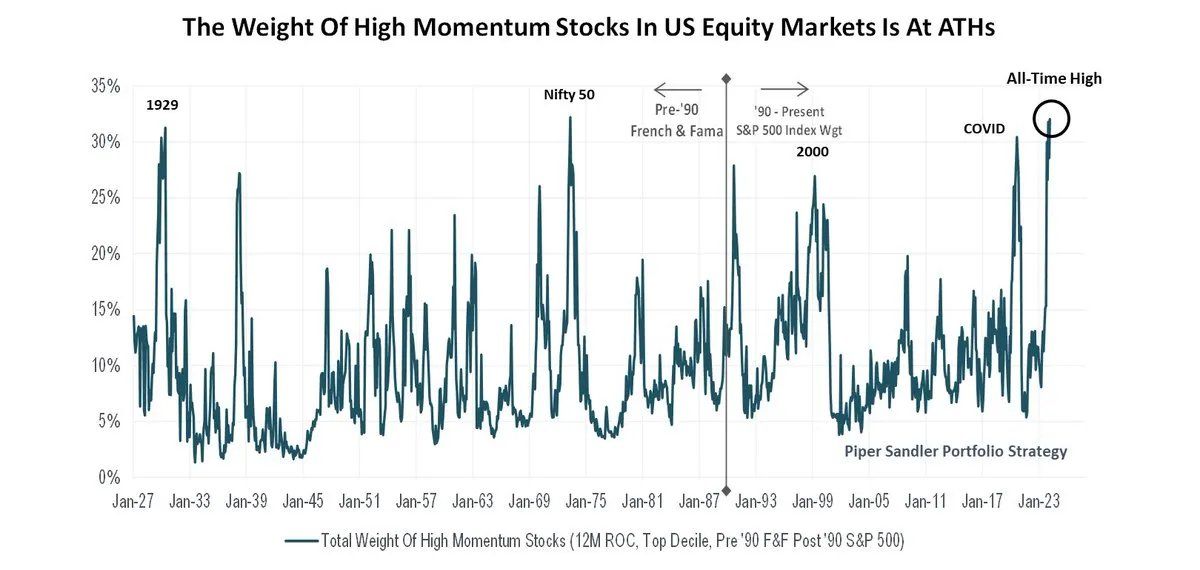
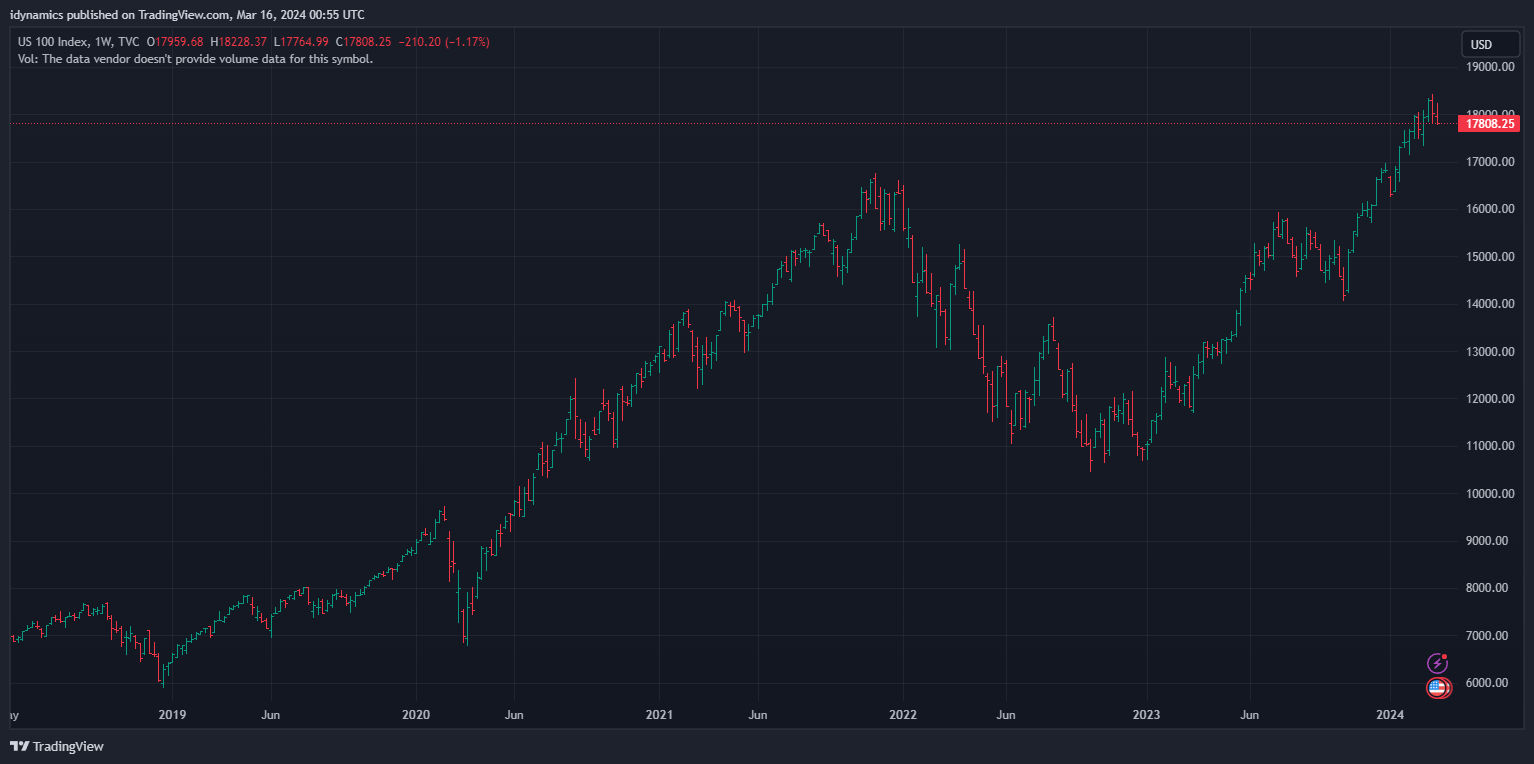
 A reminder that between now and the end of April there is some of the most critical cycle timing in more than a few years and price swings could potentially get quite manic this coming week and through the end of April. The so-called ‘high-momentum’ stocks have stalled their rallies as a number of the Magnificent Seven have gone into corrections. Last week was pretty harsh for most of the Mag7 and Tesla is trading at a one-year low.
Magnificent Seven
52-Week A/D Line
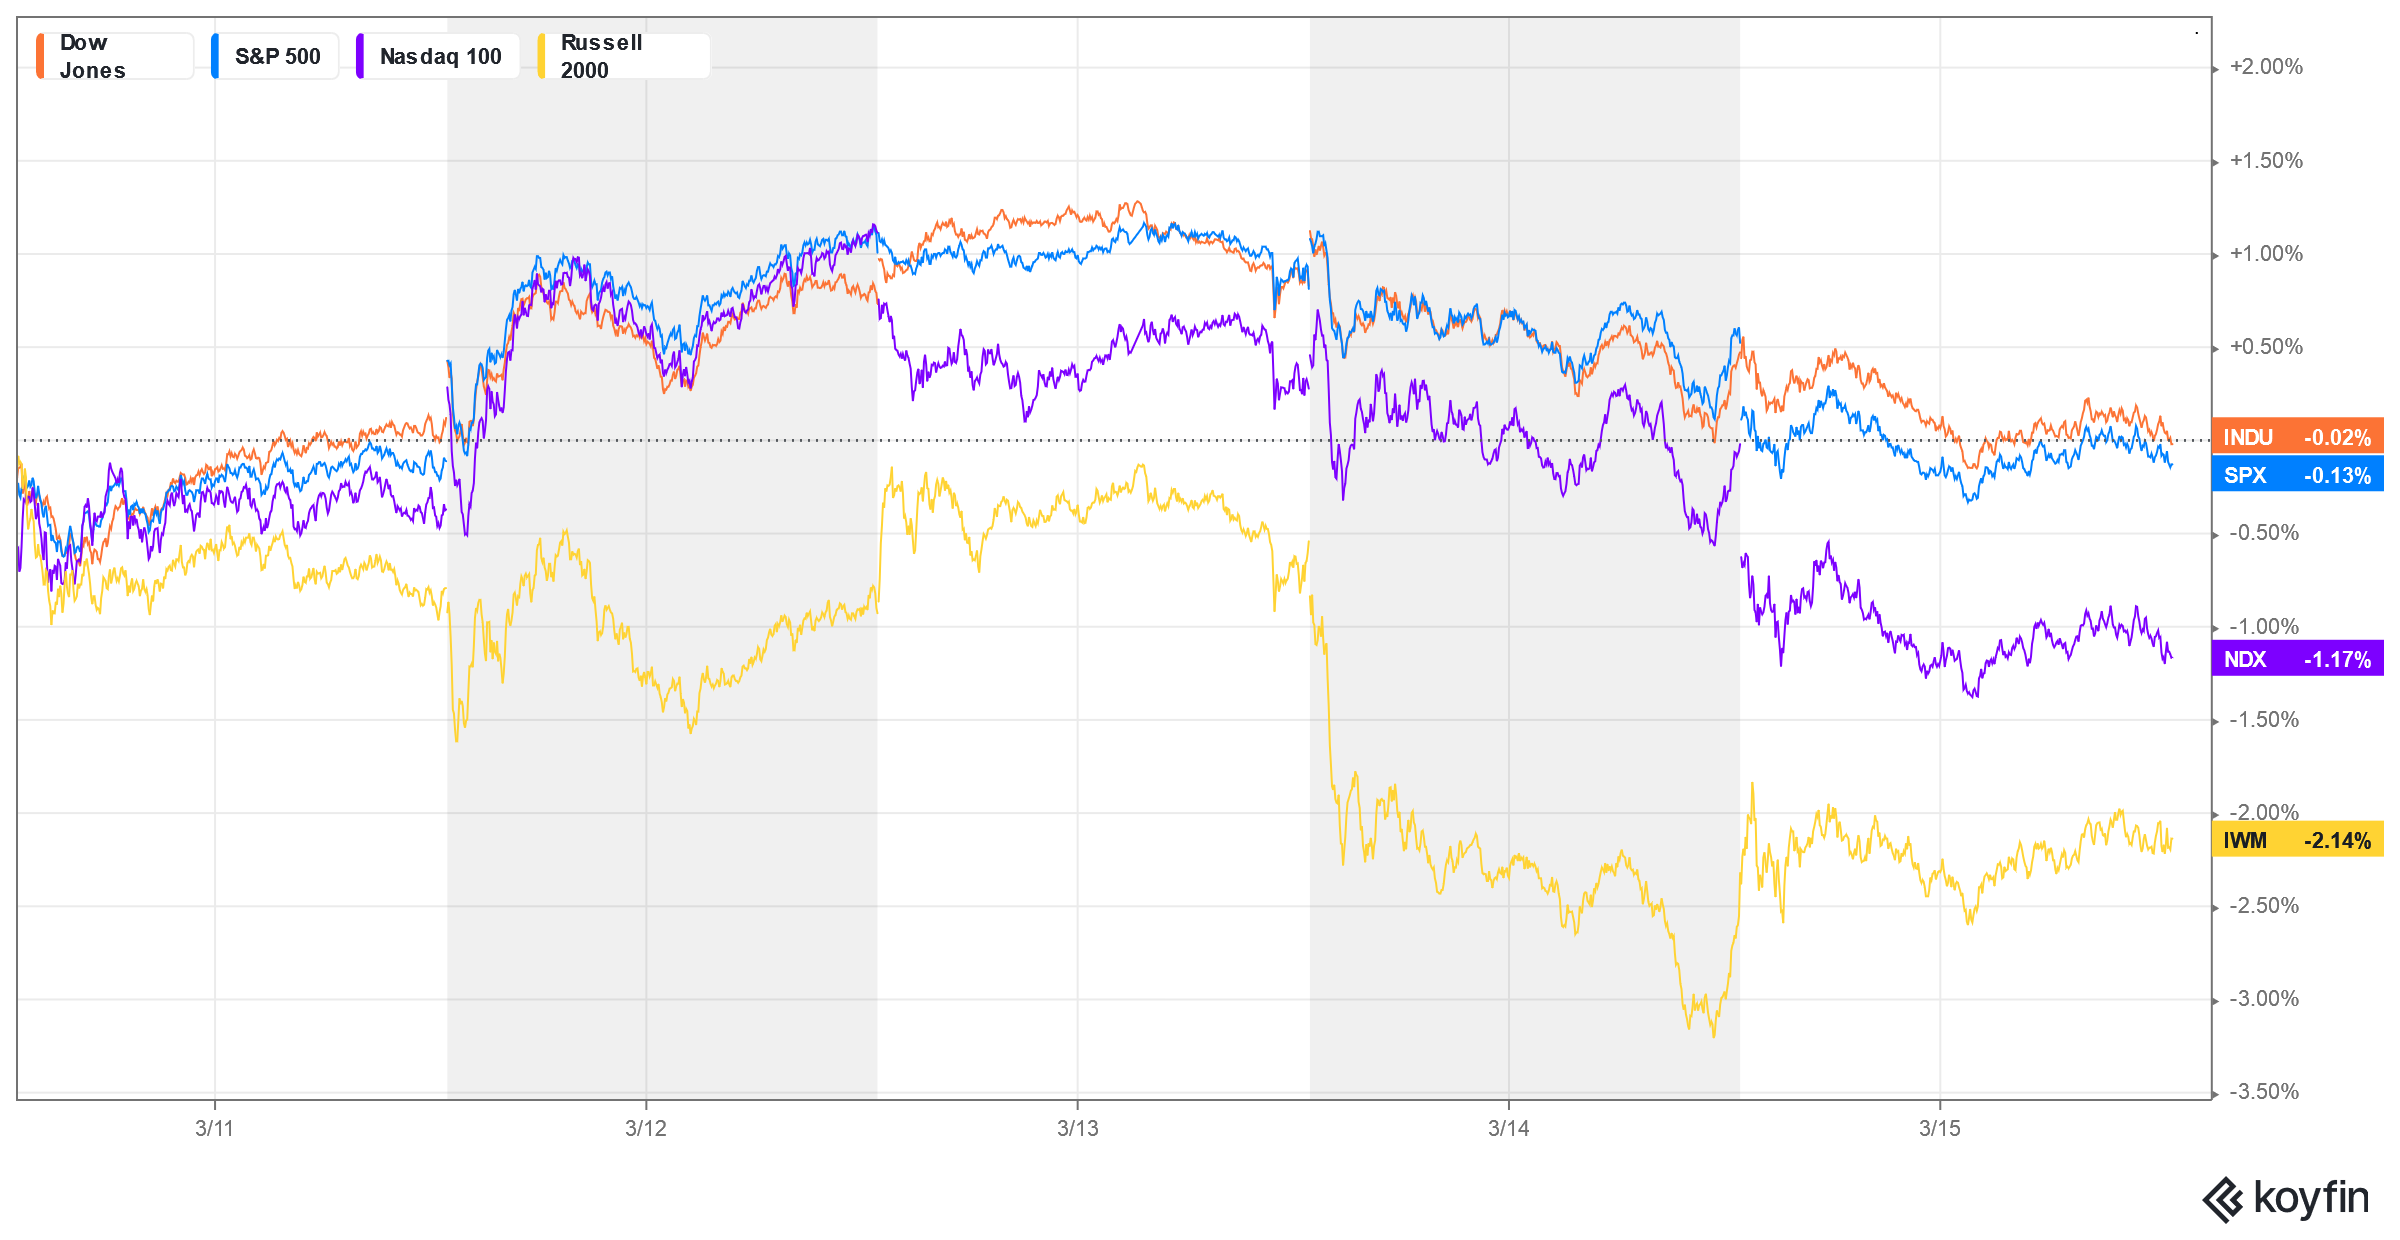
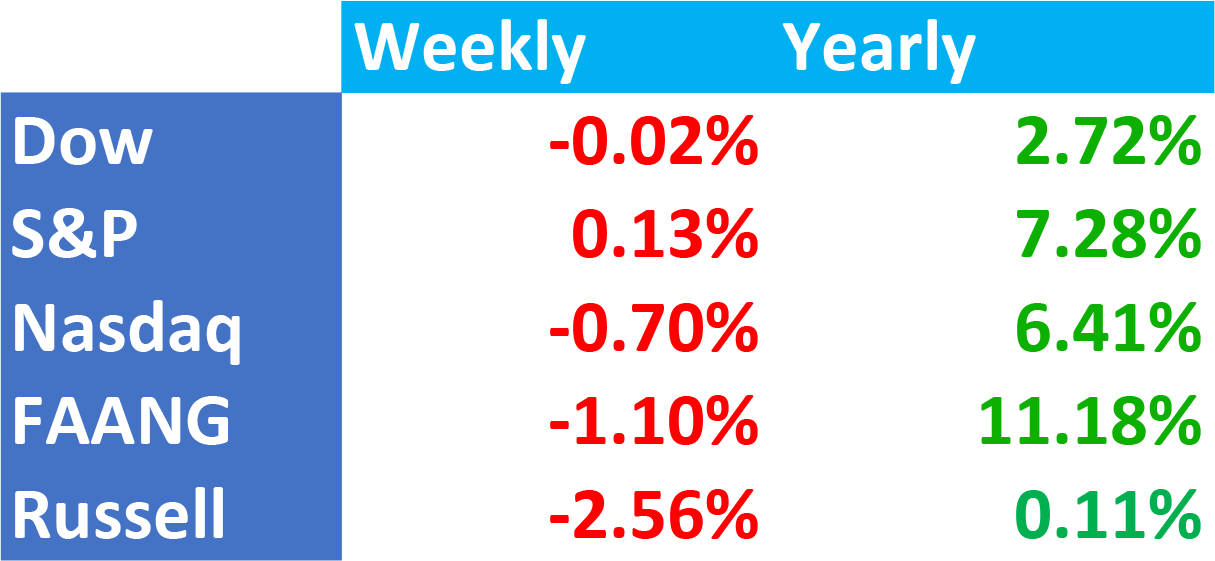
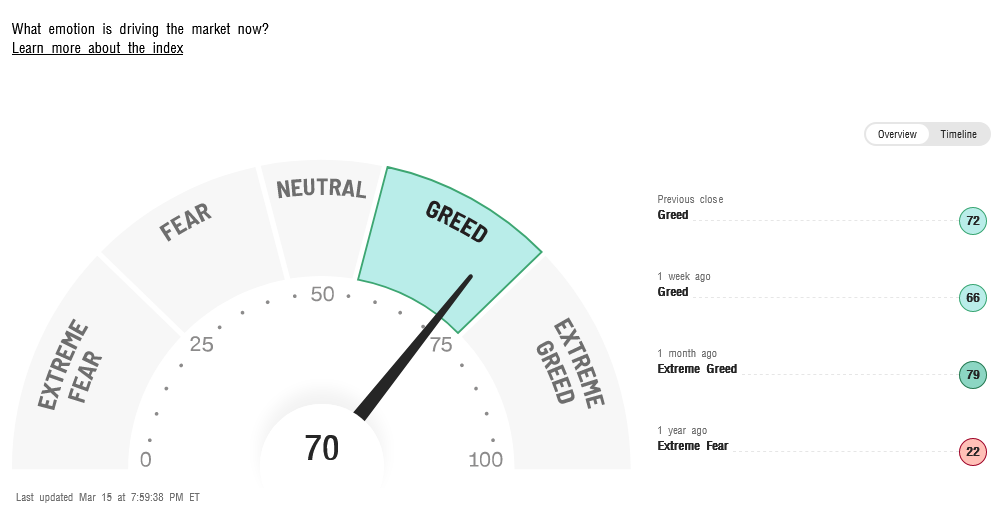
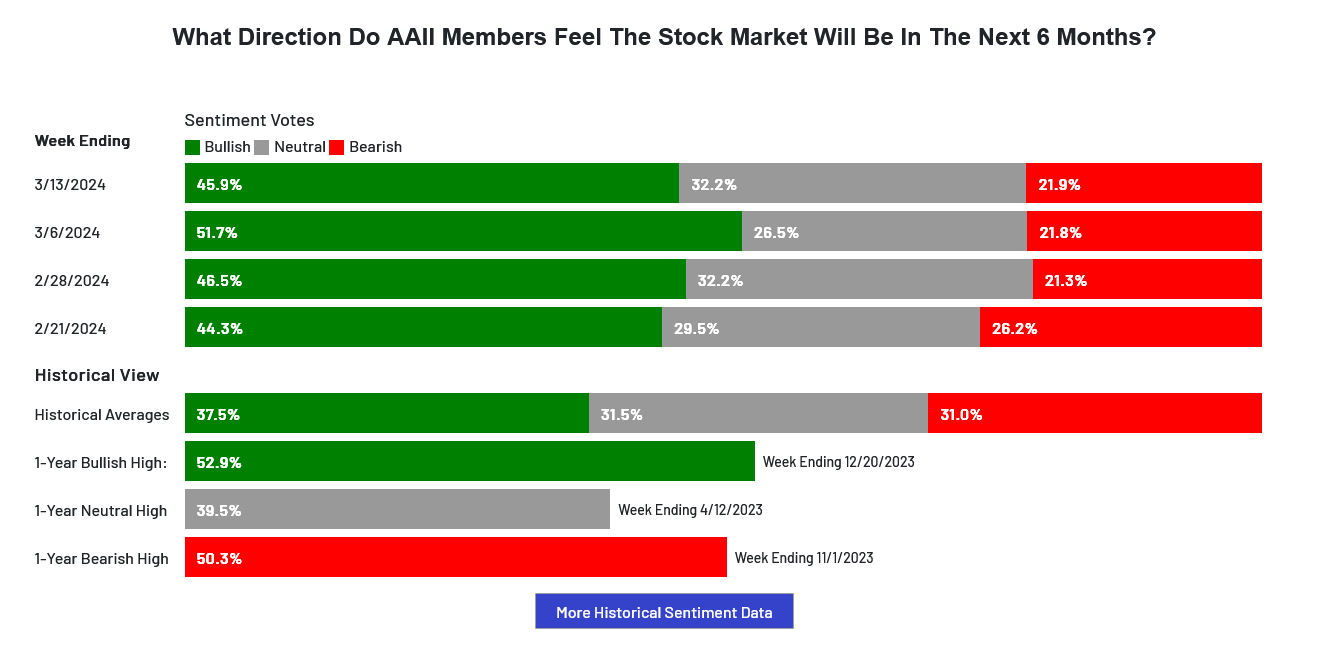
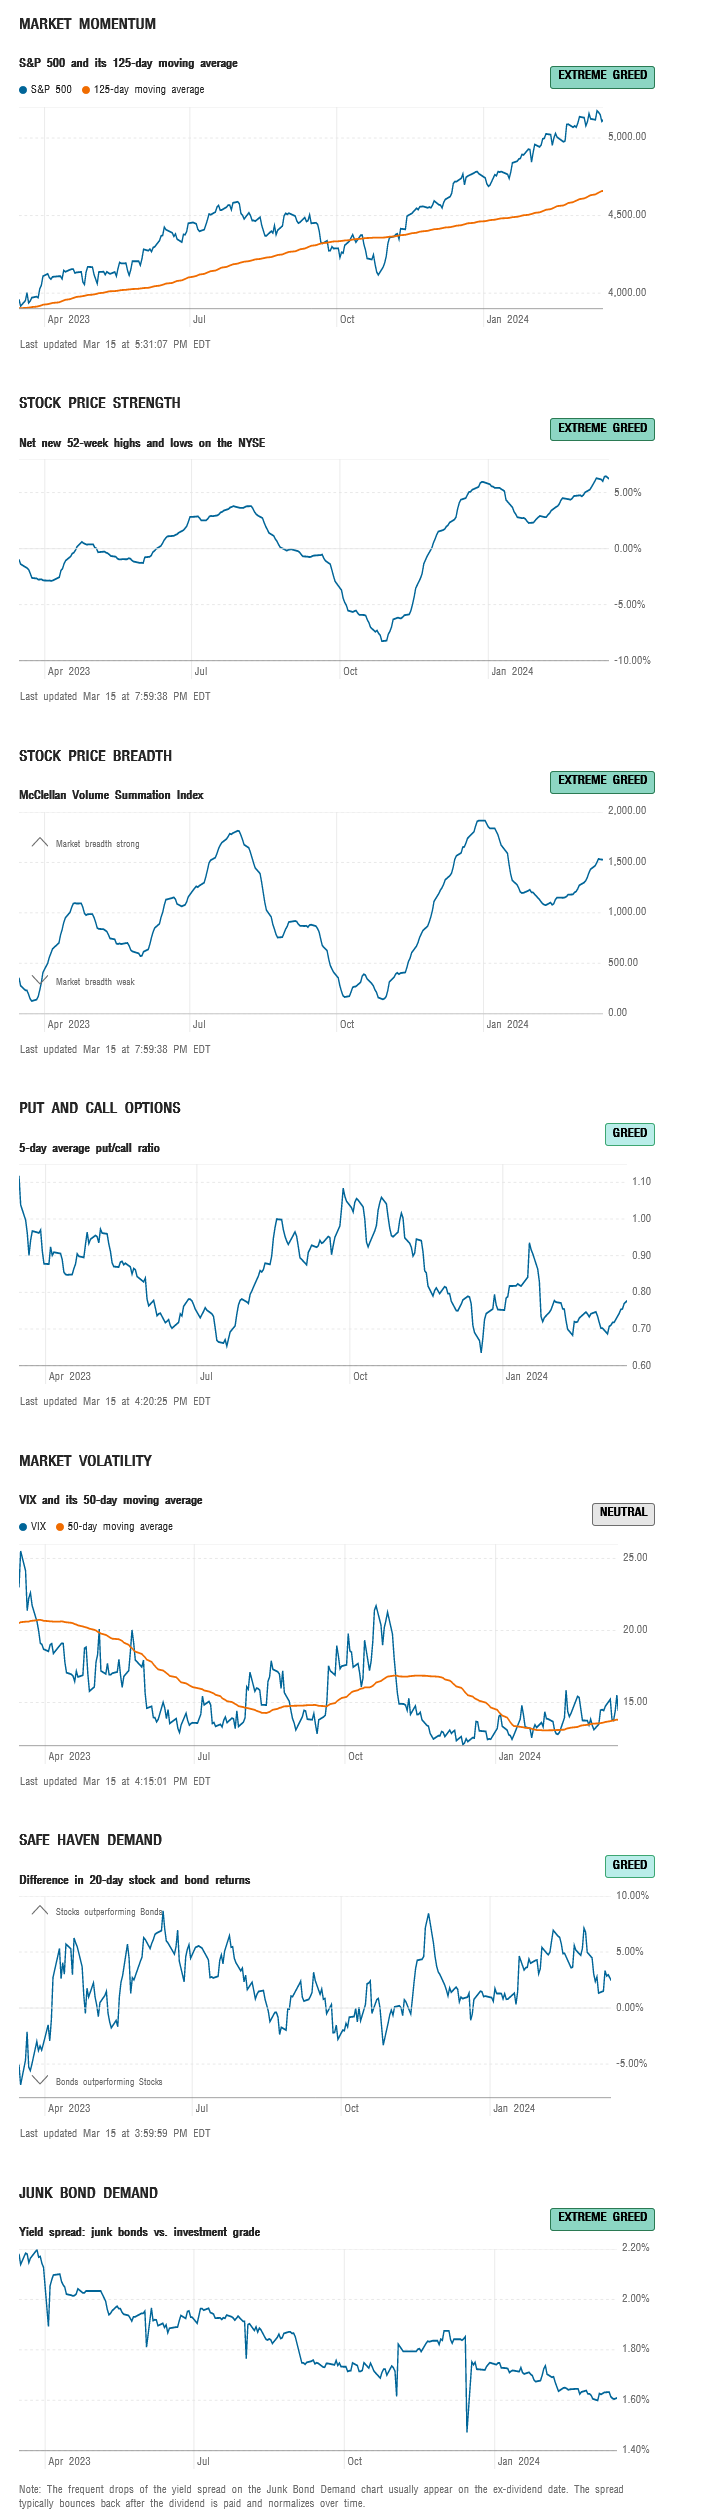
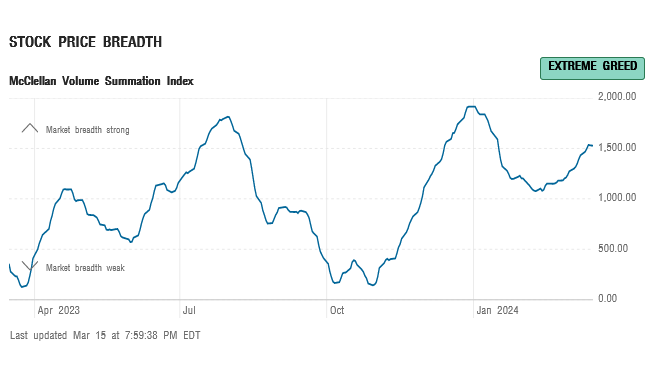
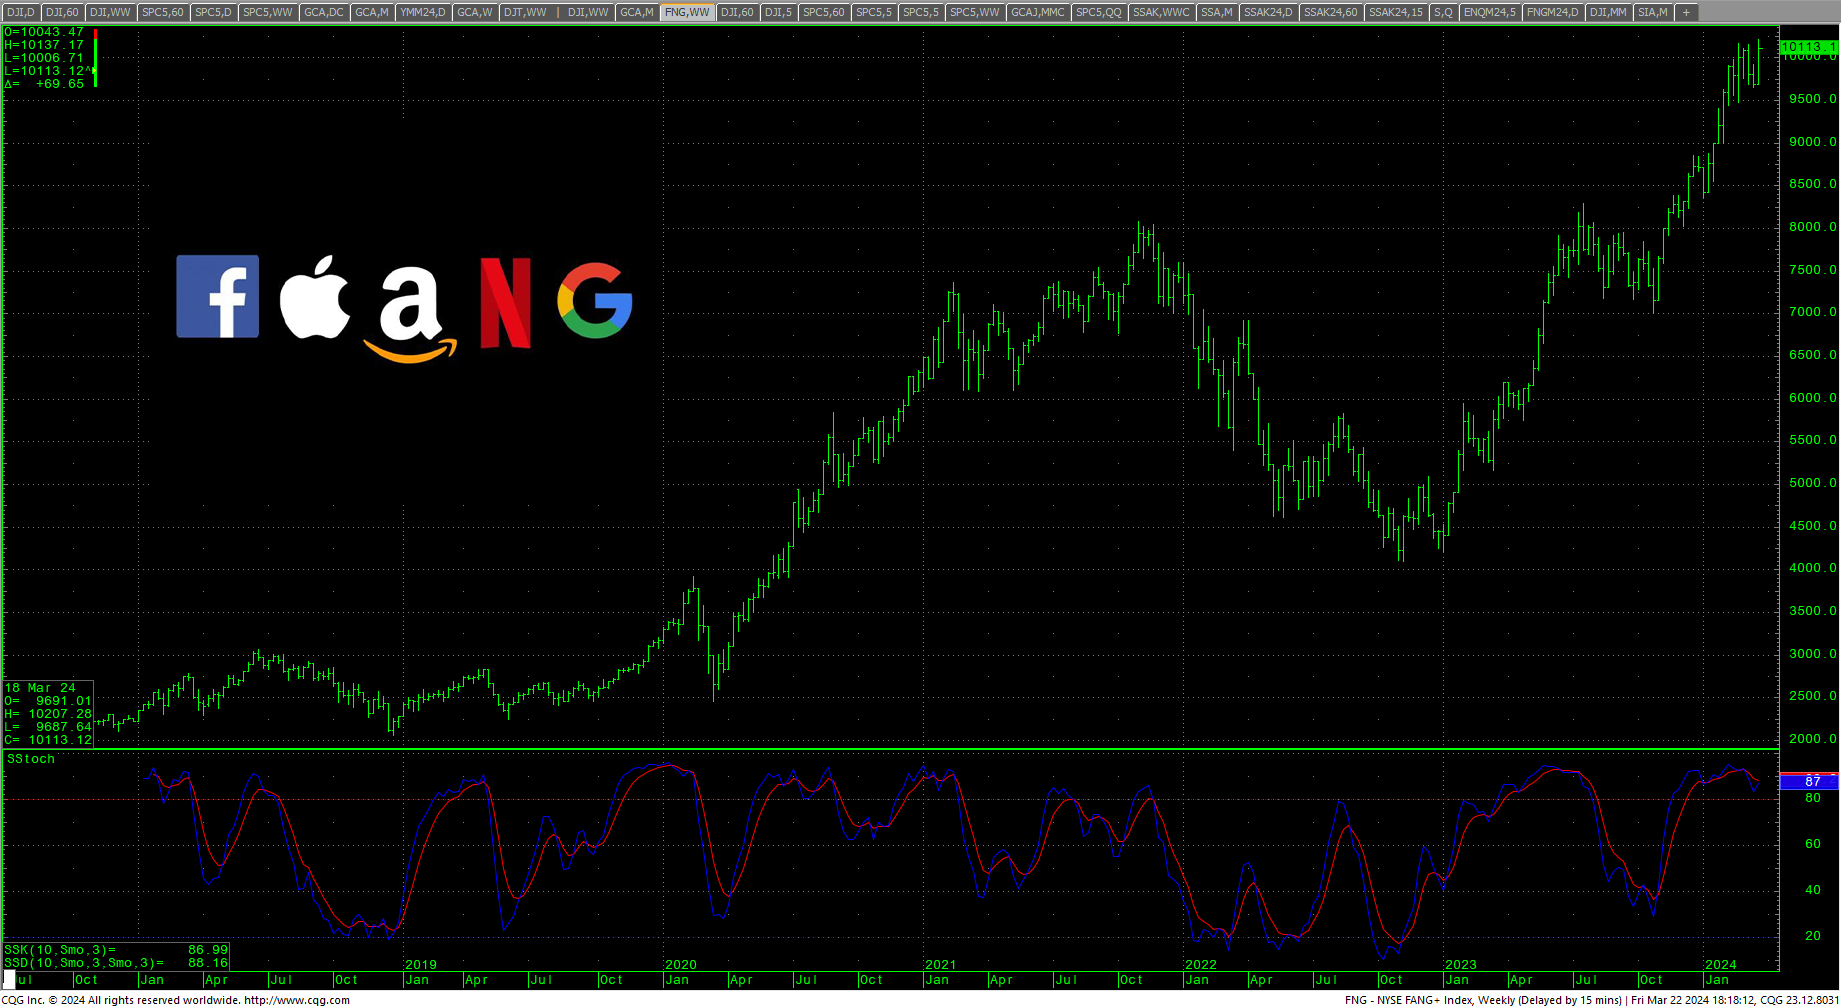
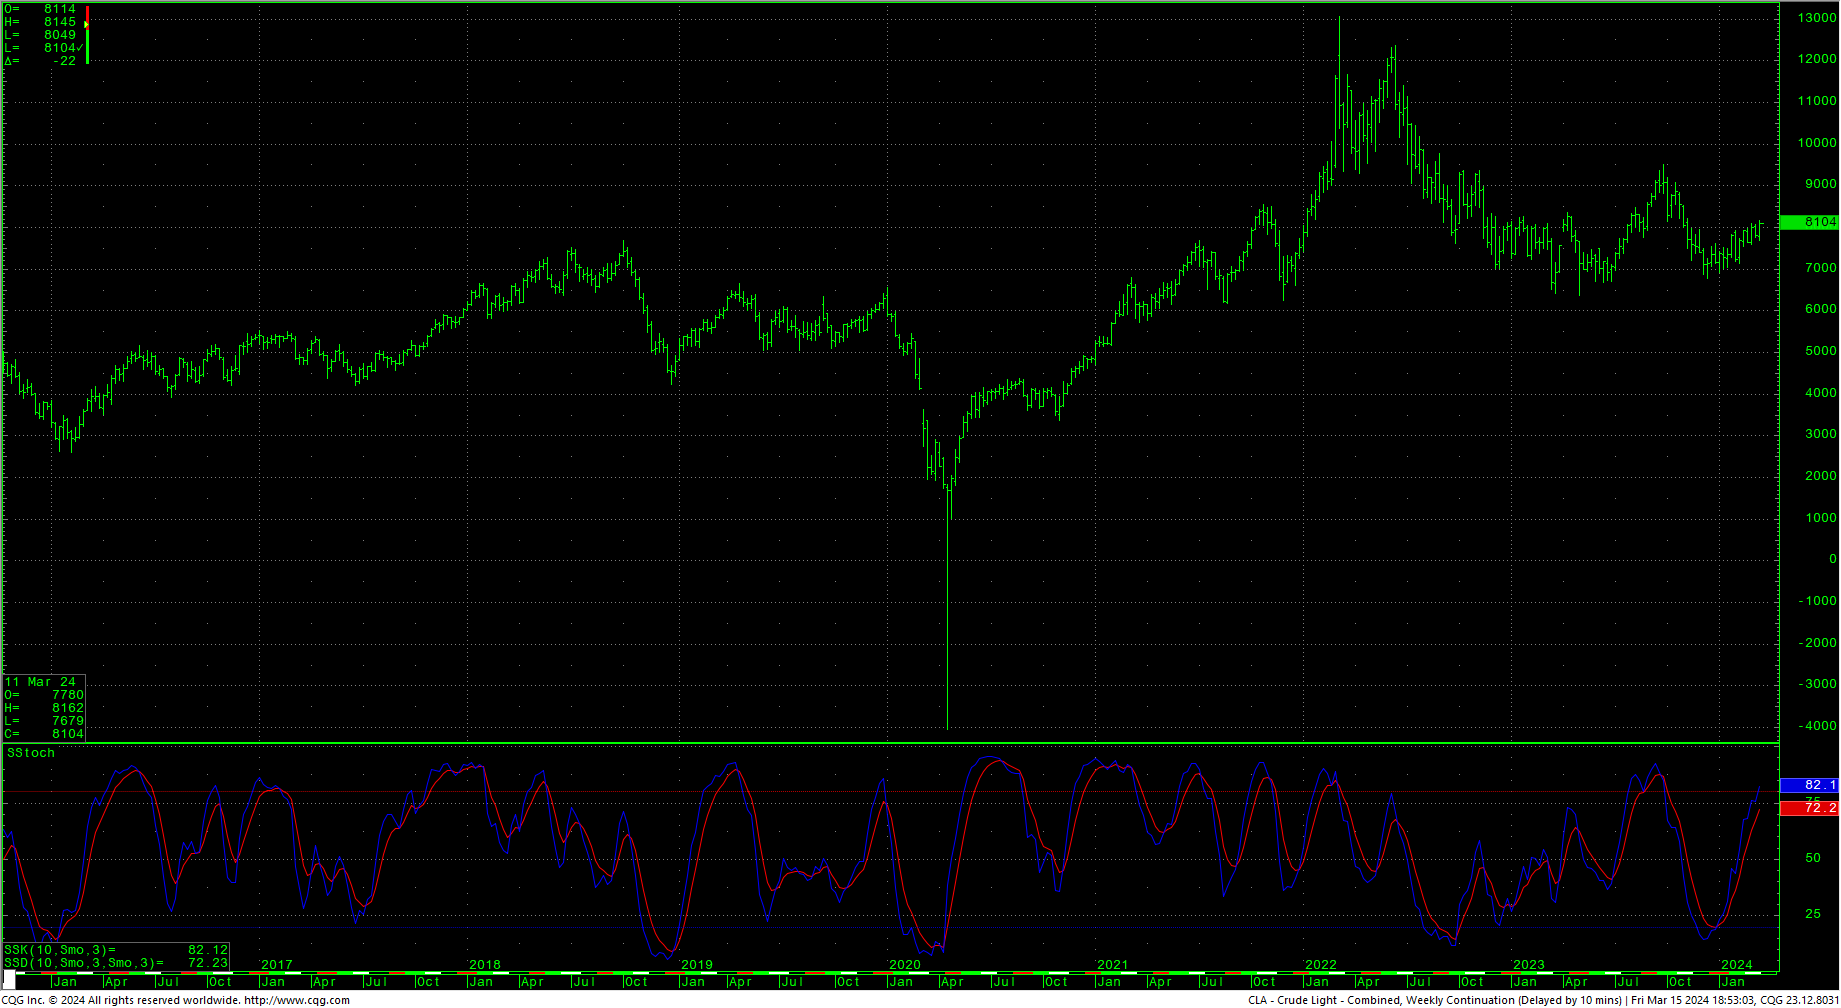
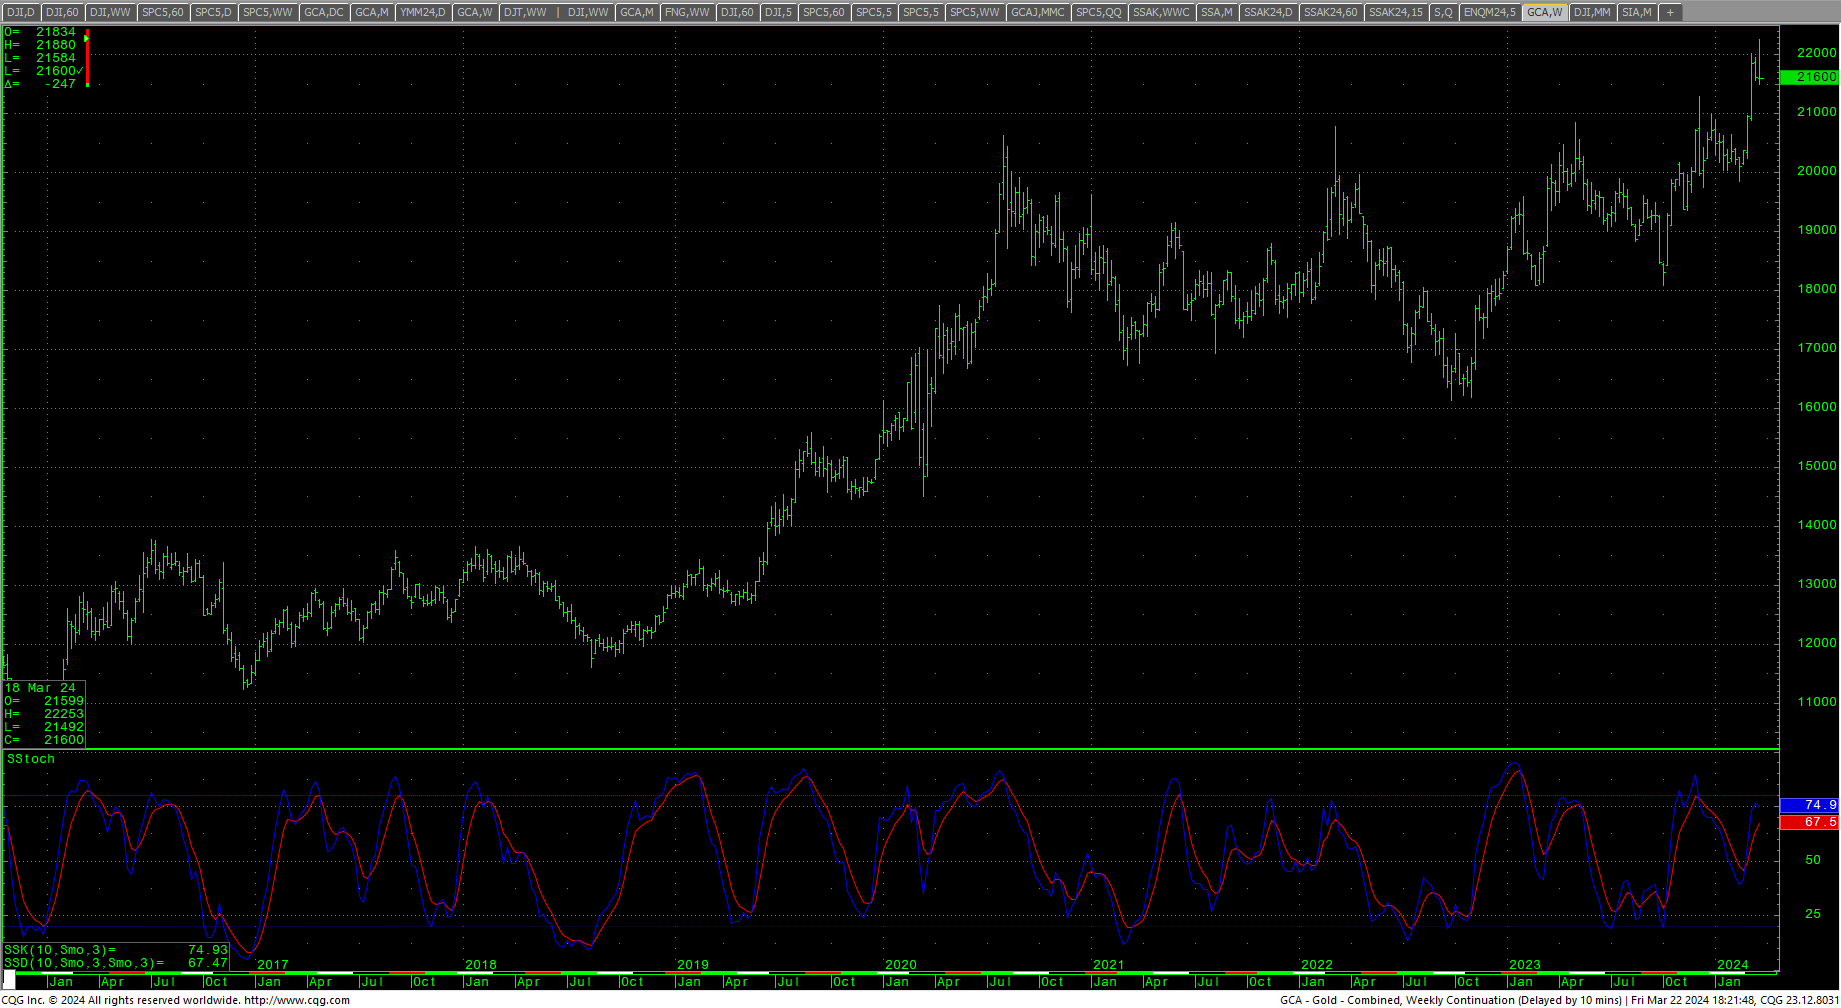
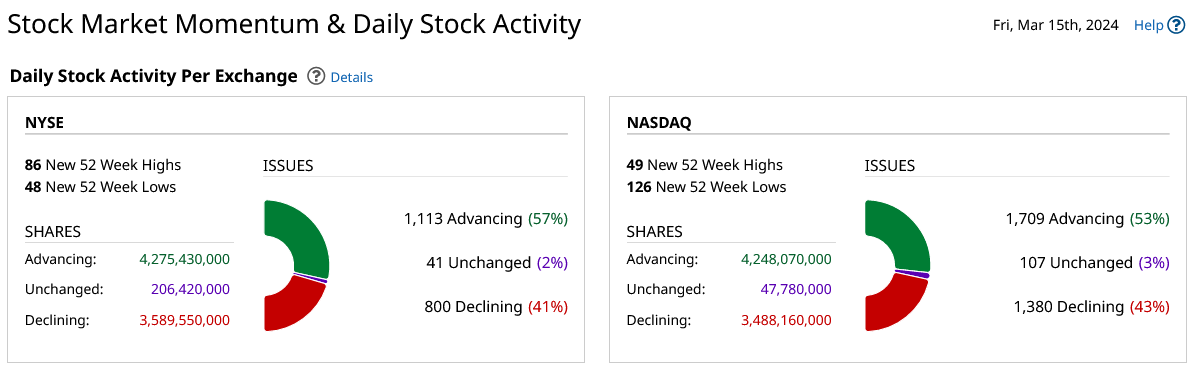 Sentiment indicators remain in greed/extreme greed readings with breadth greedy but still short of the highs set earlier this year. Last week in the AAII Sentiment Survey: Optimism Falls but Remains Above Average. The Dow A/D line moved up marginally to 5801, sitting under record highs (The Dow is now down -1.07% from its record high close on 23 February 2024.) The VIX closed lower, in the middle of the week’s. The Put/Call ratio is at 0.78, reflecting greed. The 52-week, A/D moved down to +6.22% and indicates extreme greed. The Dow closed the week down -0.02%. The S&P closed lower for the second week in a row, down -0.13%. The Nasdaq ended the week down -0.70%, the FANG closed down -1.10% and the Russell was down sharply, ending down -2.56%. The 10-year notes plunged and closed on the bottom of the week’s range setting new closing lows for the move with the yield at 4.308%. For support and resistance on the JUN24 contract see the last Special Report. Commodities rallied sharply with the CRB up +3.018%… crude oil rallied to the highest levels since October 2023, closing in the top of the week’s range. Gold was lower all week, closing on the bottom of an inside week’s range. The CoT remains in a clueless trend as speculators continue to sell.
Timing Points
This Tuesday marks strong daily timing. The period between this Tuesday and April 30th represents some of the strongest long-term timing in more than a few years.
- 03/19 *** X Key
- 03/25 **
- 04/04 **
- 04/10 **
- 04/15 **
- 04/19 *** X
- 04/29-30 *** X Key week for financials
CNN Fear & Greed Index
 AAII Investor Sentiment Survey
 Dow Jones Industrial Average Hourly HLC
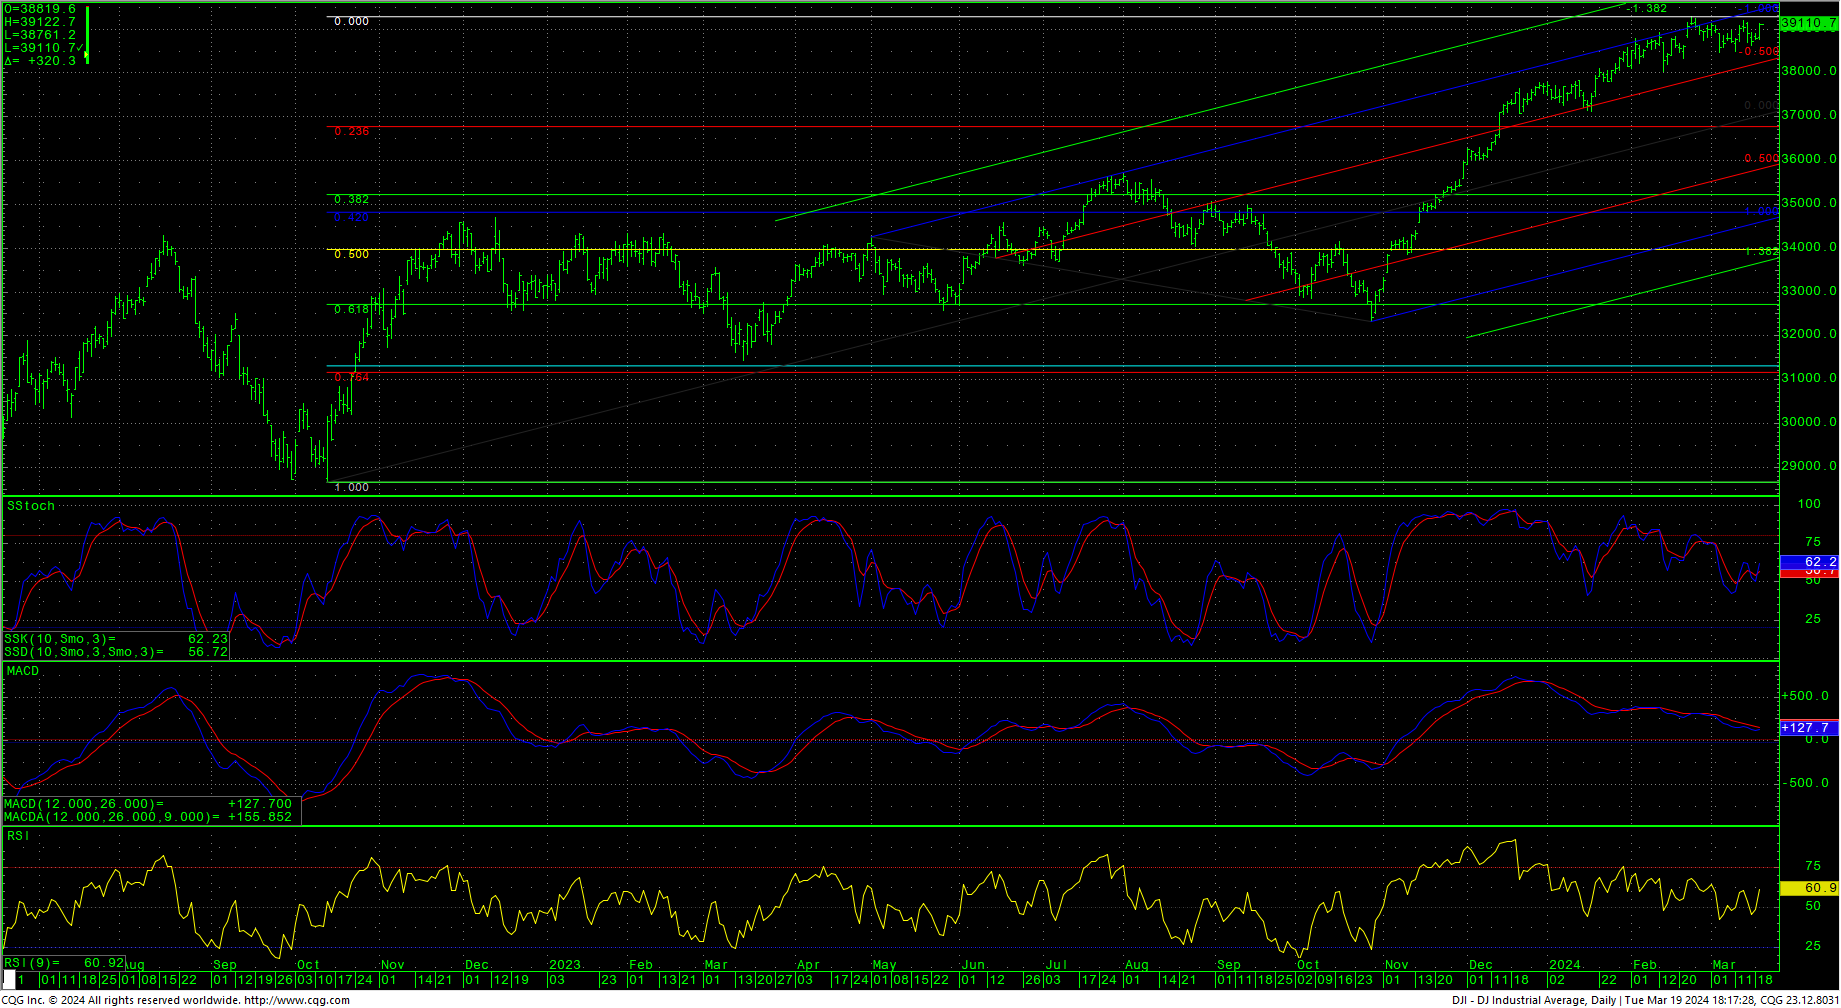
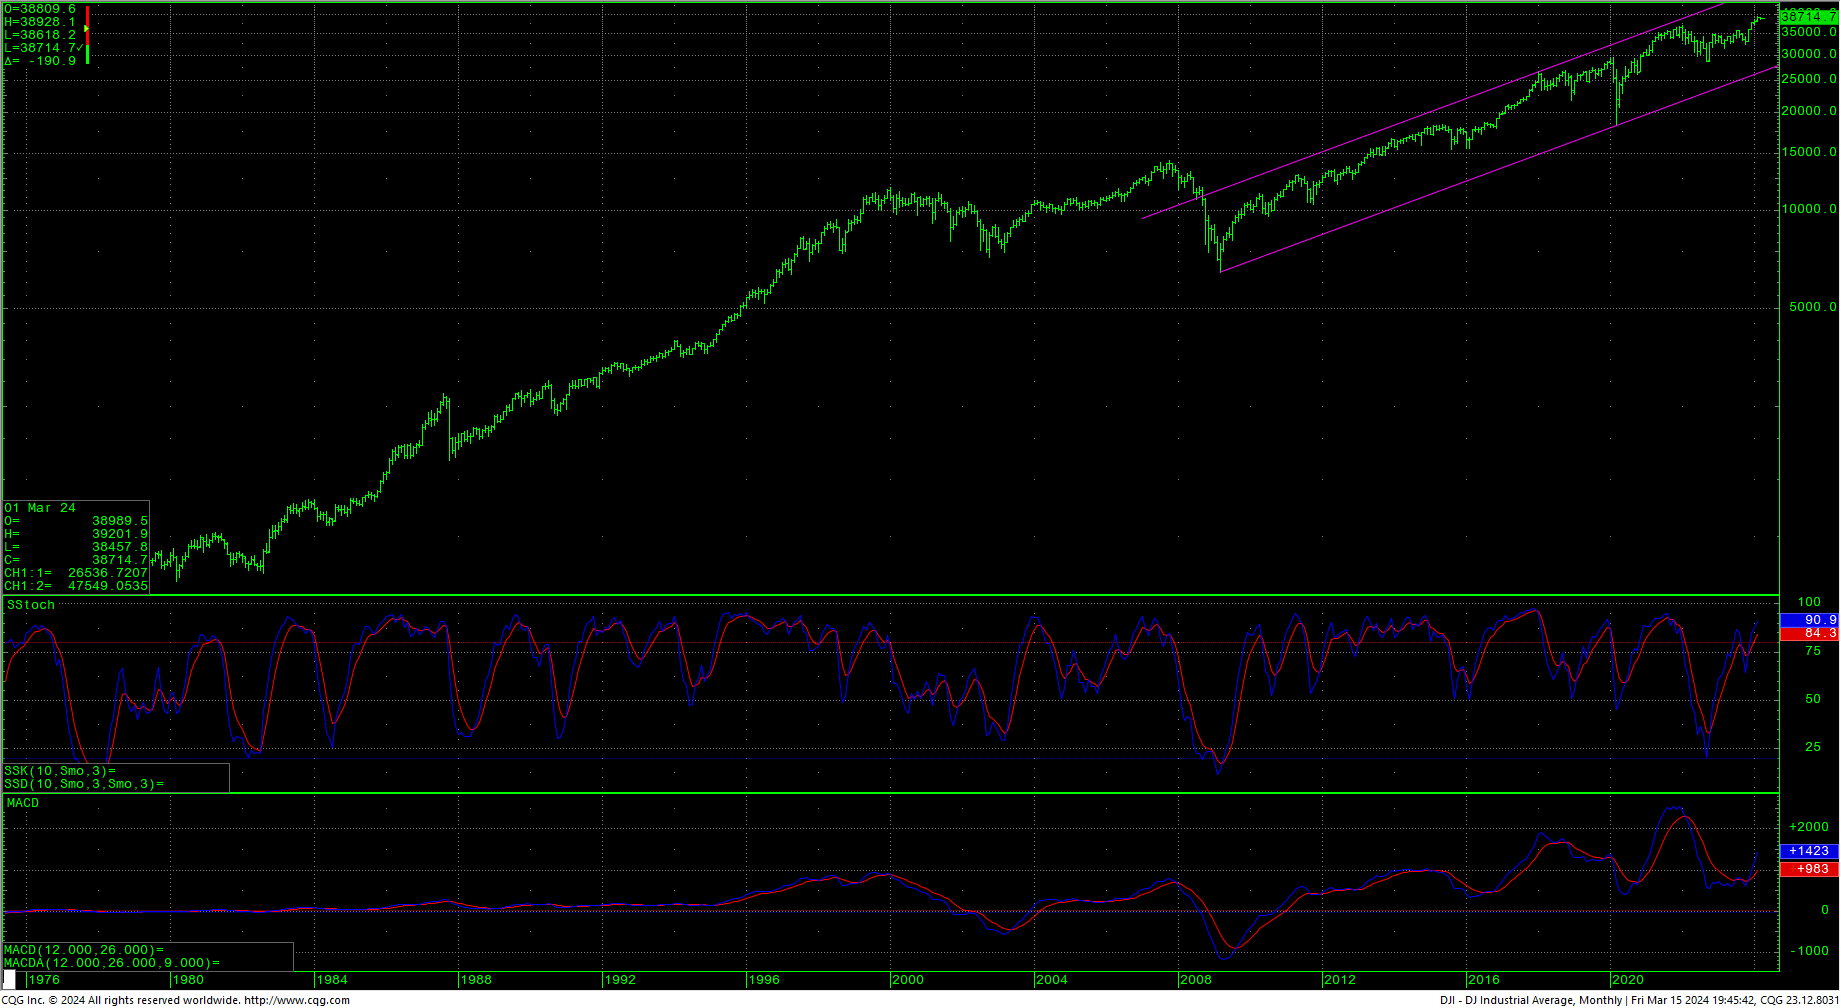
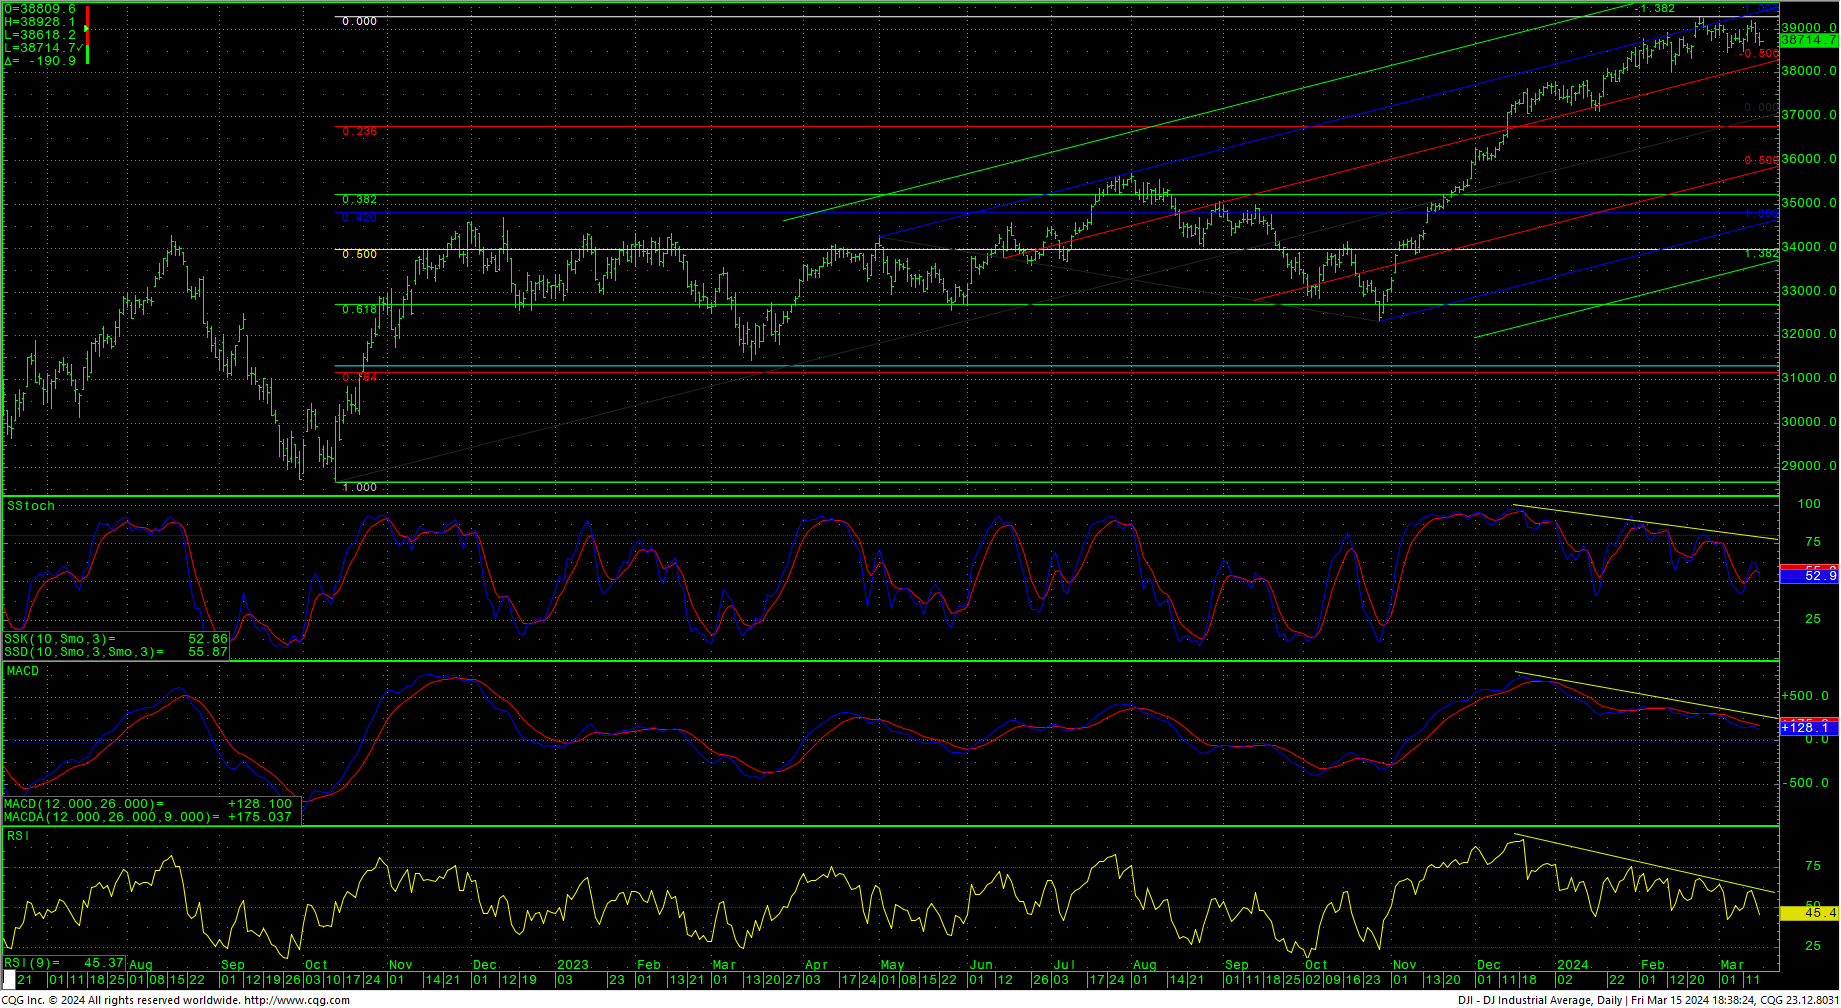
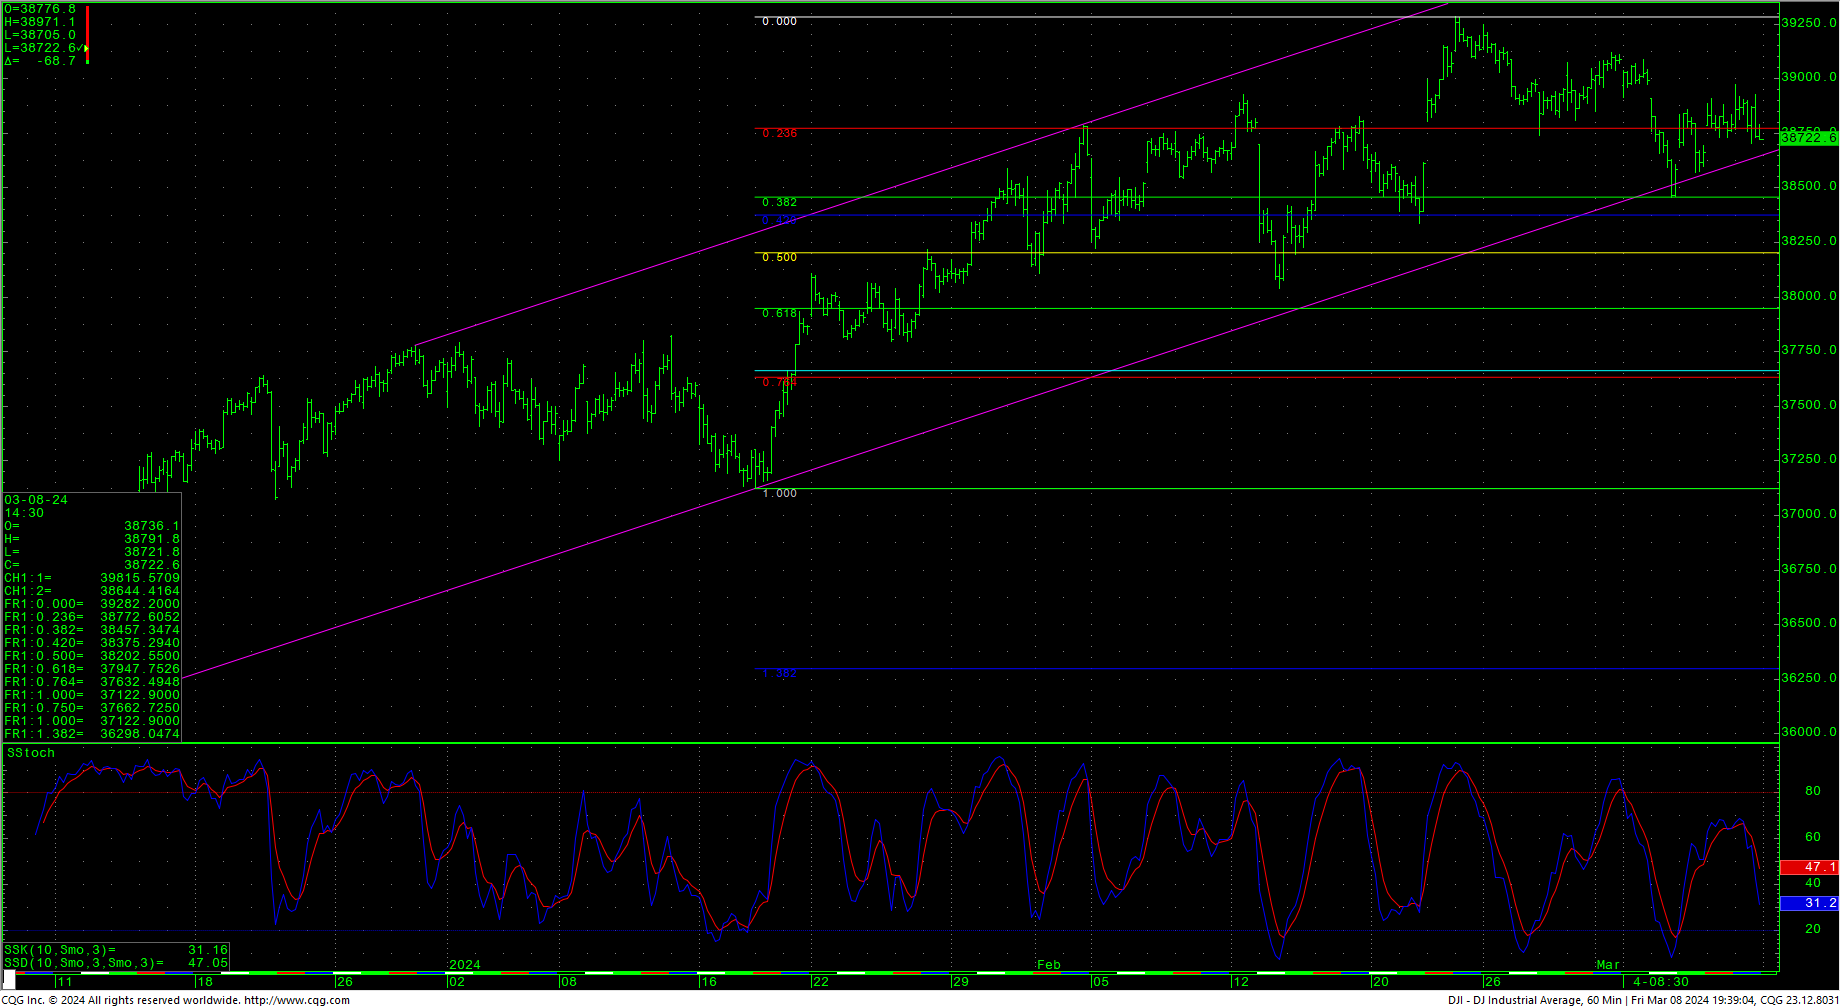 The Dow closed lower Friday in the lower end of the day’s range. The hourly is now deeply oversold.. The daily continues to show bearish divergences and the weekly is overbought while the monthly is currently trading an inside month with the stochastics and the MACD validating the rally.
Dow Jones Industrial Average Monthly HLC
Dow Jones Industrial Average Daily HLC
 Support is pivotal at 38658, 38618 and 38547/38545. A breakdown with closes under 38545 can test 38457 with counts to 38202 and 38039 with potential to critical short-term support of 37947/37940. Closes under 37940 can carry to 37122 with counts toward critical short-term support of 36775. Closes below 36775 open counts to 35224.
Resistance is 38772, 38870 and 38967/38975. A drive over 38975 should test 39076/39087. Rallies over 39087 should test 39201 with potential to the intraday highs at 39282/39283. Closes over 39283 can test 39651 and will renew momentum toward weekly objectives at 40245.4. 40000 is a critical psychological area. Closes over 40245.4 will offer longer-term potential to monthly targets in the 45244 area. Above 45244 gives monthly counts to 47400.
Resistance
|
Support
|
S&P 500 Cash Index
S&P 500 Index Hourly HLC
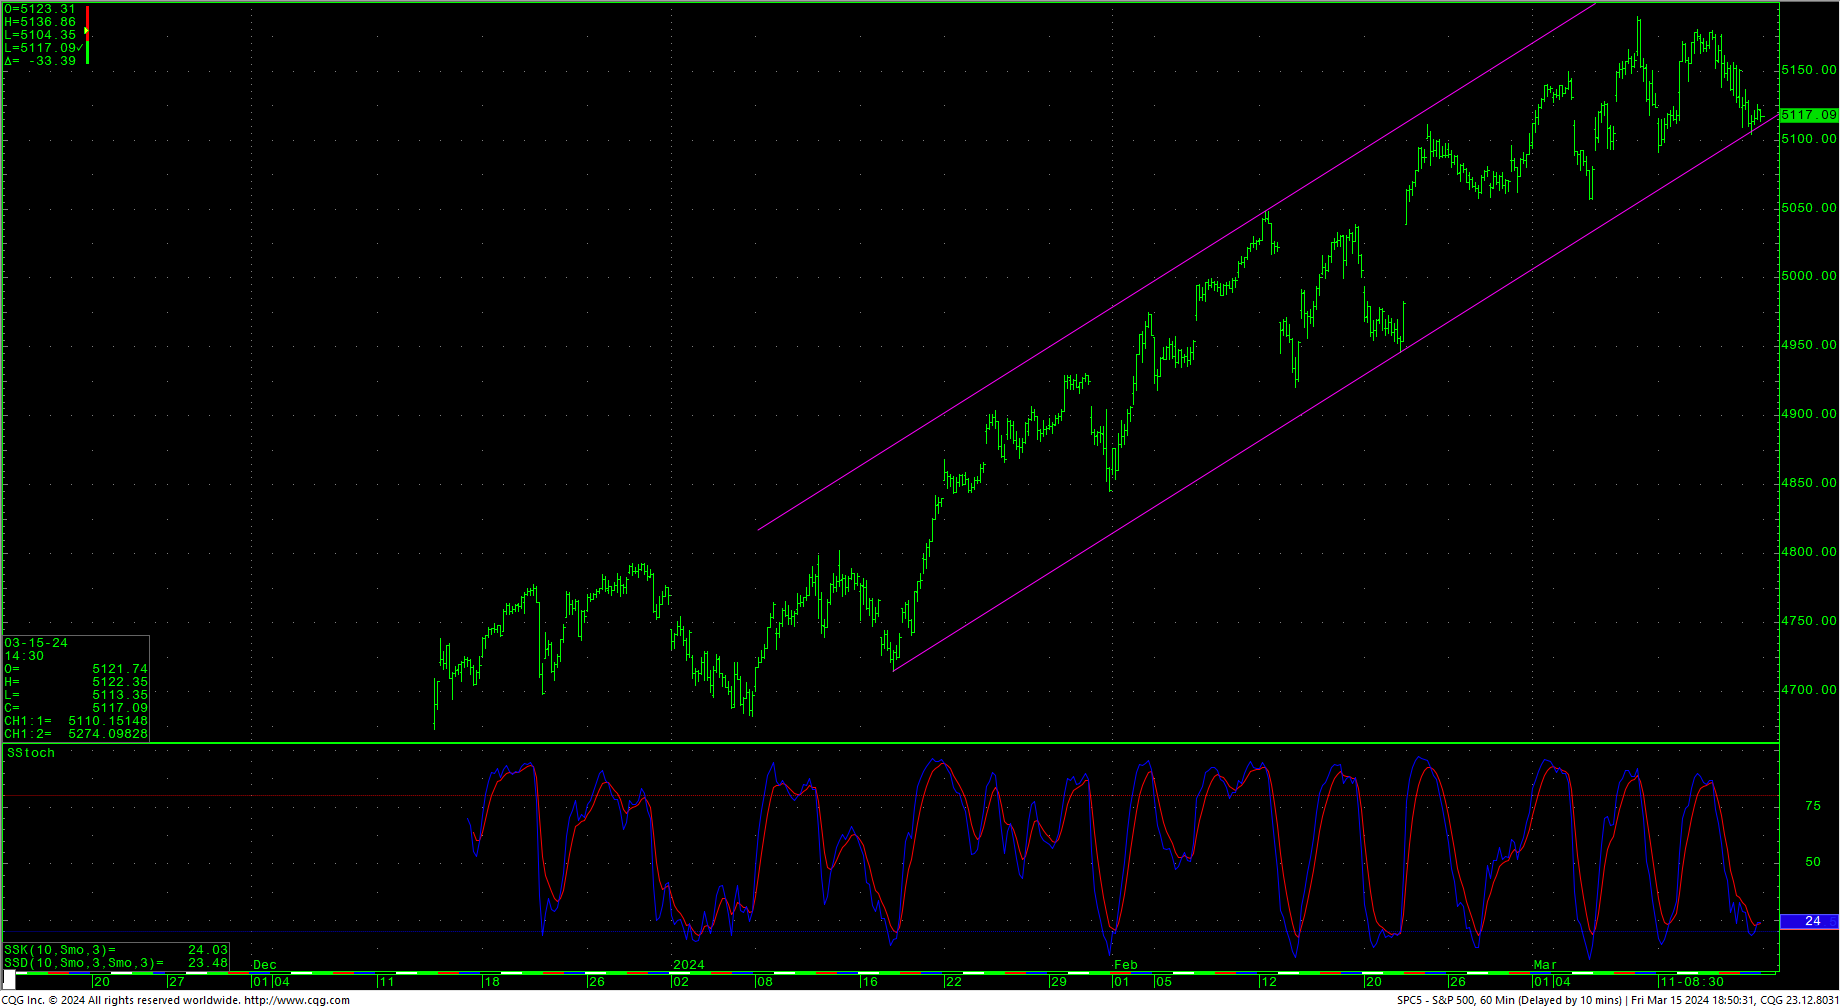 The S&P ended an inside week with a slightly lower close in the bottom of the week’s range. The hourly ended the day oversold. The daily is overbought with some bearish divergences. The weekly is overbought while the monthly looks bullish. The 5144-target area remains as pivotal near-term for the cash.
SPY Weekly
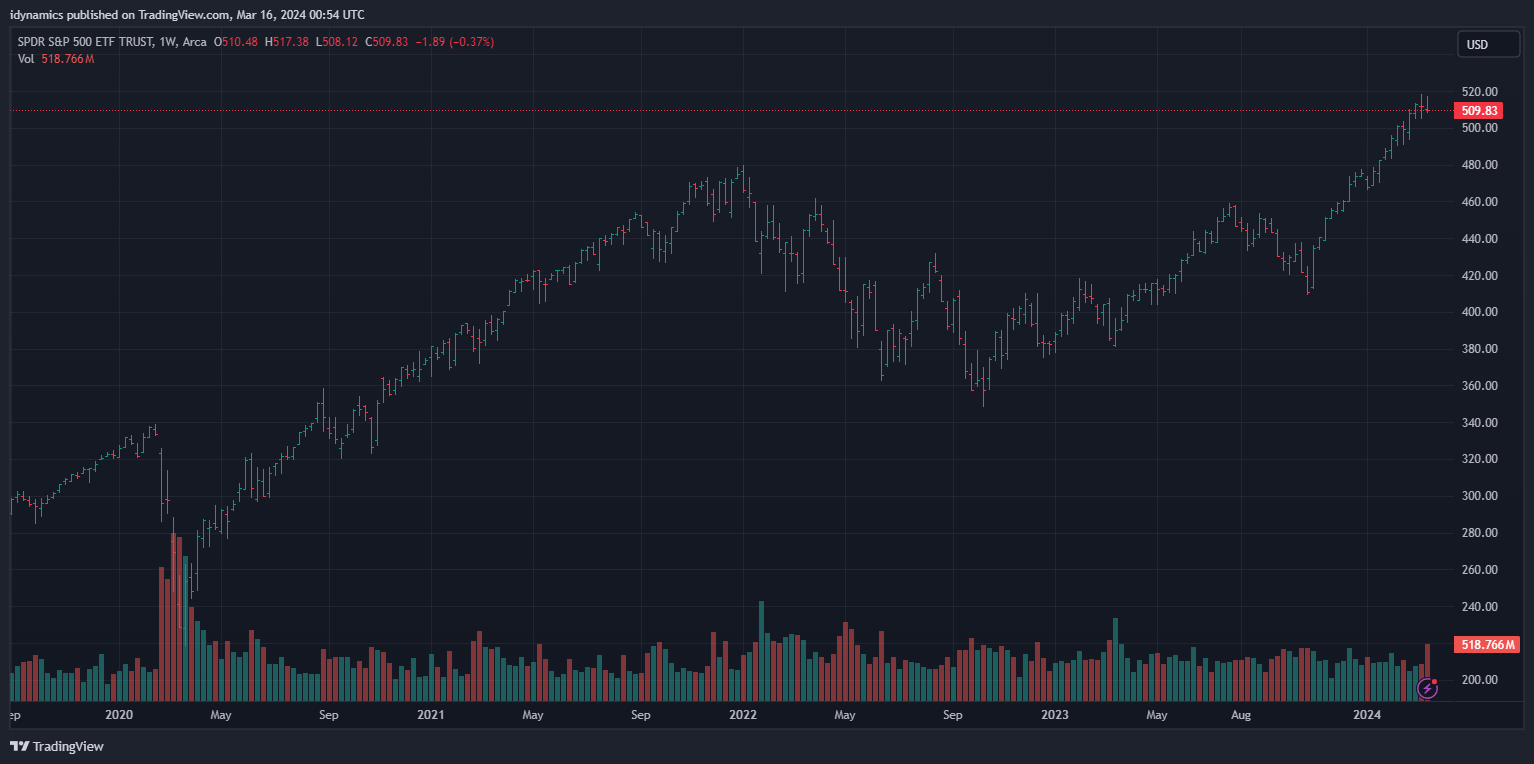
Resistance is 5140/5144, 5154 and 5161/5163. Rallies over 5163 can carry to 5179/5180 with potential to retest the intraday highs at 5189/5190. Closes over 5190 set up a drive to 5288 with counts toward 5432. A breakout over 5432 will open potential to the 5720 area. Closes over 5720 offer upside targets at 6000/6008.
S&P 500 Index Weekly HLC
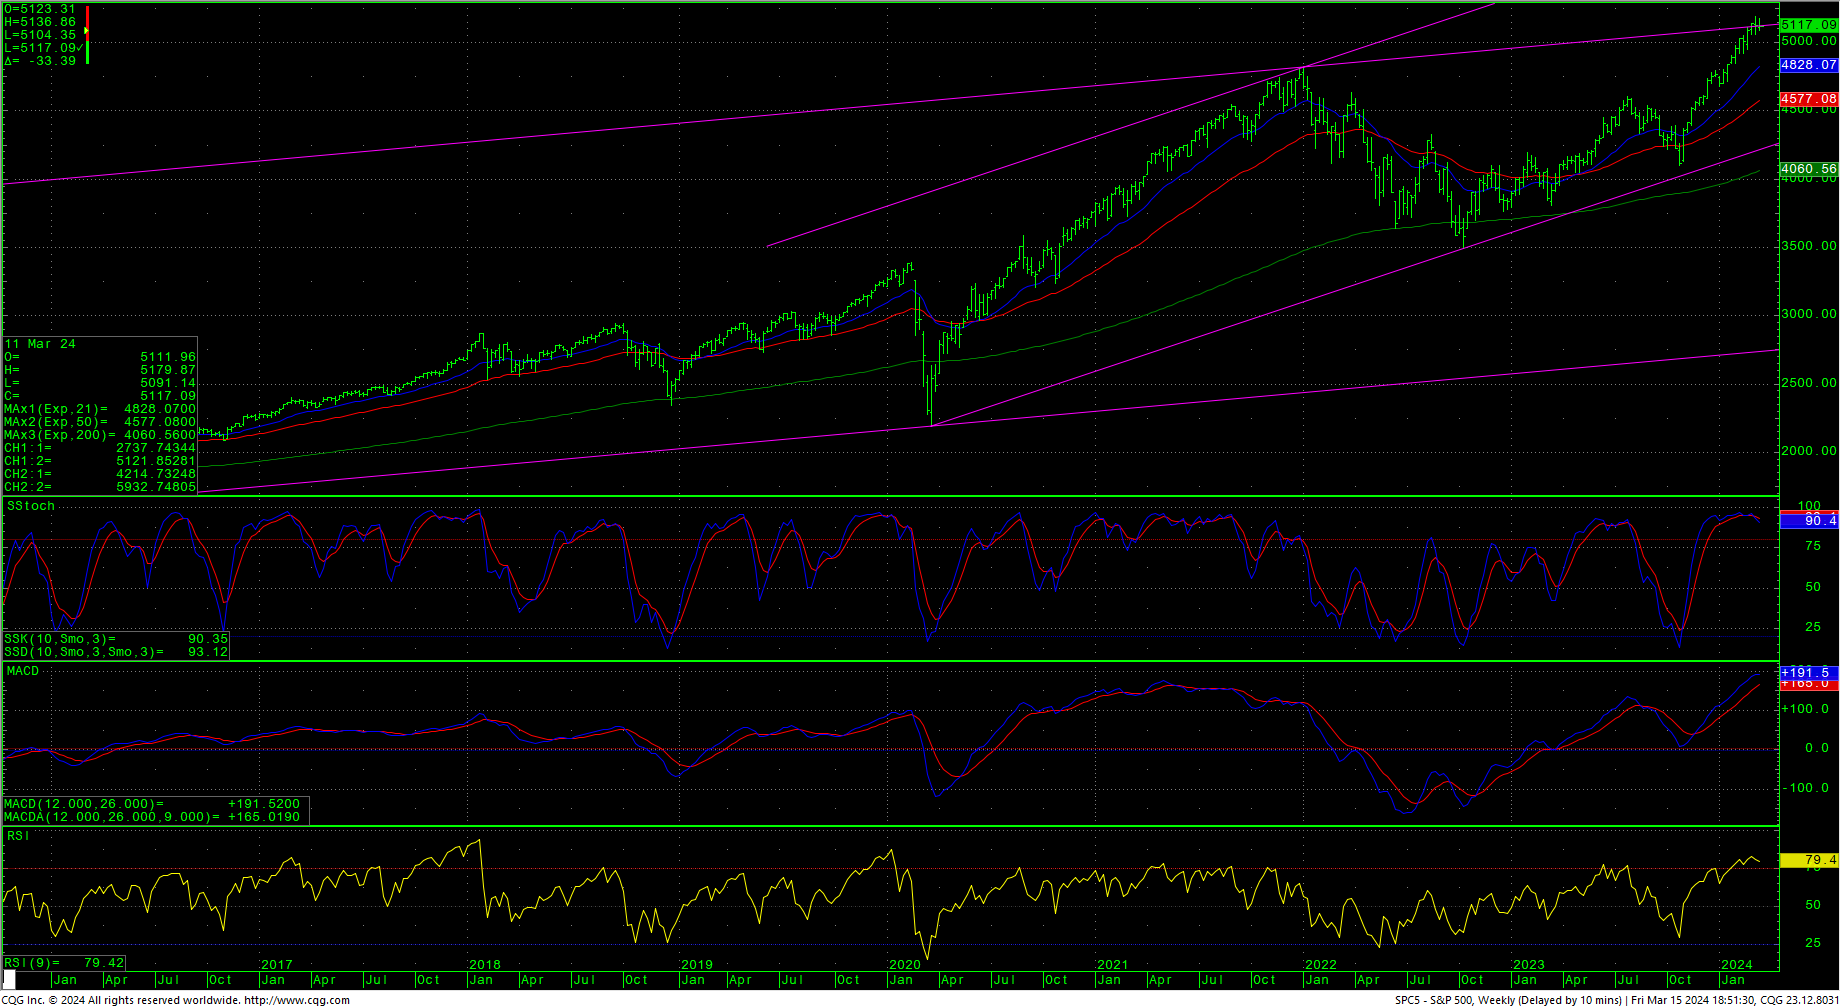 Support remains at 5092 though 5080 where there is a gap. A breakdown under 5080 sets up a move to 5054 with potential to 5023/5020 with gap support of 5038. A breakdown under 5020 sets up a move to 4987/4983. Closes under 4983 suggest critical support of 4933/4920. A breakdown under 4920 should test 4774 with potential to 4714. Under 4714 counts toward 4646 with potential to pivotal support at 4518/4510. Daily closes under 4510 count toward 4447 with counts to 4315. Closes under 4315 have potential to critical short-term support of 4121/4115 through 4103.
Resistance
|
Support
|
Charts courtesy of CQG, Inc., CNN, Koyfin, Trading View and AAII