
TECHNICAL ANALYSIS (by Intraday Dynamics)
Major Indices Week of July 5, 2024
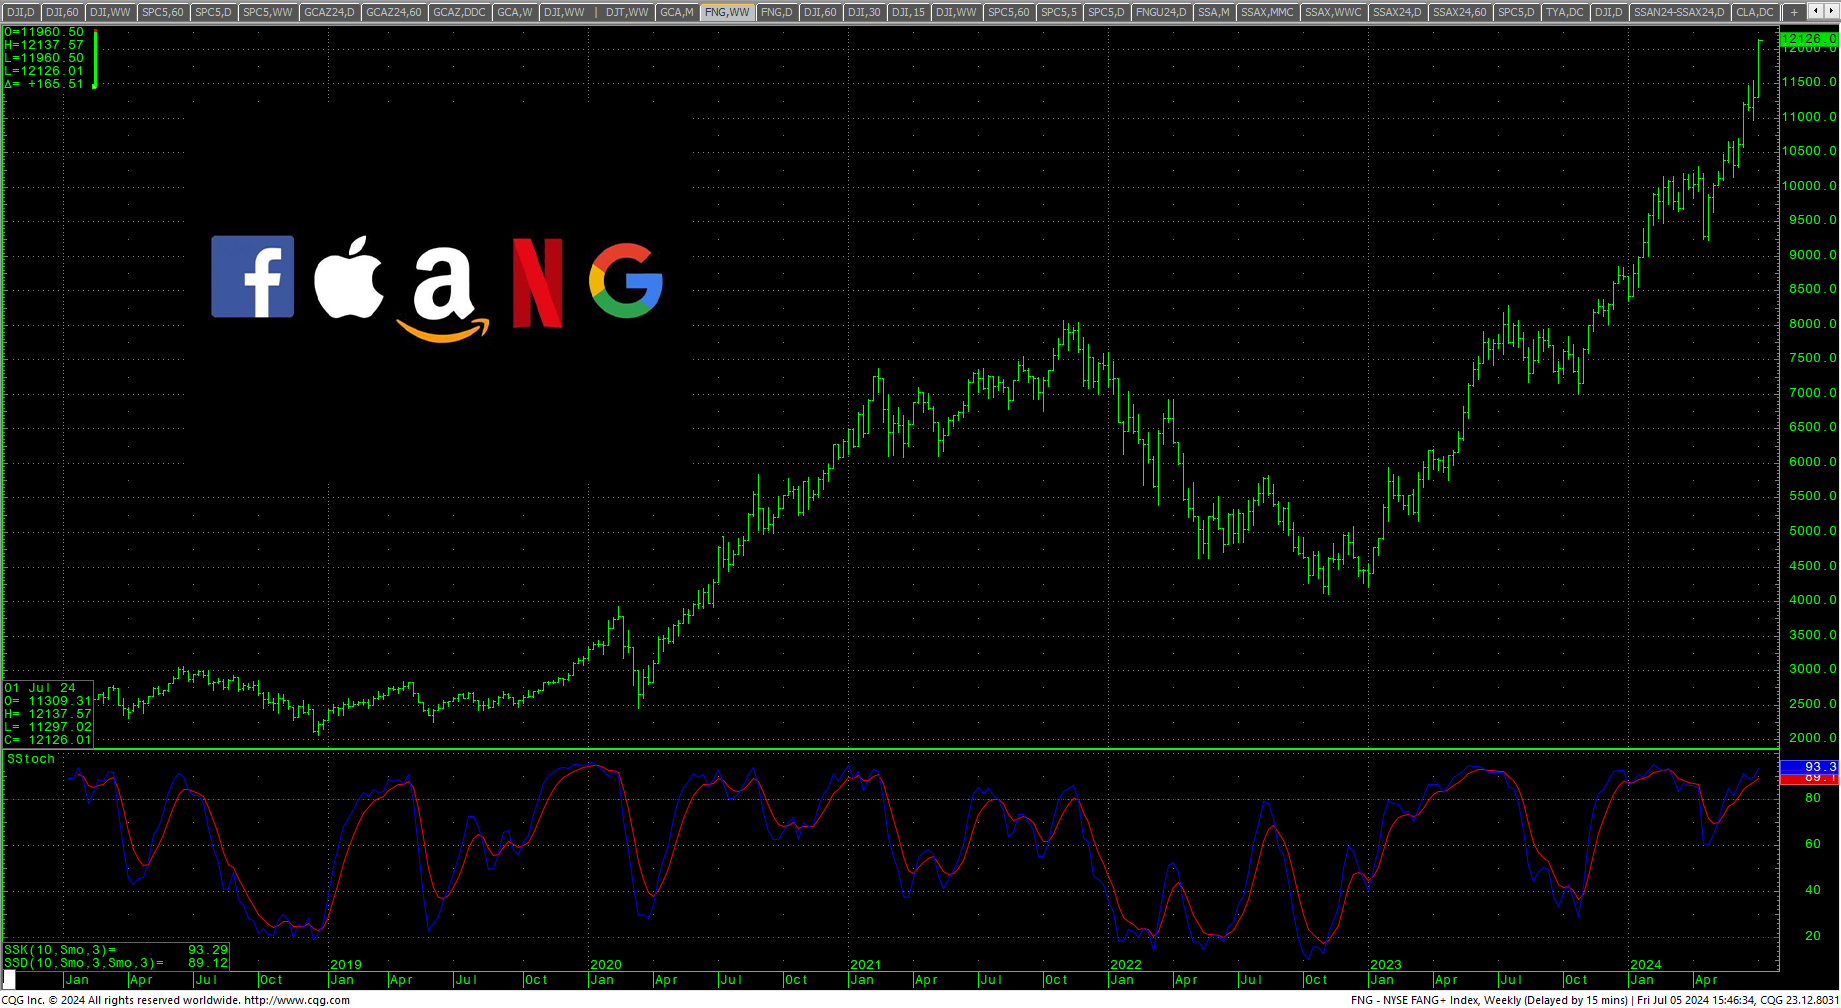
 Magnificent Seven ETF Daily H-L-C
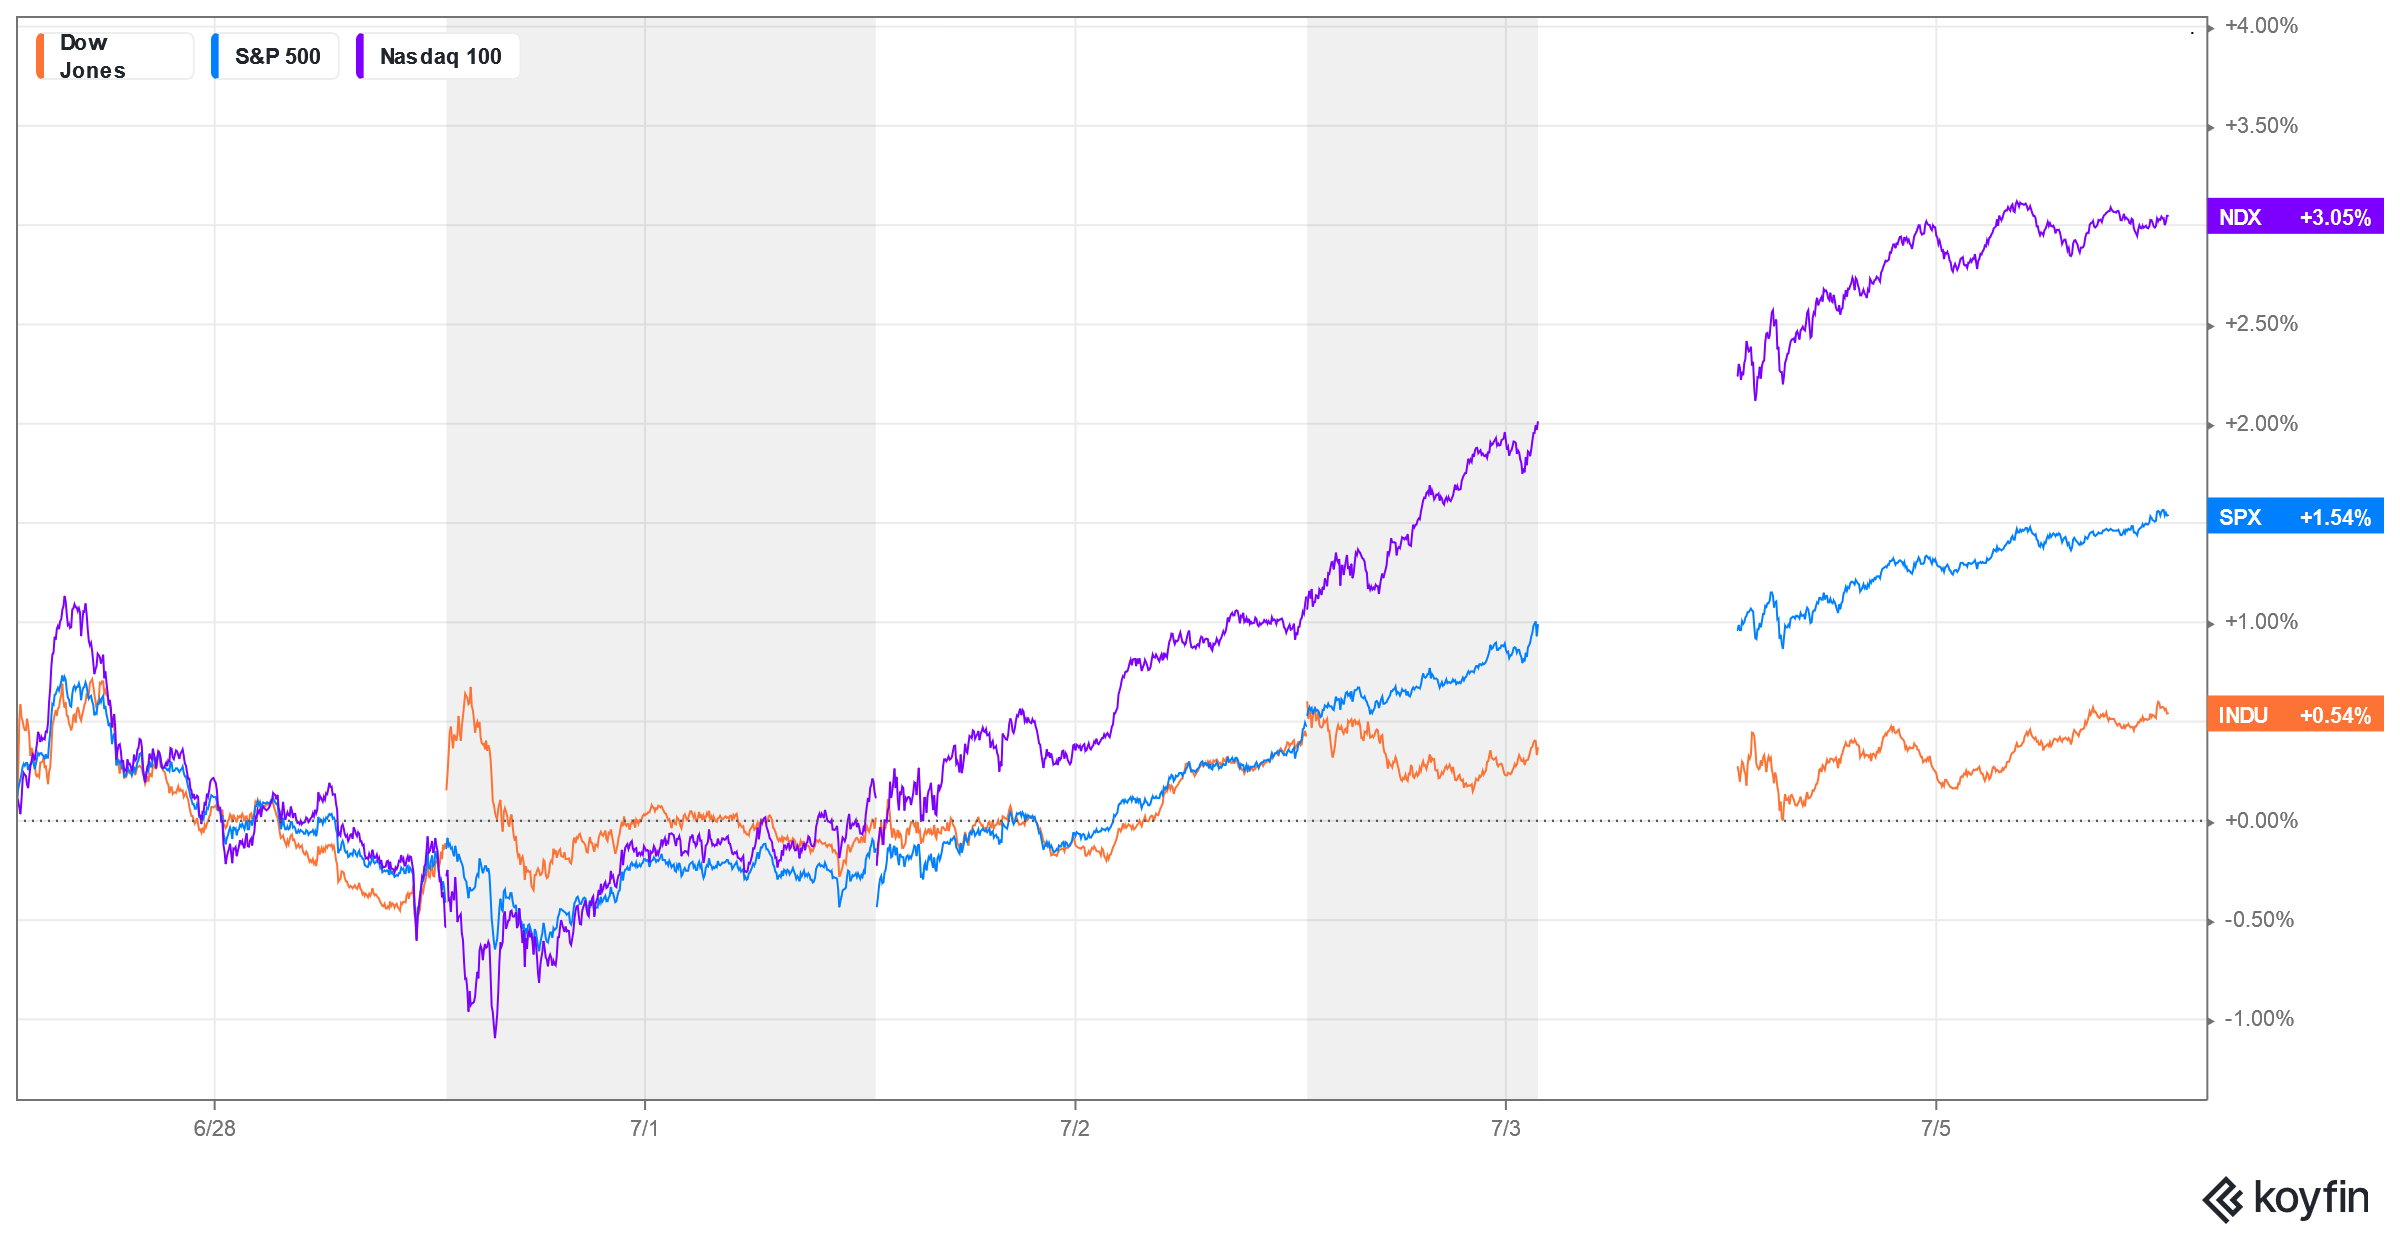
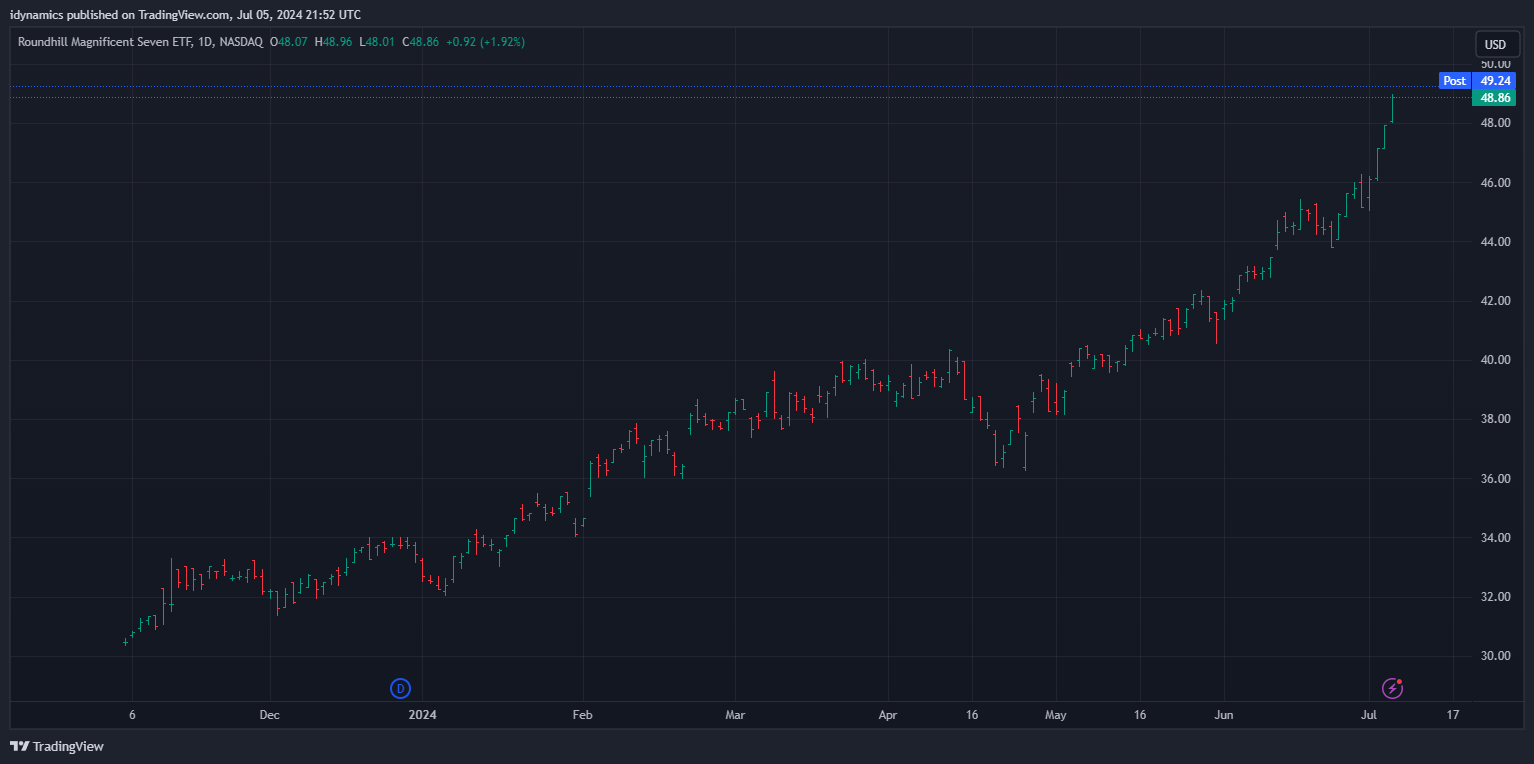 Stocks traded a light volume holiday week, but not one short of fireworks and rockets as the tech sector continued to lead indices higher with new records being set in the FANG, Nasdaq and the S&P 500. There were some big psychological levels breached the past week with the Nasdaq Composite clearing the 18K level, the Nasdaq 100 clearing 20K and the FANG rocketing above 12K. The MAG7 went into a vertical on the week.
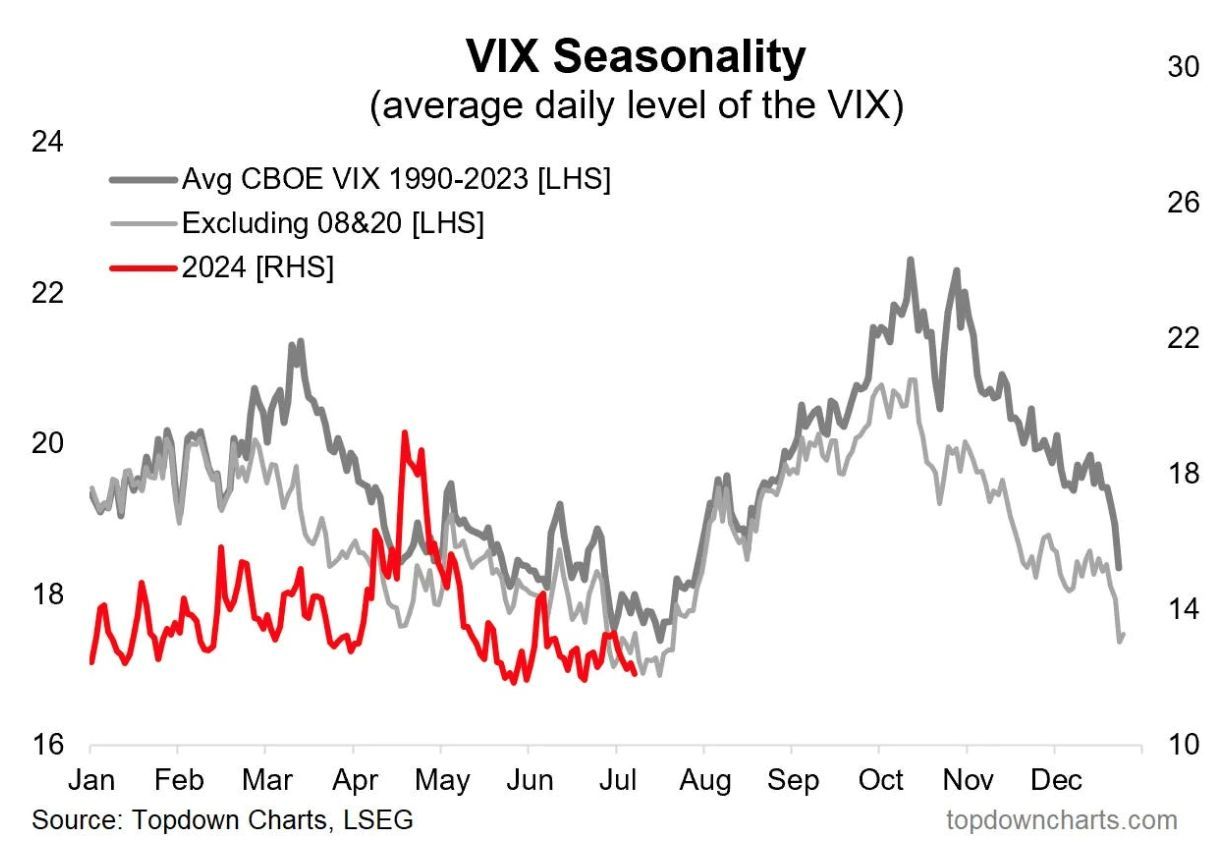
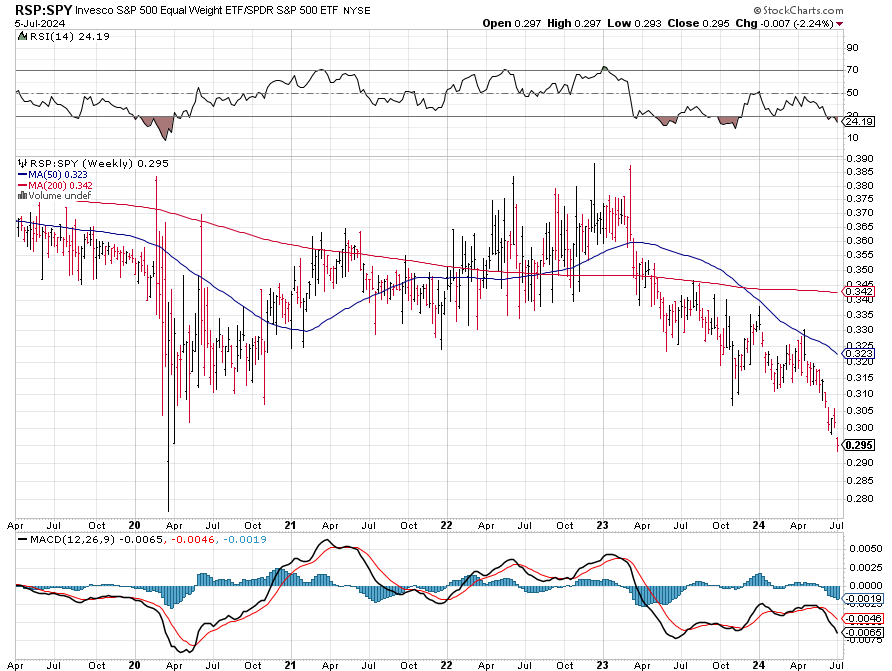
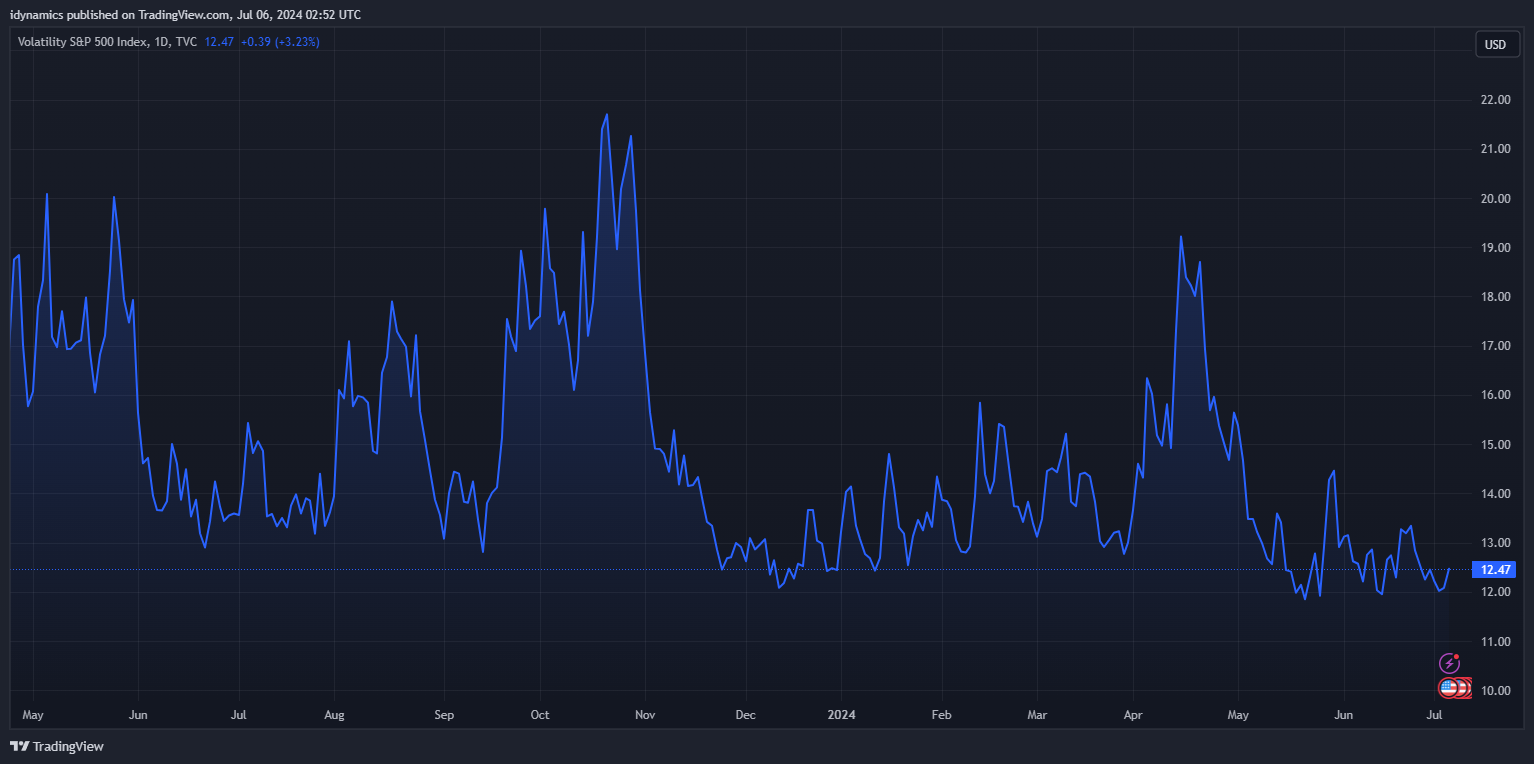
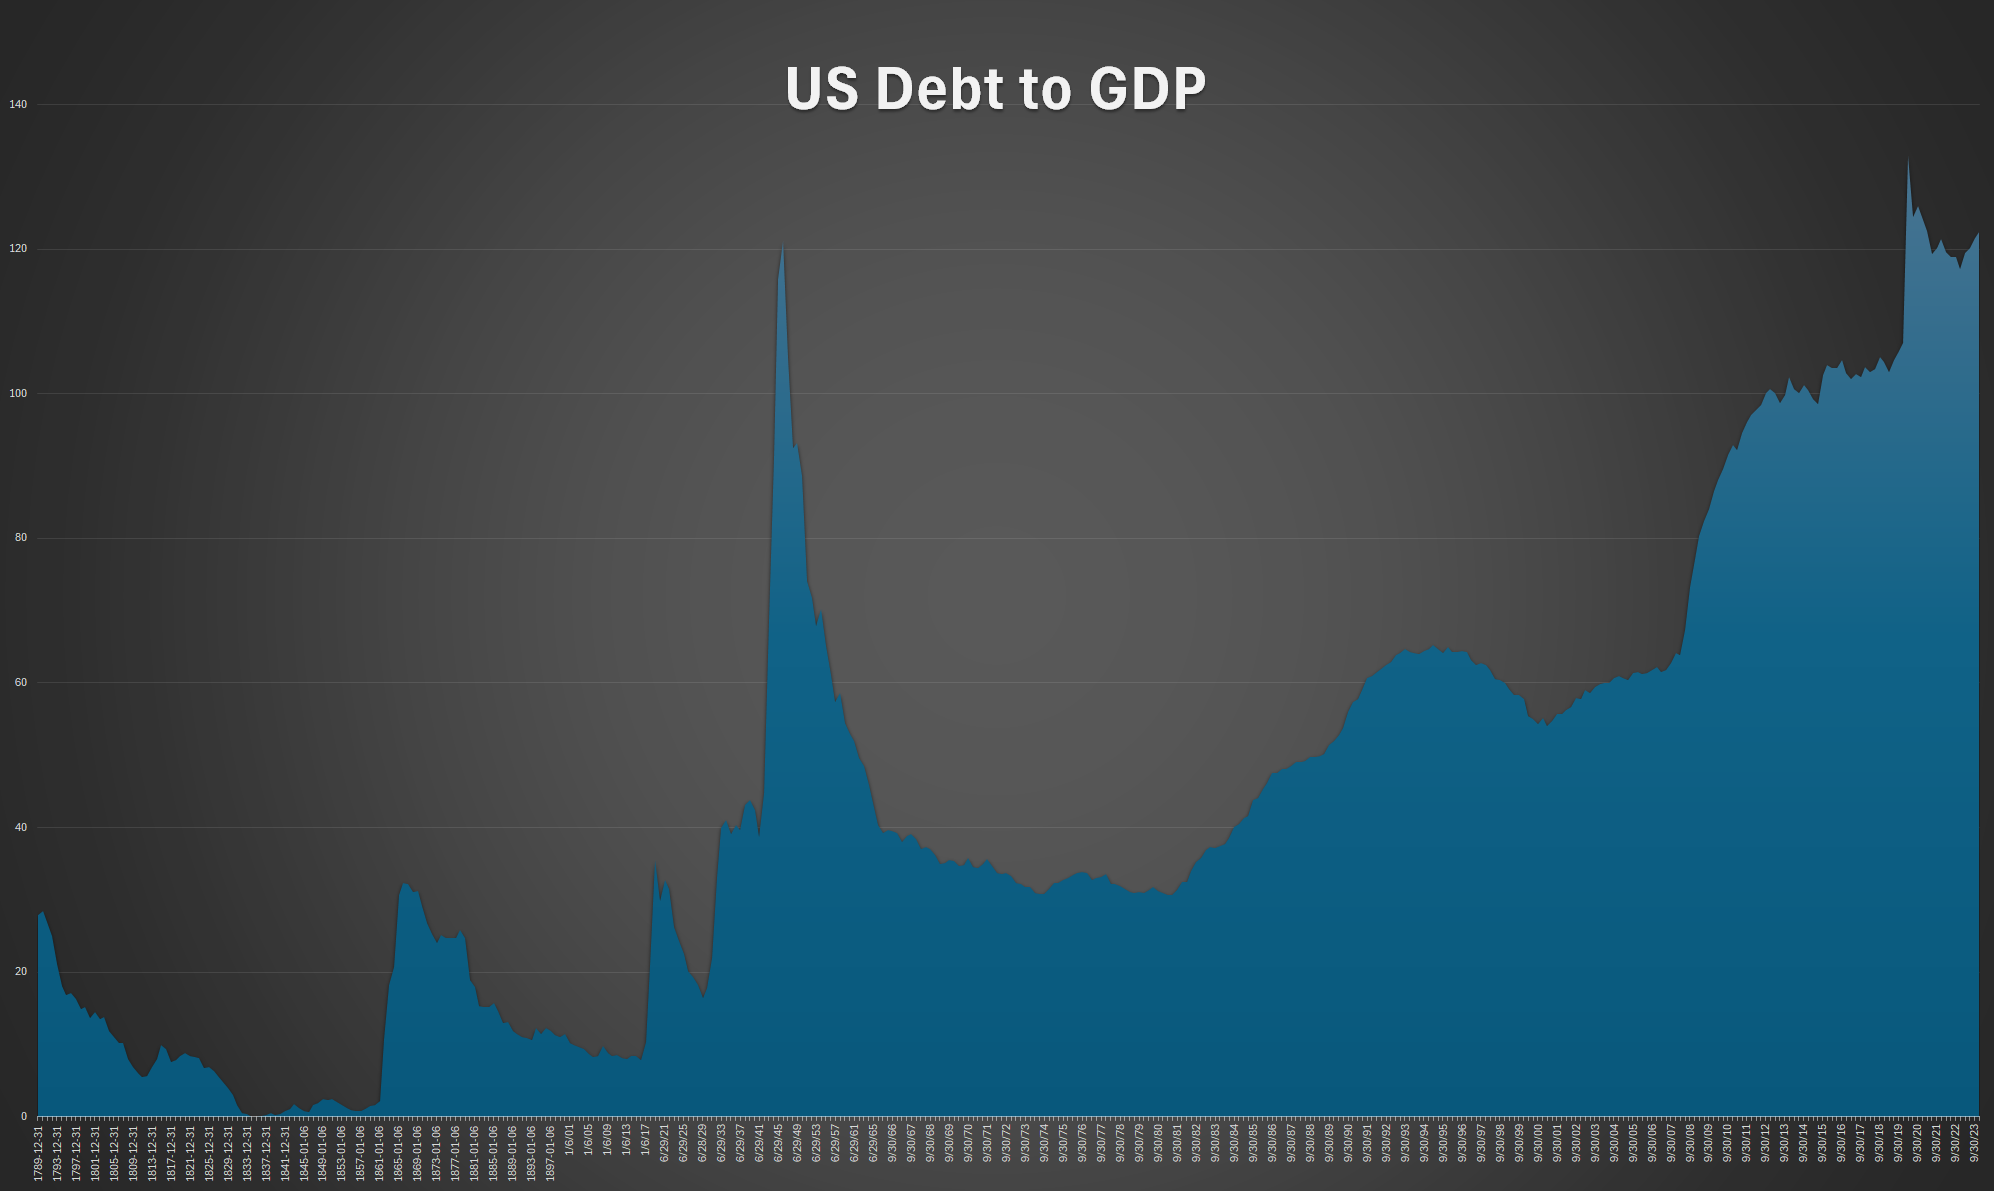
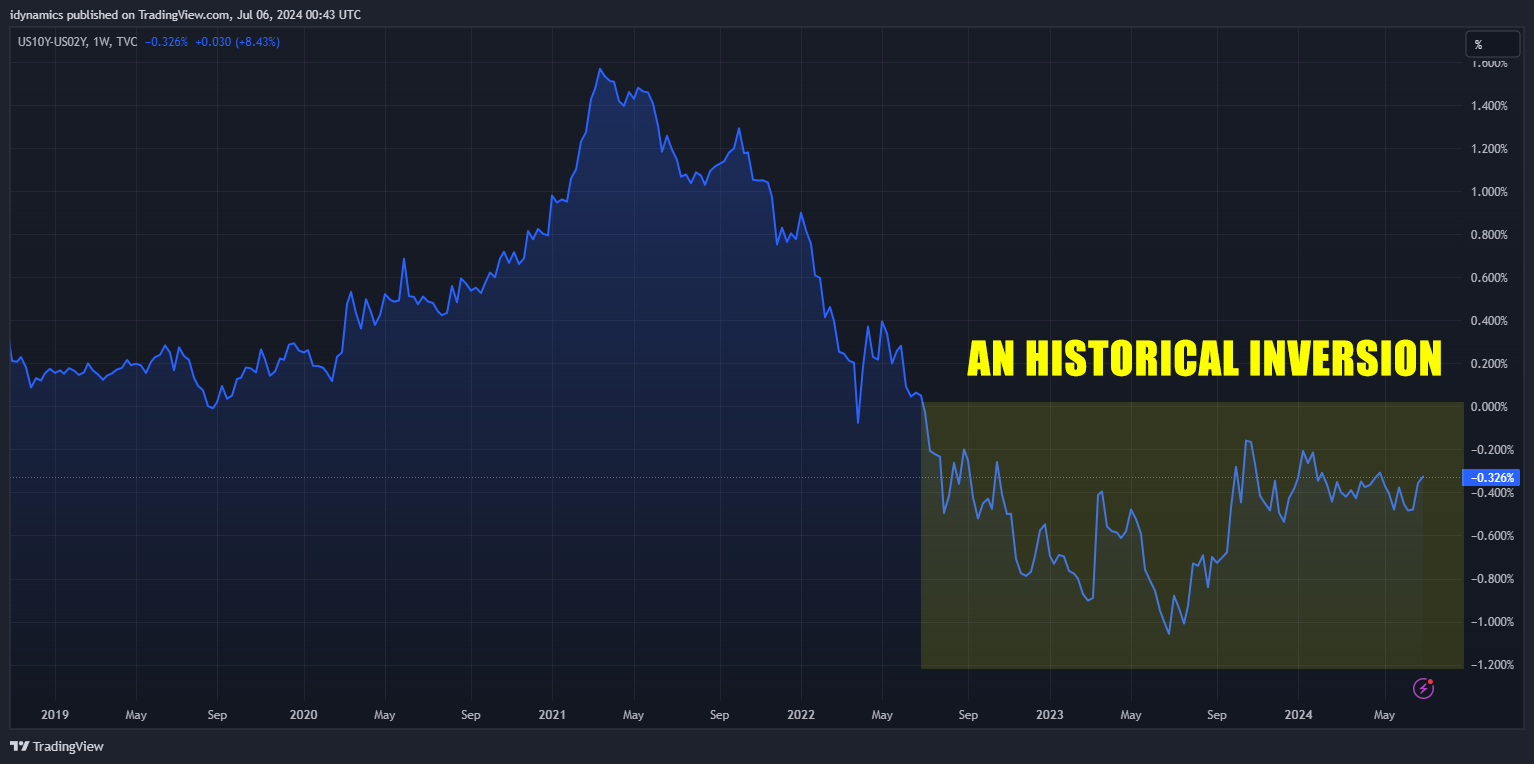
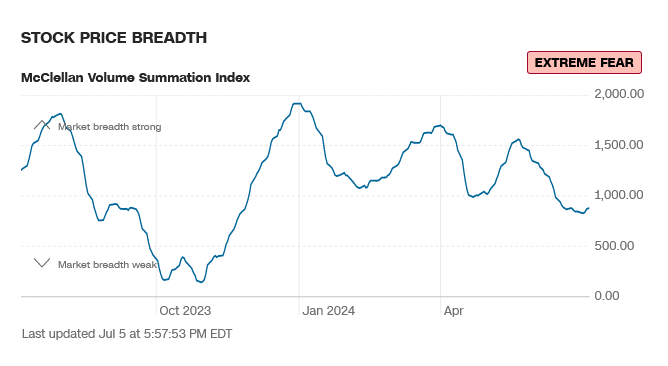
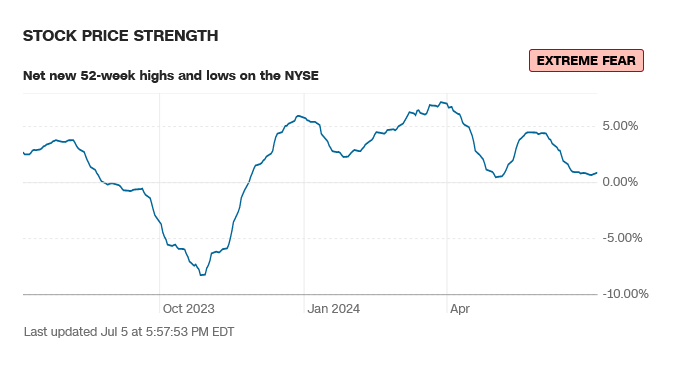
Sentiment continues to be all over the map. Last Friday, after the S&P staged a large outside day down (from a RECORD intraday high), CNBC ran an article stating that the market was giving off warning signs? It is not that unusual for new highs to bring out the doom and gloom, end of the world crowd…but it seems to get extreme the more prices rise. That said, there are any number of cautionary flags that one can look at as troublesome. In no particular order, the market is extremely thin, with breadth negative and only a scant number of stocks actually participating in the rally; the RSP:SPY continues to trend toward some extreme lows; there is a seasonal trend in the VIX that tends to predict increased volatility in the second half of the year; there is tremendous anxiety surrounding the US election this fall; the cost to service the US debt has now reached levels exceeding what the spending is on the military annually and remains at historically high levels relative to GDP; the inverted yield curve has reached the longest inversion on record; US consumers have racked up over $1T in debt…and many other data that can lend themselves to the chicken little mentality. Pricewise, however, price and time remain bullish…until proven otherwise.
VIX Seasonal Patterns (Source: TopDownCharts.com)

 Dow Jones Industrial Average Daily Candles
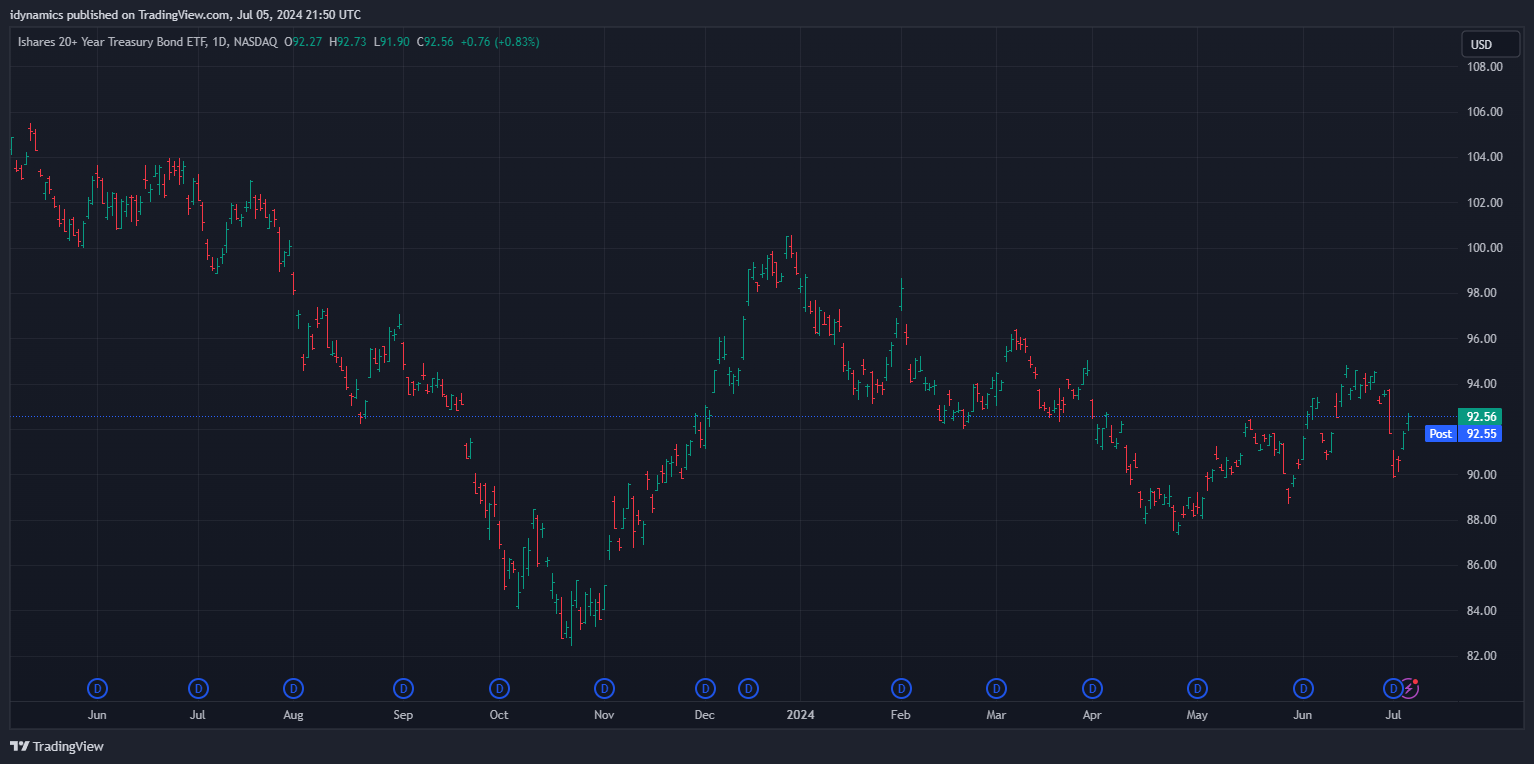
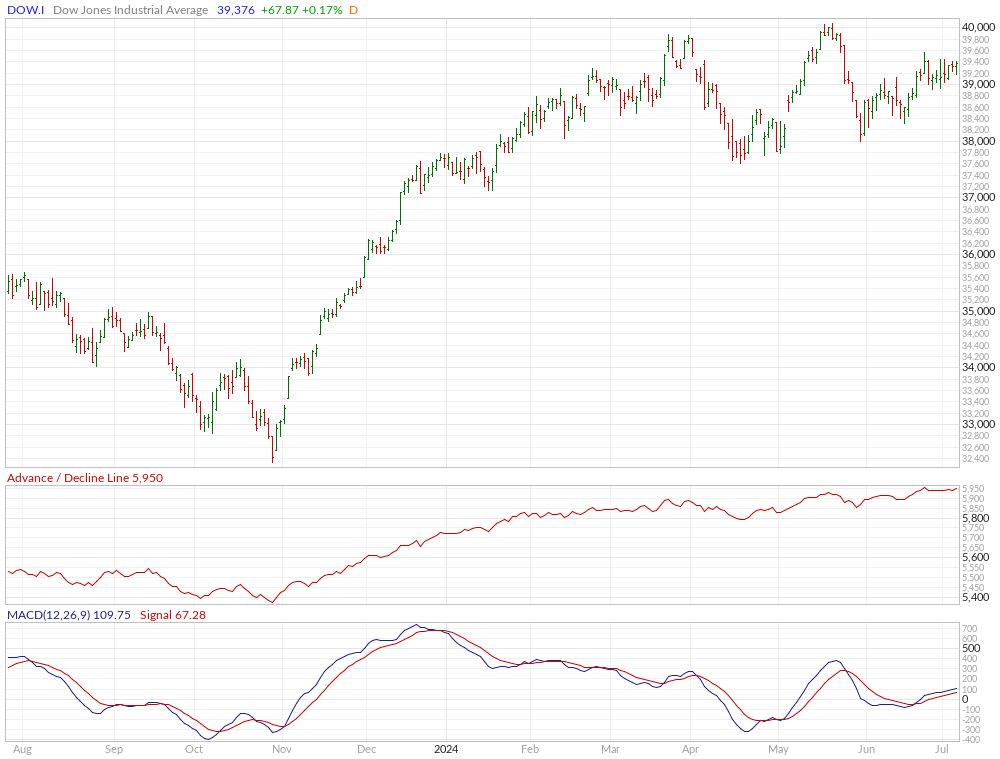
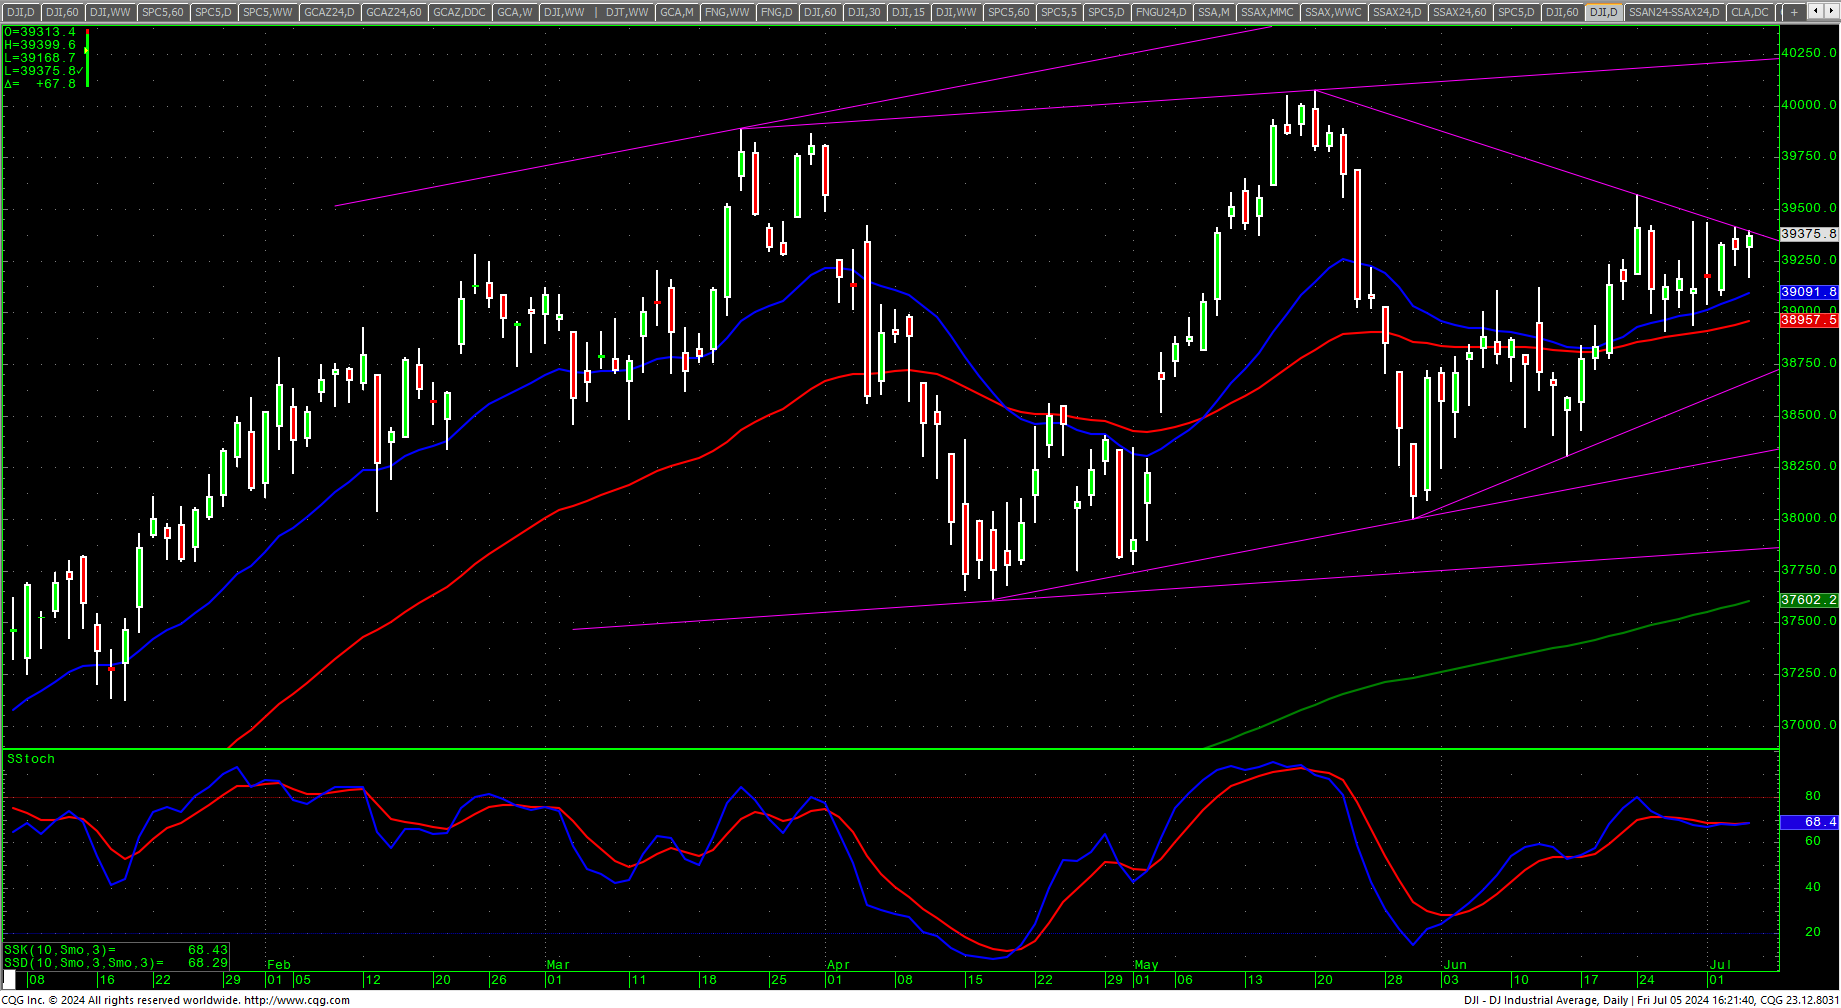 The Dow still appears to be trading in a congestion area of roughly 2000 points in, so far, what seems a normal secular market. The Dow tested, and closed just under, a key trendline on the daily chart as it builds this large pennant pattern at the highs. Breadth remains weak but shows extreme fear as a sentiment indicator. Friday’s US Employment data saw Unemployment tick up and slightly weaker than expected Payrolls (with healthcare and government leading the jobs) and the data spurred strong rallies in the bonds, notes and TLT…again, all just one week after the death knell was being sounded for the US economy based on the sharp rise in the 10-year.
TLT 20+ Year Treasury Bond ETF Daily H-L-C
 VIX Volatilty Index Weekly H-L-C
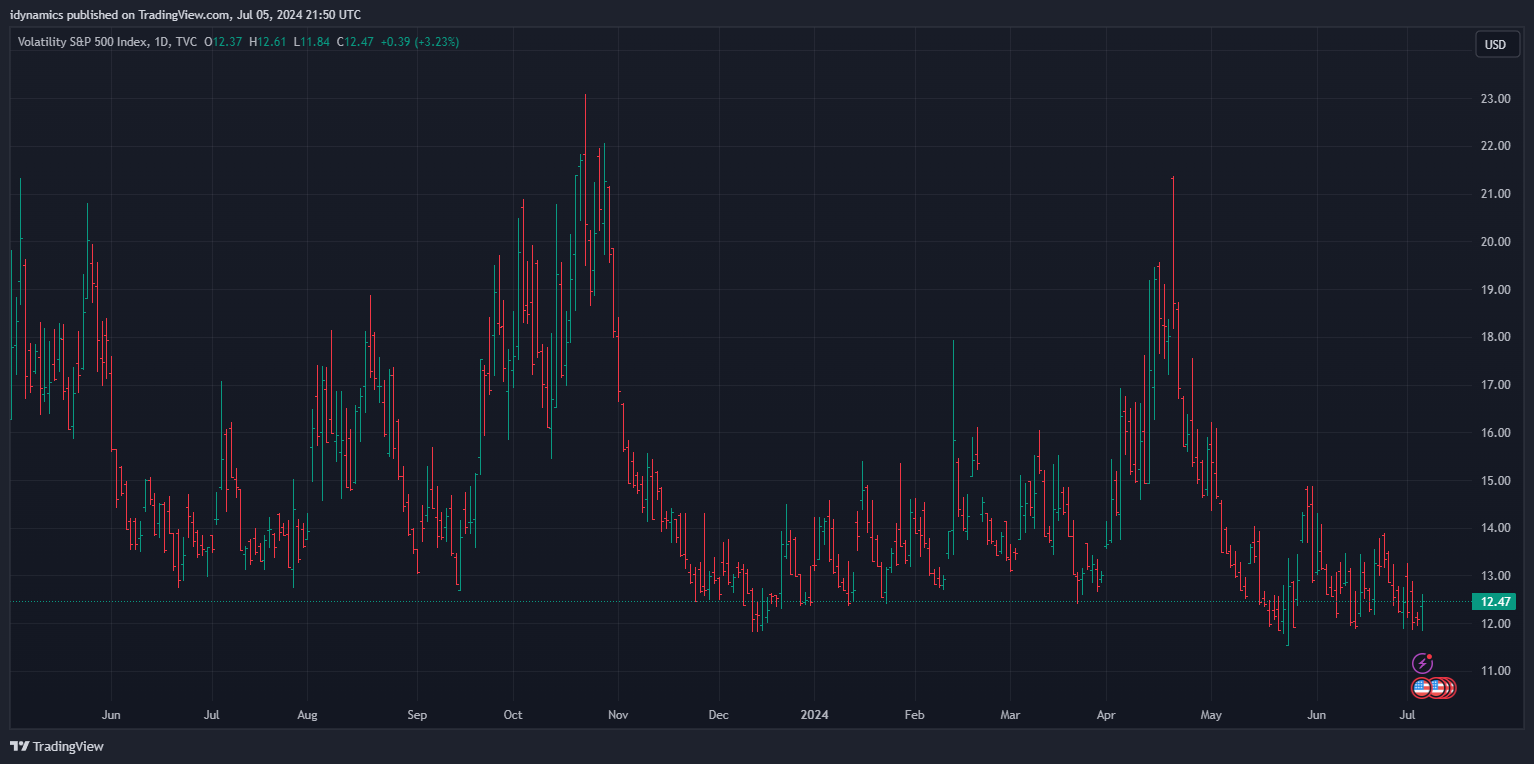
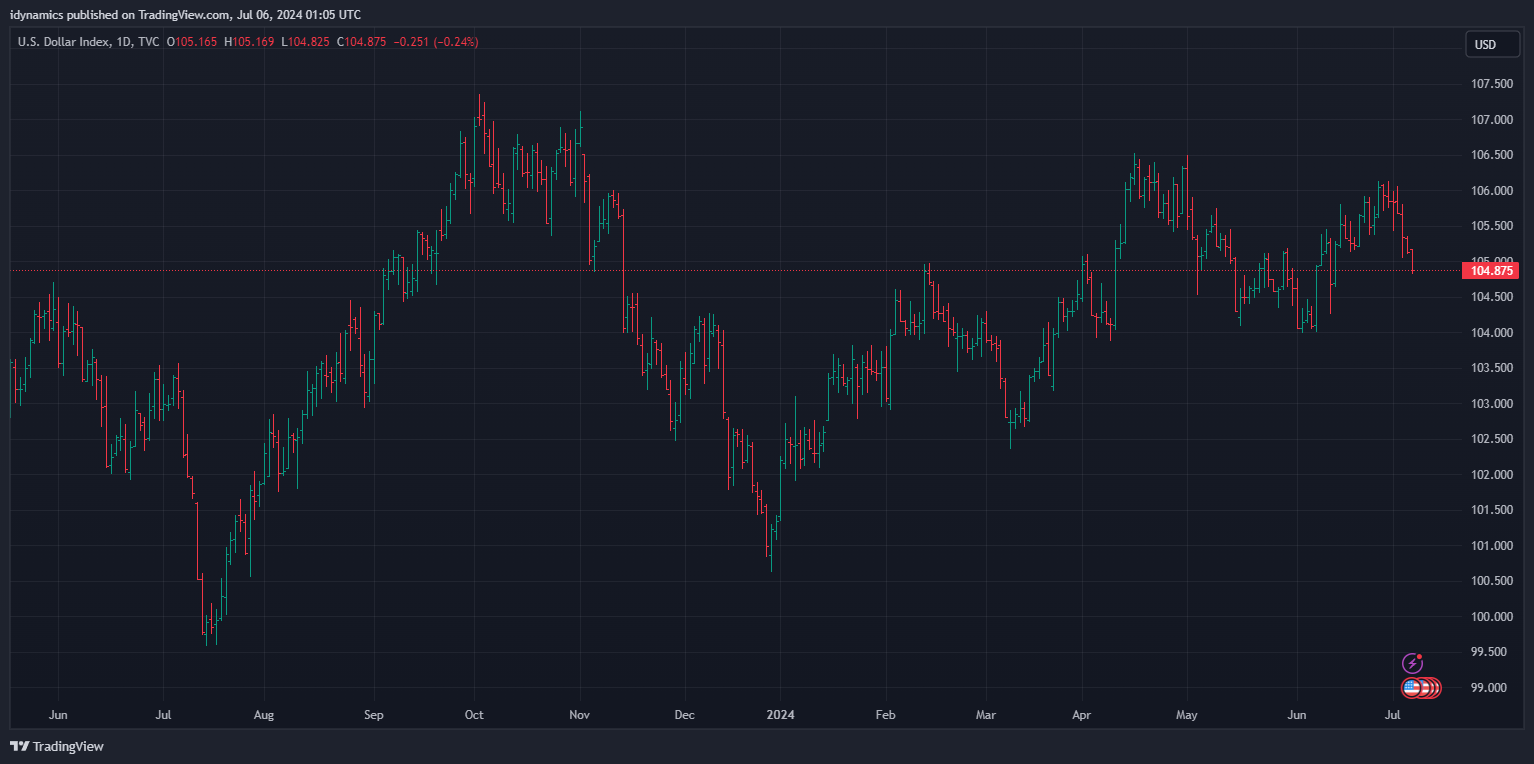
The VIX closed basically unchanged on the week, in the middle of a tight weekly range as it staged an outside day up on Friday. The Dollar sold off from the recent highs all week as it responds to overbought conditions on the daily chart.
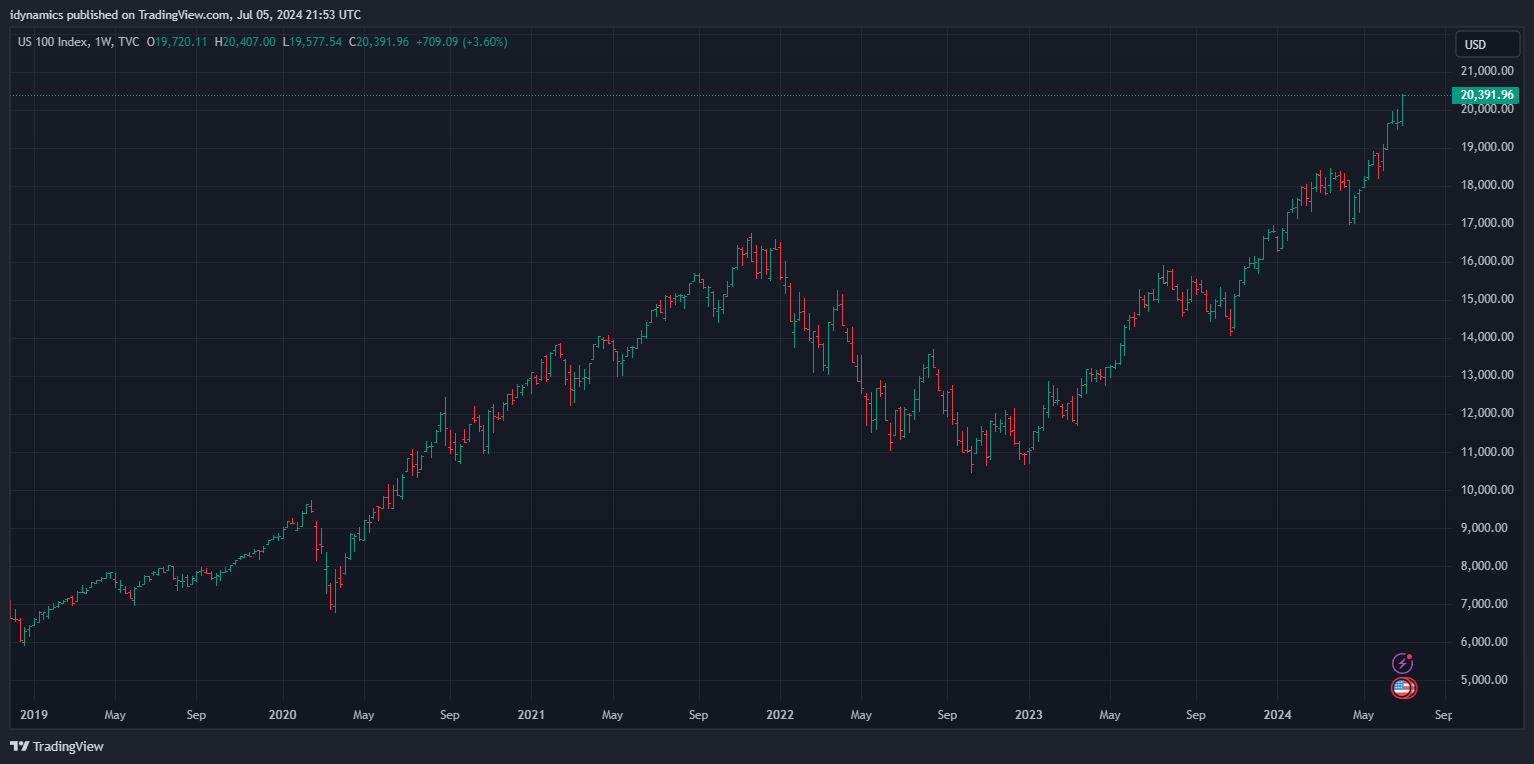
Nasdaq 100 Weekly H-L-C
52-Week A/D Line
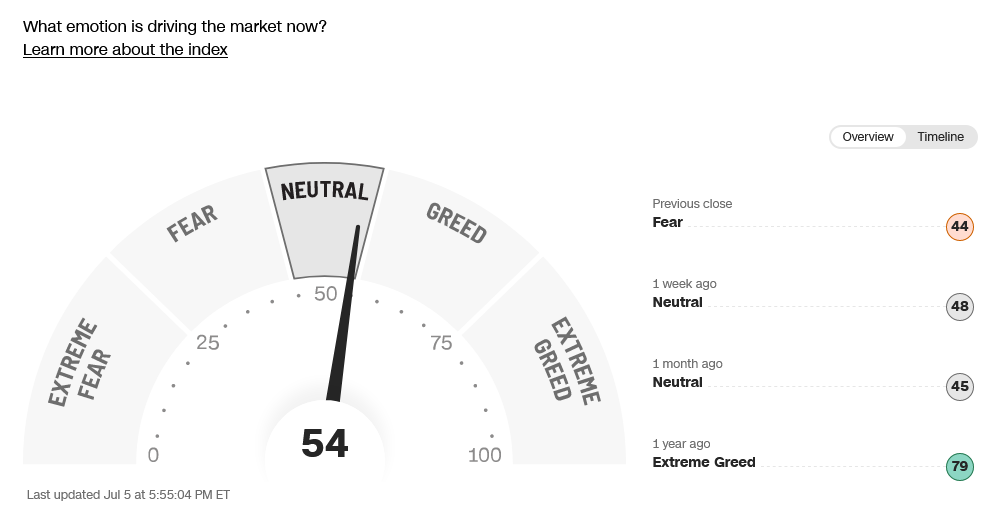
 CNN Fear & Greed Index
 AAII Investor Sentiment Survey
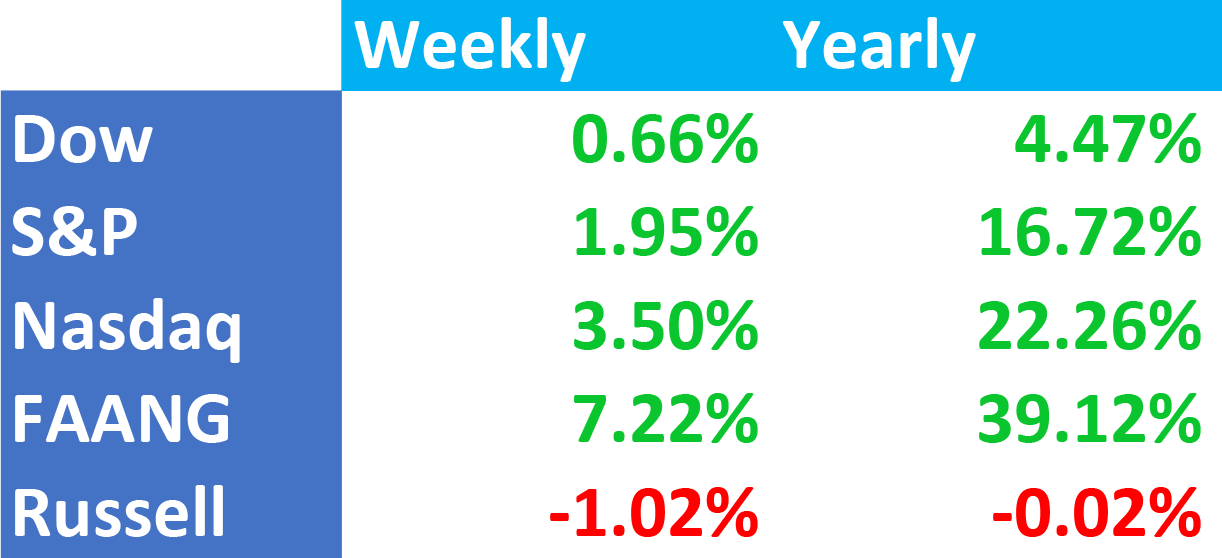
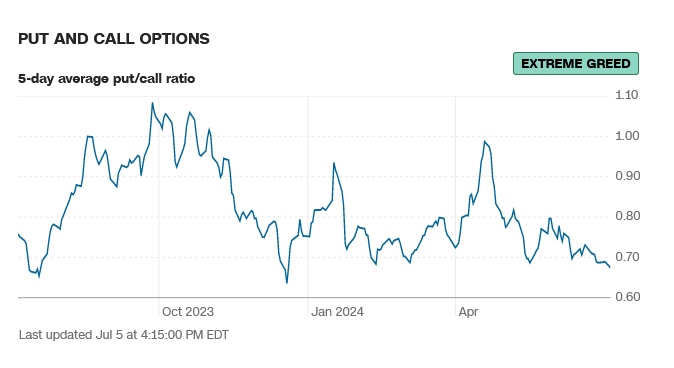
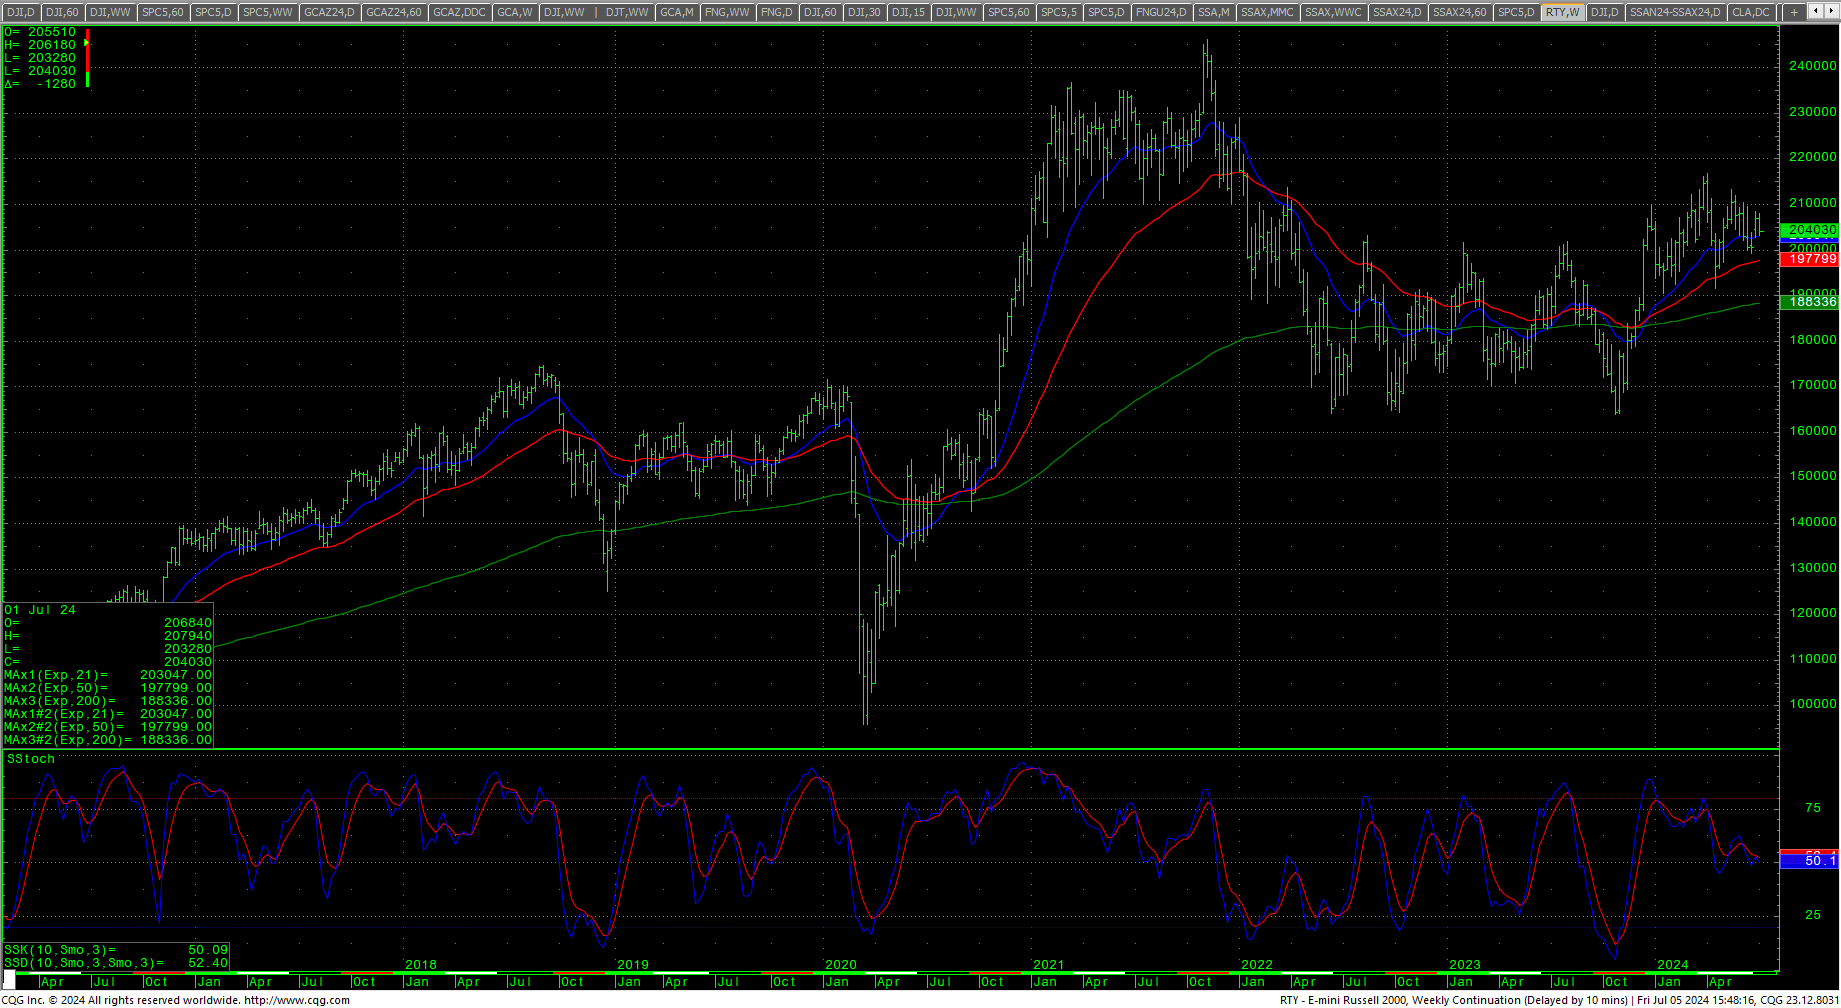
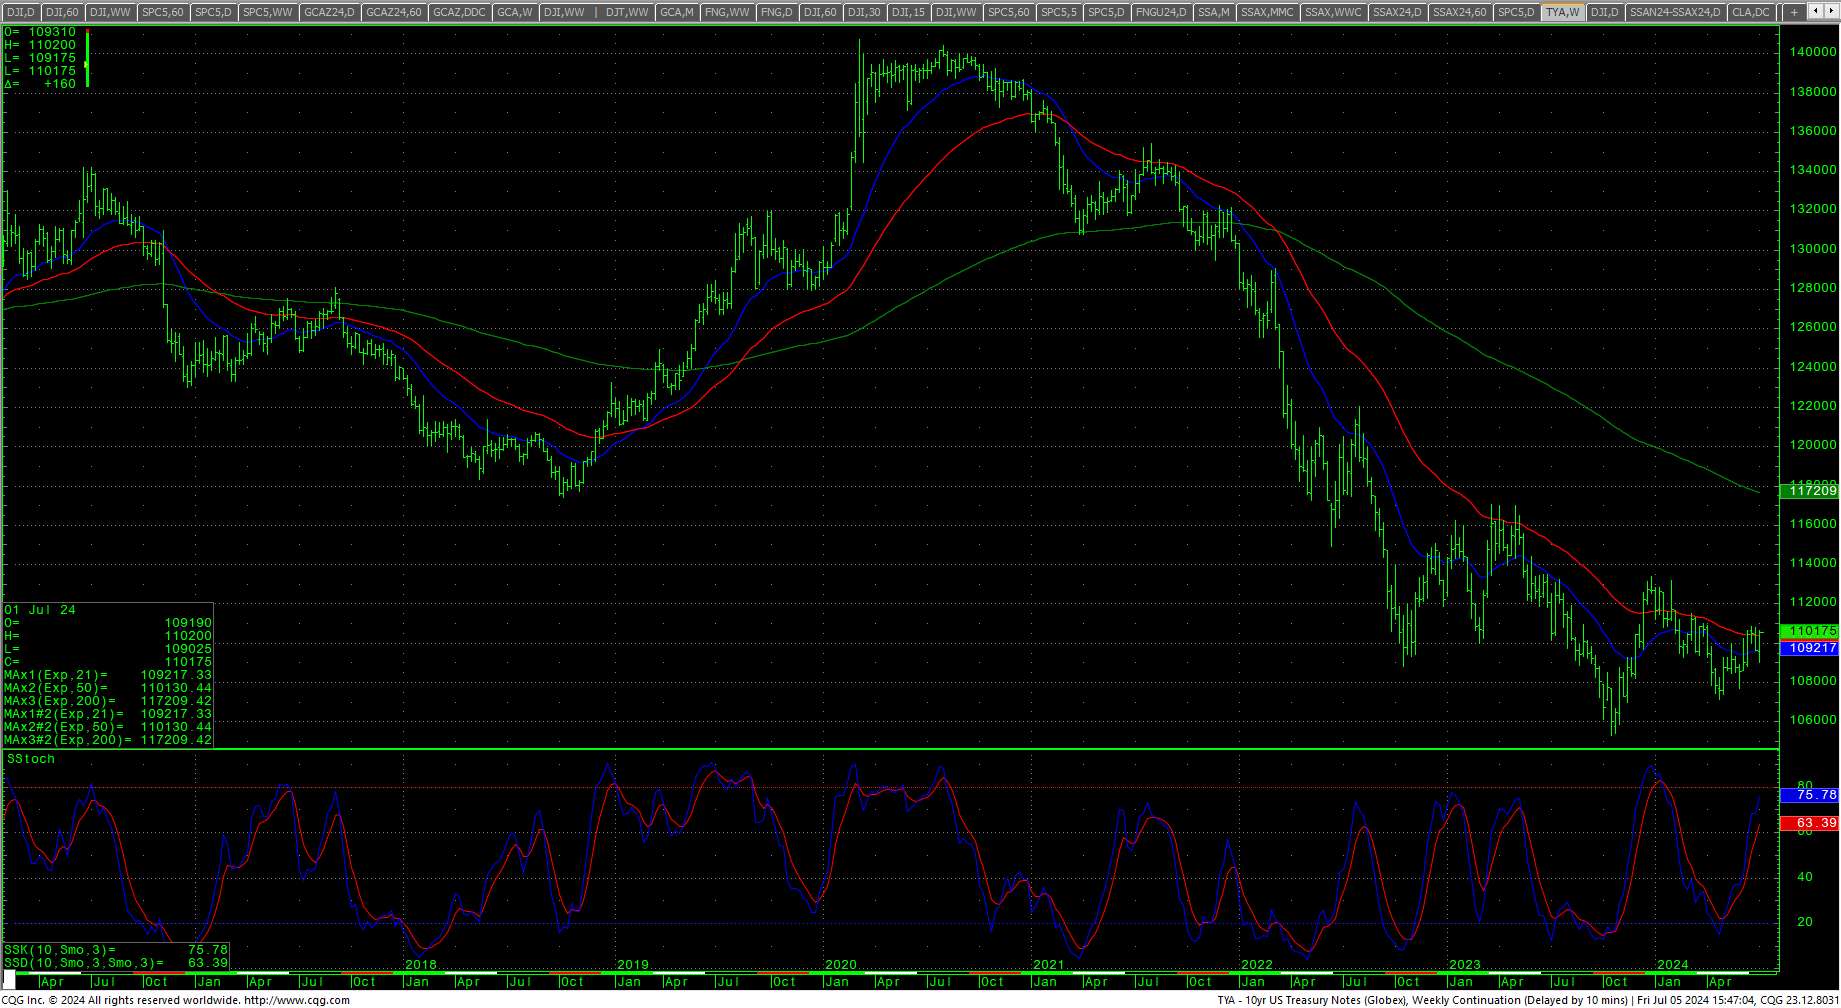
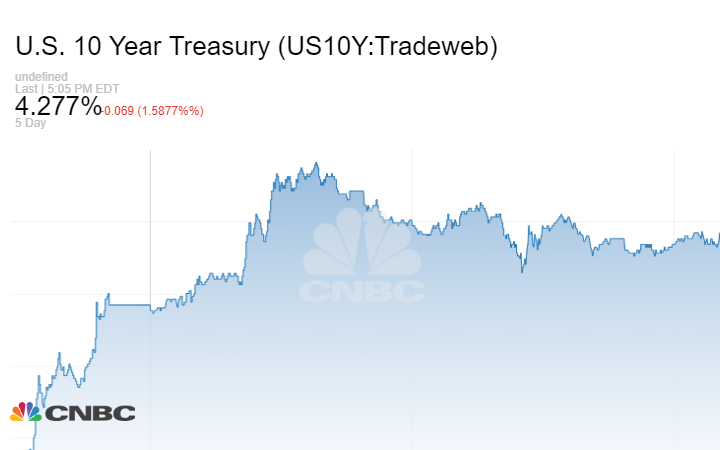
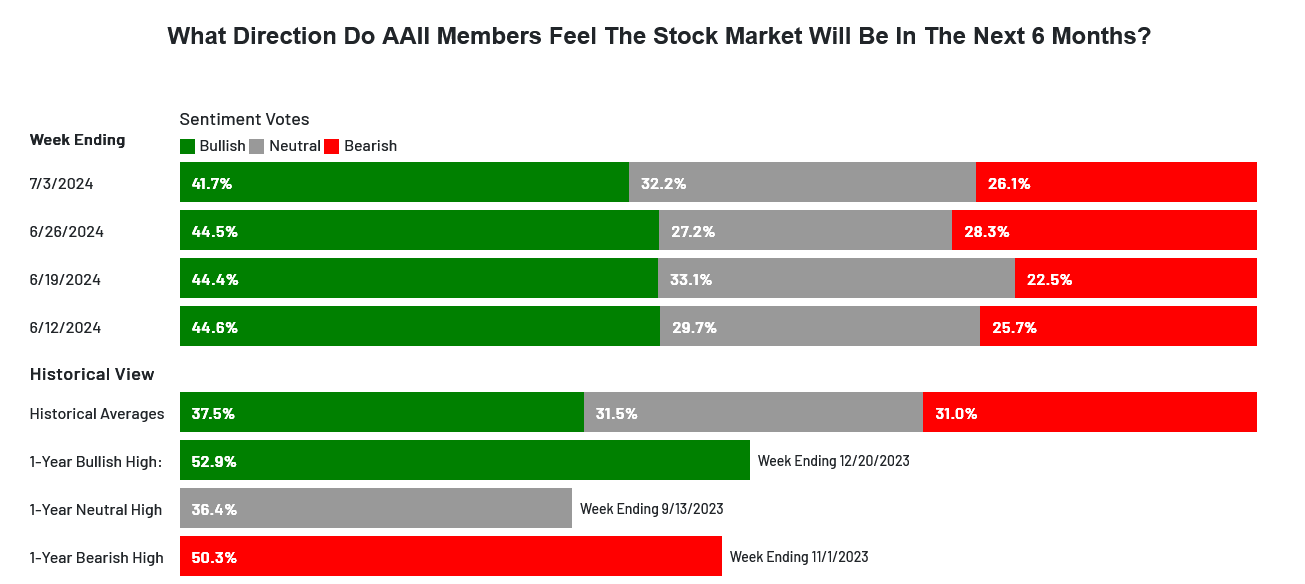 Sentiment, as indicated above, is manic. CNN Fear and Greed moved back to neutral. Breadth remains weak and reads extreme fear. Latest AAII Sentiment Survey: Neutral Sentiment Decreases. The Dow A/D line ticked up to 5950, as the MACD is turning up. The VIX, as mentioned above, ended the week unchanged, staging an outside day up on Friday. The Put/Call is at 0.67 and is showing extreme greed. The 52-week, A/D ticked up to +0.90 and indicates extreme fear. The Dow closed the week up +0.66% on the top of an inside week’s range. The S&P settled up +1.95% on the top of the weekly range at a new record. The Nasdaq Composite was up +3.50% and the Nasdaq 100 was up +3.60%. The FANG exploded higher, settling up +7.22% on the top of the weekly range at a record high. The Russell continues to drag, closing down -1.02%. The 10-year notes staged a wide reversal week higher and closed on the top of the weekly range. For support and resistance on the SEP TYU24, see the latest Special Report. The yield on the 10YR declined to 4.277%.
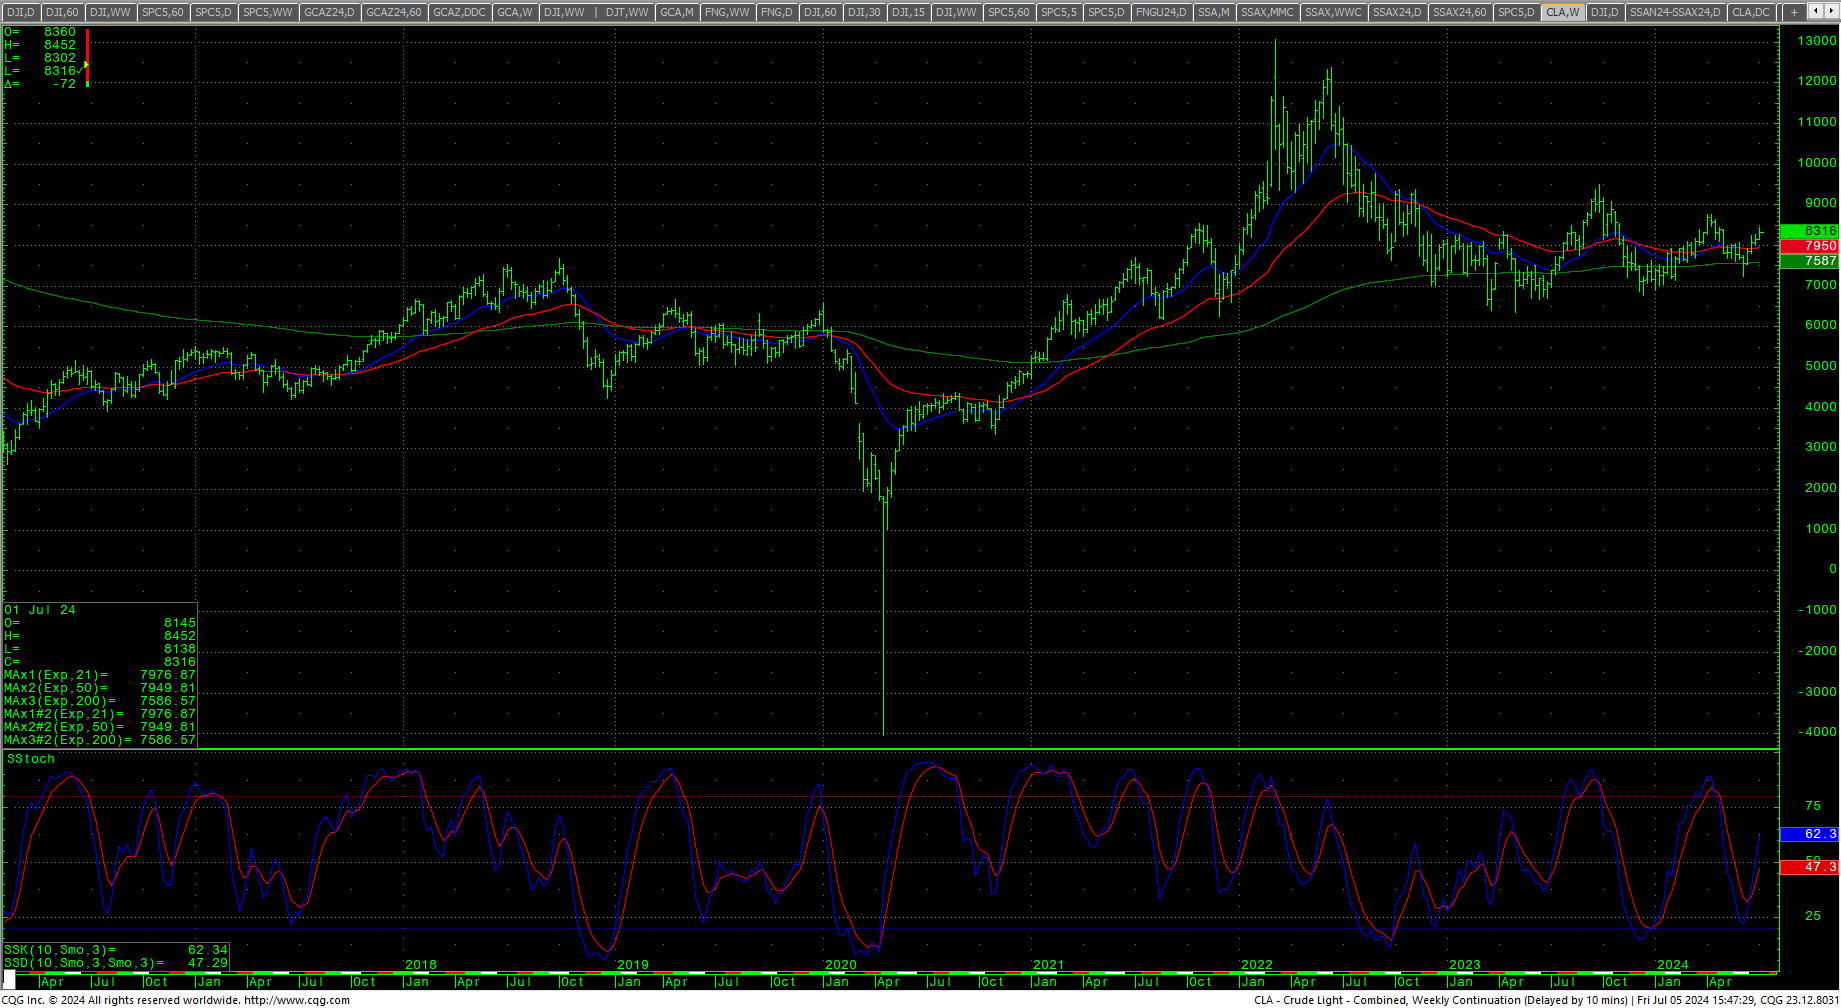
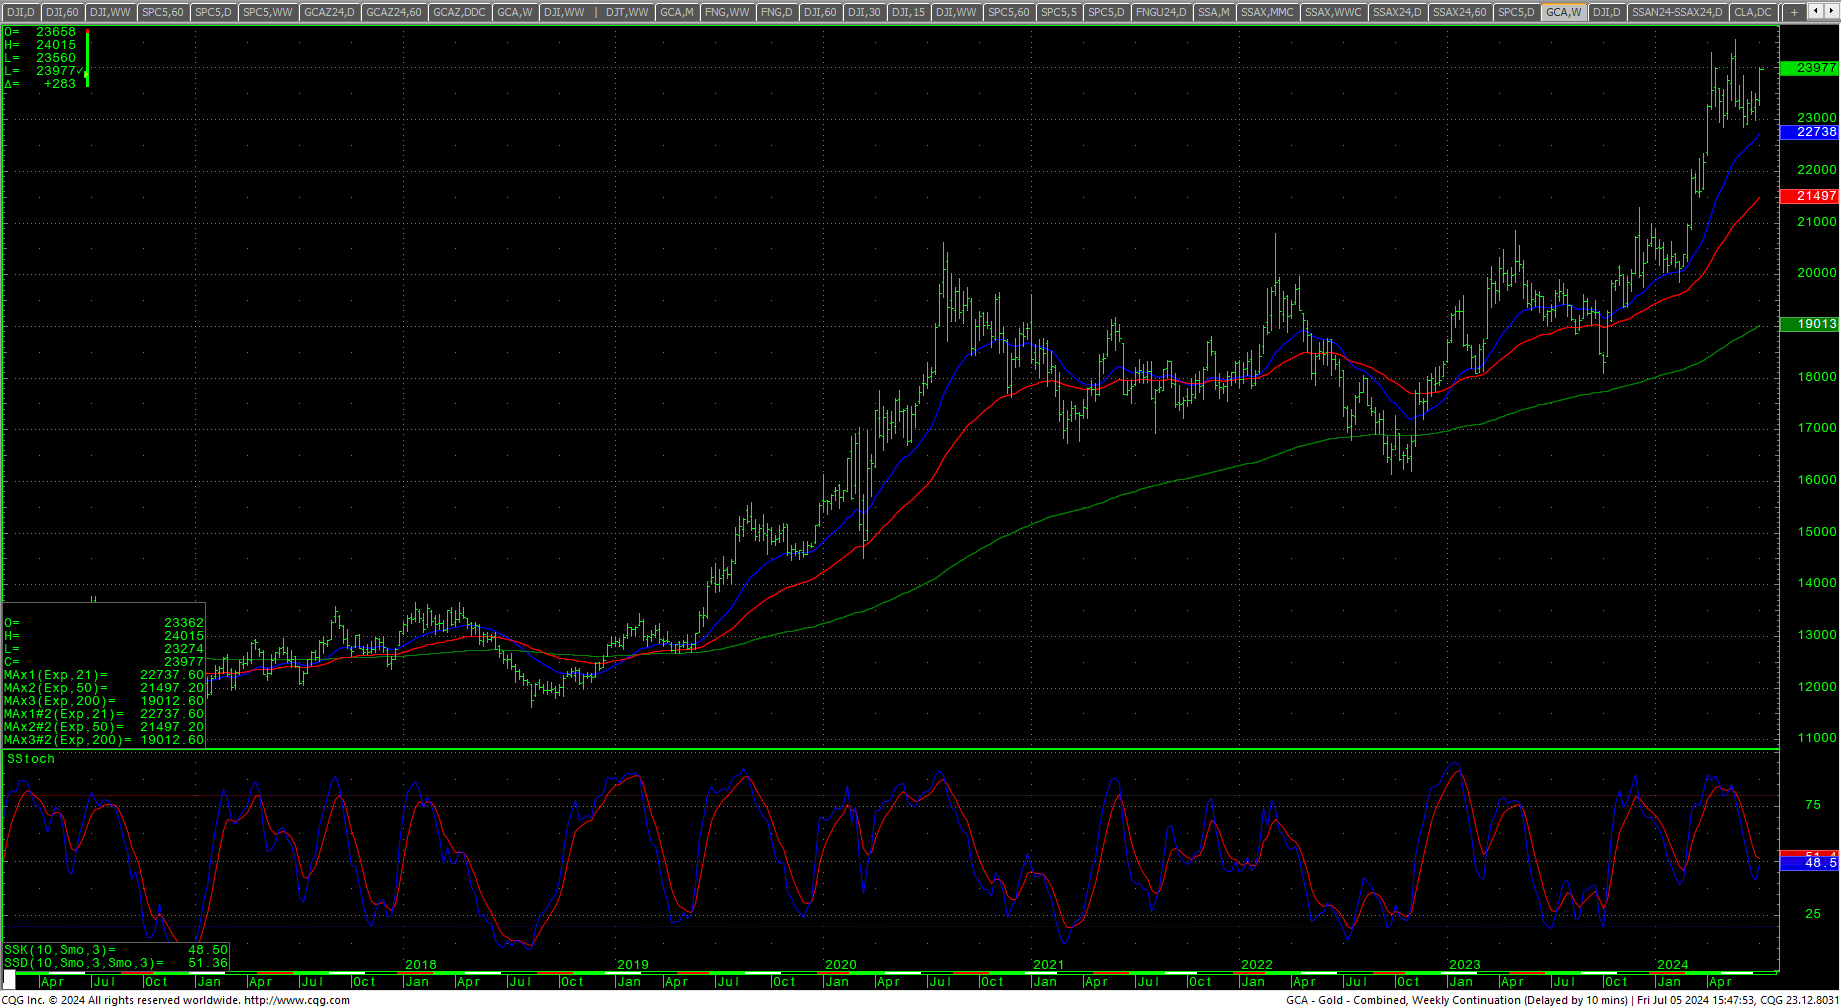
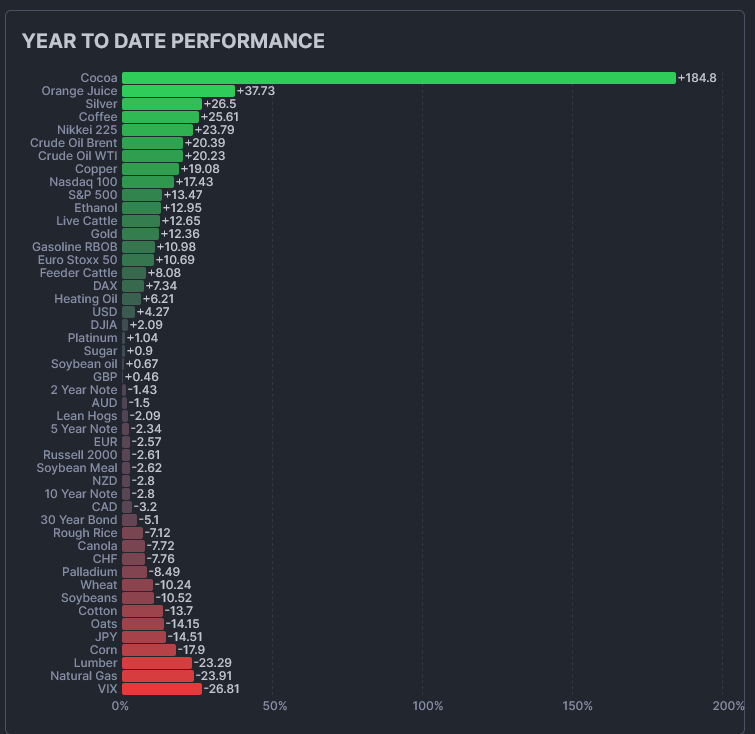 The CRB Index closed the week up +1.02. Crude oil closed at the highest week close since 15 April 2024 in the middle of a tight weekly range. Gold rallied strongly, settling just under the $2400 level on the top of the weekly range at one of the highest closes ever. The CoT for the S&P 500 still shows dealers liquidating, asset managers flattening, but commercials are adding with specs flattening positions. The CFTC S&P 500 Non-Commercial Net Positions looks as though shorts did more covering this past week. The non-commercials position is now back to a two-day window.
Timing Points
Wednesday/Thursday marks strong timing for all the financials and highlights bonds and the dollar.
On Wednesday, Jerome Powell testifies in the US House. Thursday is Core CPI data for June with estimates at +0.1% and YOY of 3.1%. Friday sees PPI data for June with estimates of +0.1%.
- 07/10-11 *** bonds
- 07/22 ***
- 08/02 **
- 08/07 **
Dow Jones Industrial Average Hourly HLC
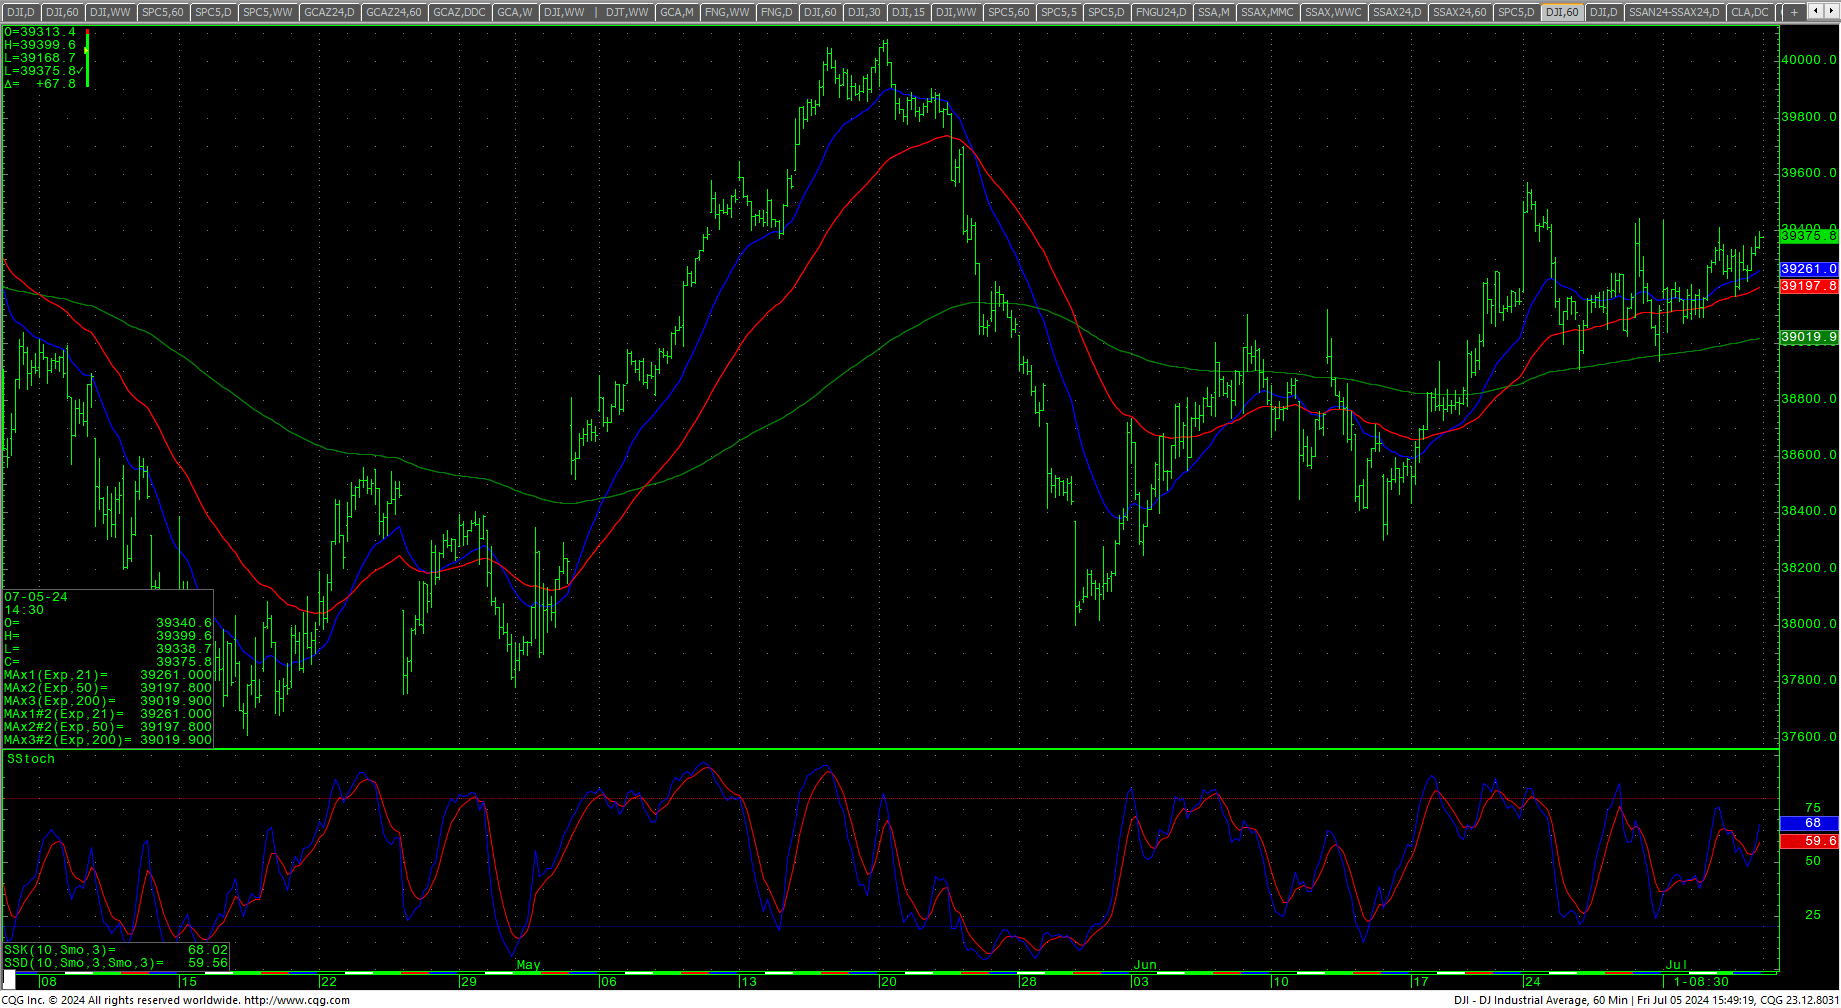 The Dow ended the week up +0.66% on the top of an inside week’s range, staging a bullish reversal on Friday. The daily is still negotiating a double-top pattern and is still in a short-term uptrend as it tests a key overhead trendline (see above). The 21-day MA remains above the 50-day MA. The 200-day MA starts the week at 37602. The hourly chart is neutral on Friday’s close. The action leaves the numbers for the Dow basically the same.
Dow Jones Industrial Average Weekly H-L-C
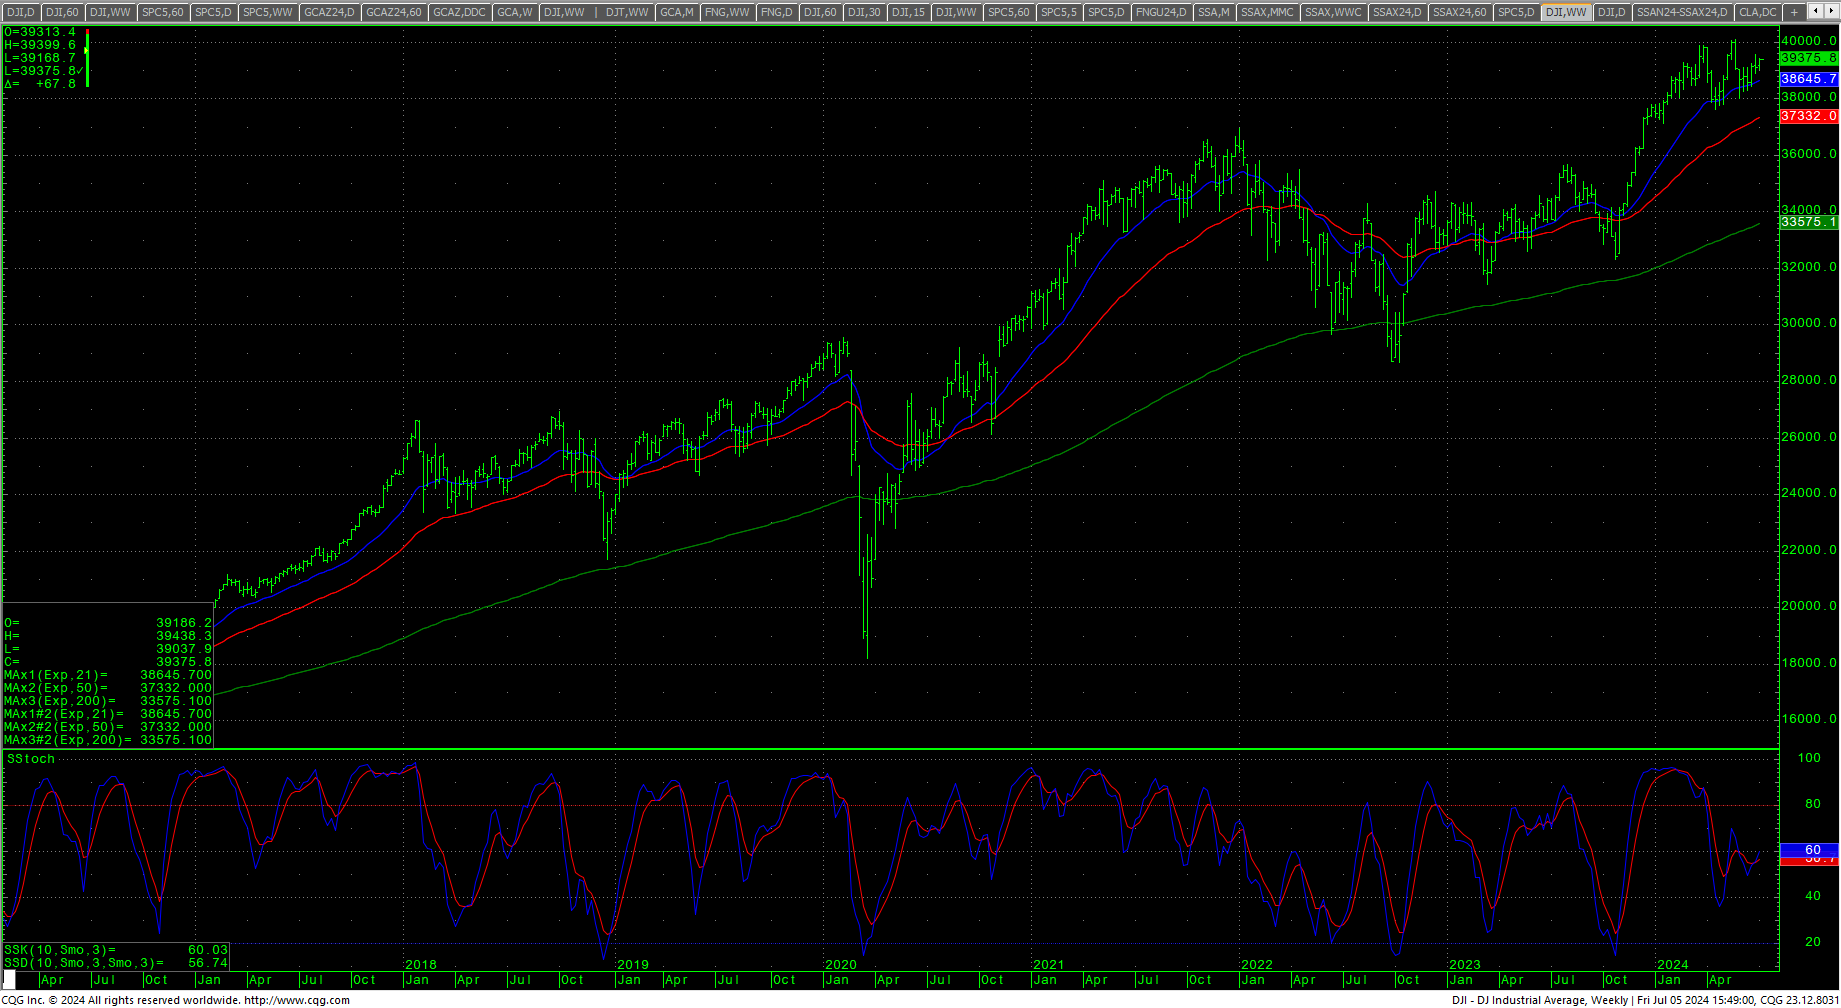 The market remains under last gasp resistance at 39558/39587. Resistance remains pivotal at 39558/39587. A breakout over 39587 suggests a retest of the trading highs 40075/40077. Closes over 40777 renew momentum toward a daily target at 40106.6 and weekly objectives at 40245.4/40250. The 2021 inflation-adjusted highs are 46410 and 46710. Resistance for the Dow is 40106/40107 and 40245/40250. Closes over 40250 will offer counts to 42147. A breakout over the 42147 area opens counts to longer-term potential to monthly targets in the 45244 area. Above 45244 gives monthly counts to 47400.
Support is 39200, 38971, key at 38766 and short-term pivotal at 38600/38595. A drop under 38595 can retest 38422/38418. A breakdown under 38418 suggests 38306 and 38275/38270. Closes under 38270 should retest 38170 and threatens the swing low at 38000. A breakdown under 38000 will open counts back to long-term support between 37814/37775/37754 and 37611. A breakdown with closes under 37611 will open counts to critical support of 37244/37122. Closes under 37122 gives long-term counts toward 35716/35710.
| Resistance | Support |
|
|
S&P 500 Cash Index
S&P 500 Index Hourly HLC
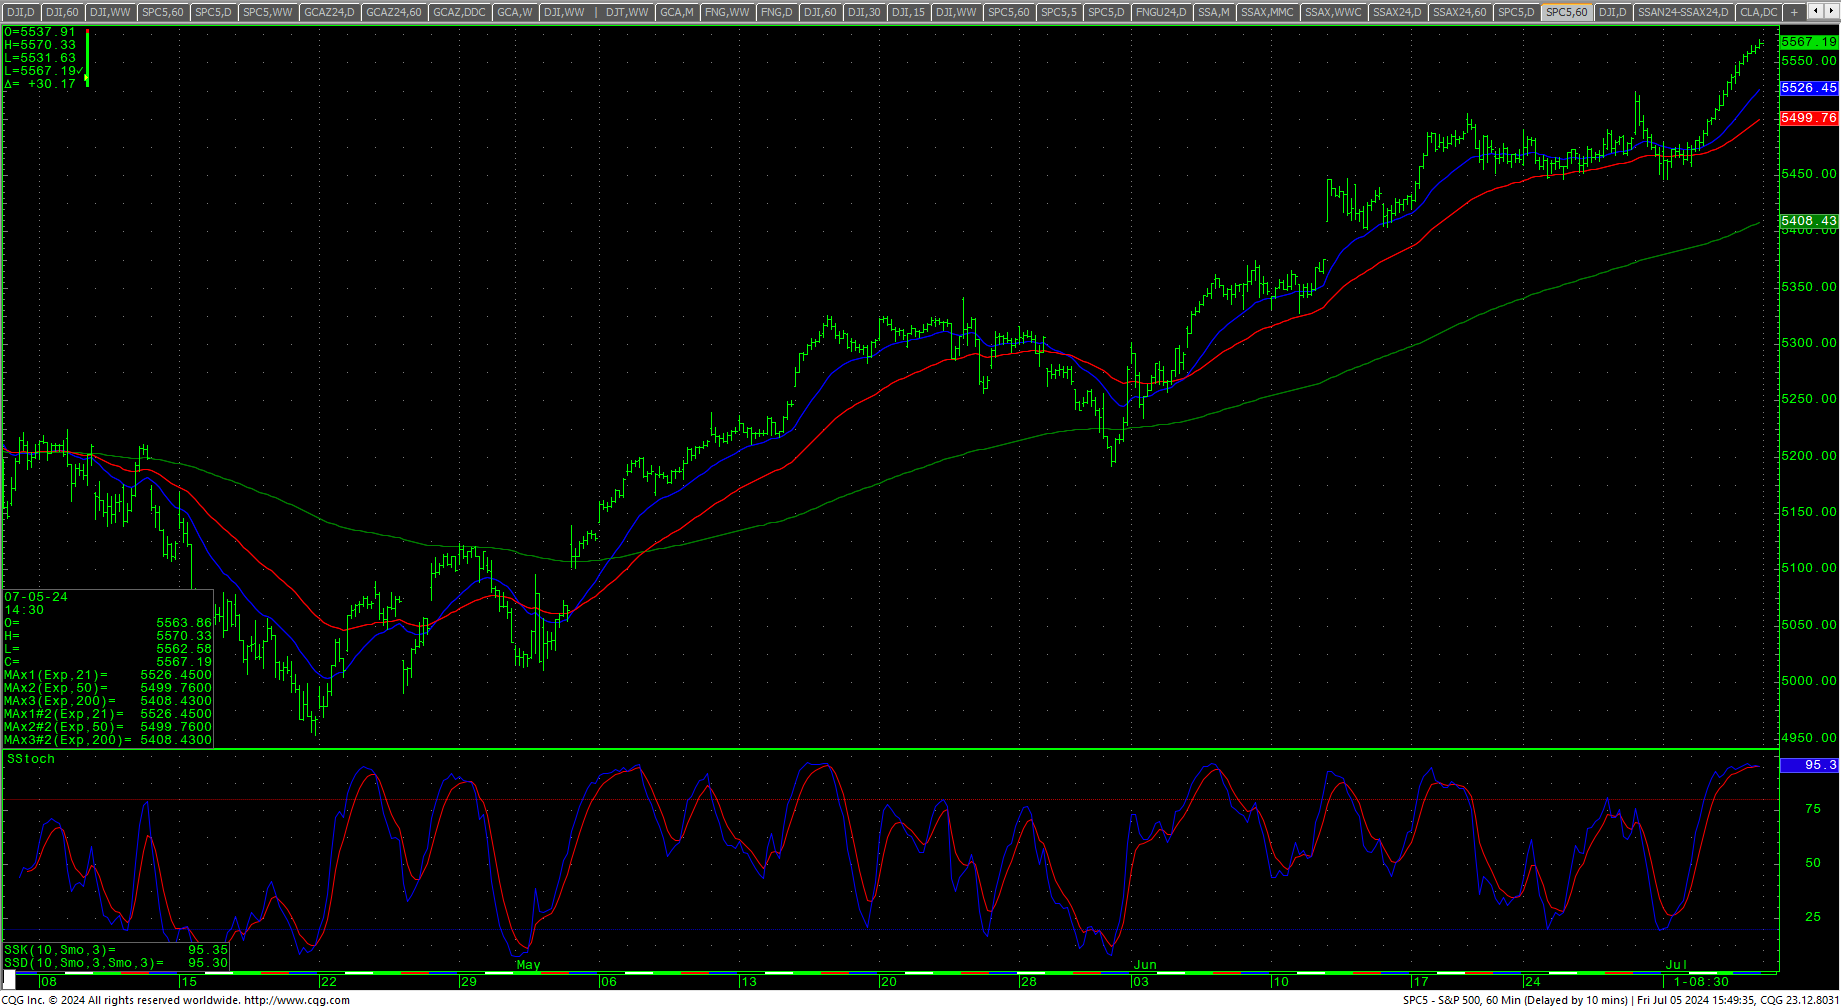 The S&P rallied sharply throughout a light-volume week and closed at a record high, setting an intraday high of 5570.33…just shy of the next key upside objective at 5576. This area is now a critical level for the cash index. The hourly chart is overbought on Friday’s close as the hourly performed a truly impressive 18-hour upmove throughout the week. A breakout with closes over 5576 offers counts to targets at 5720. Closes over 5720 offer counts to 5864 with long-term upside targets at 6000/6008. Above 6008 counts to 6080 with potential to 6152.
S&P 500 Index Weekly HLC
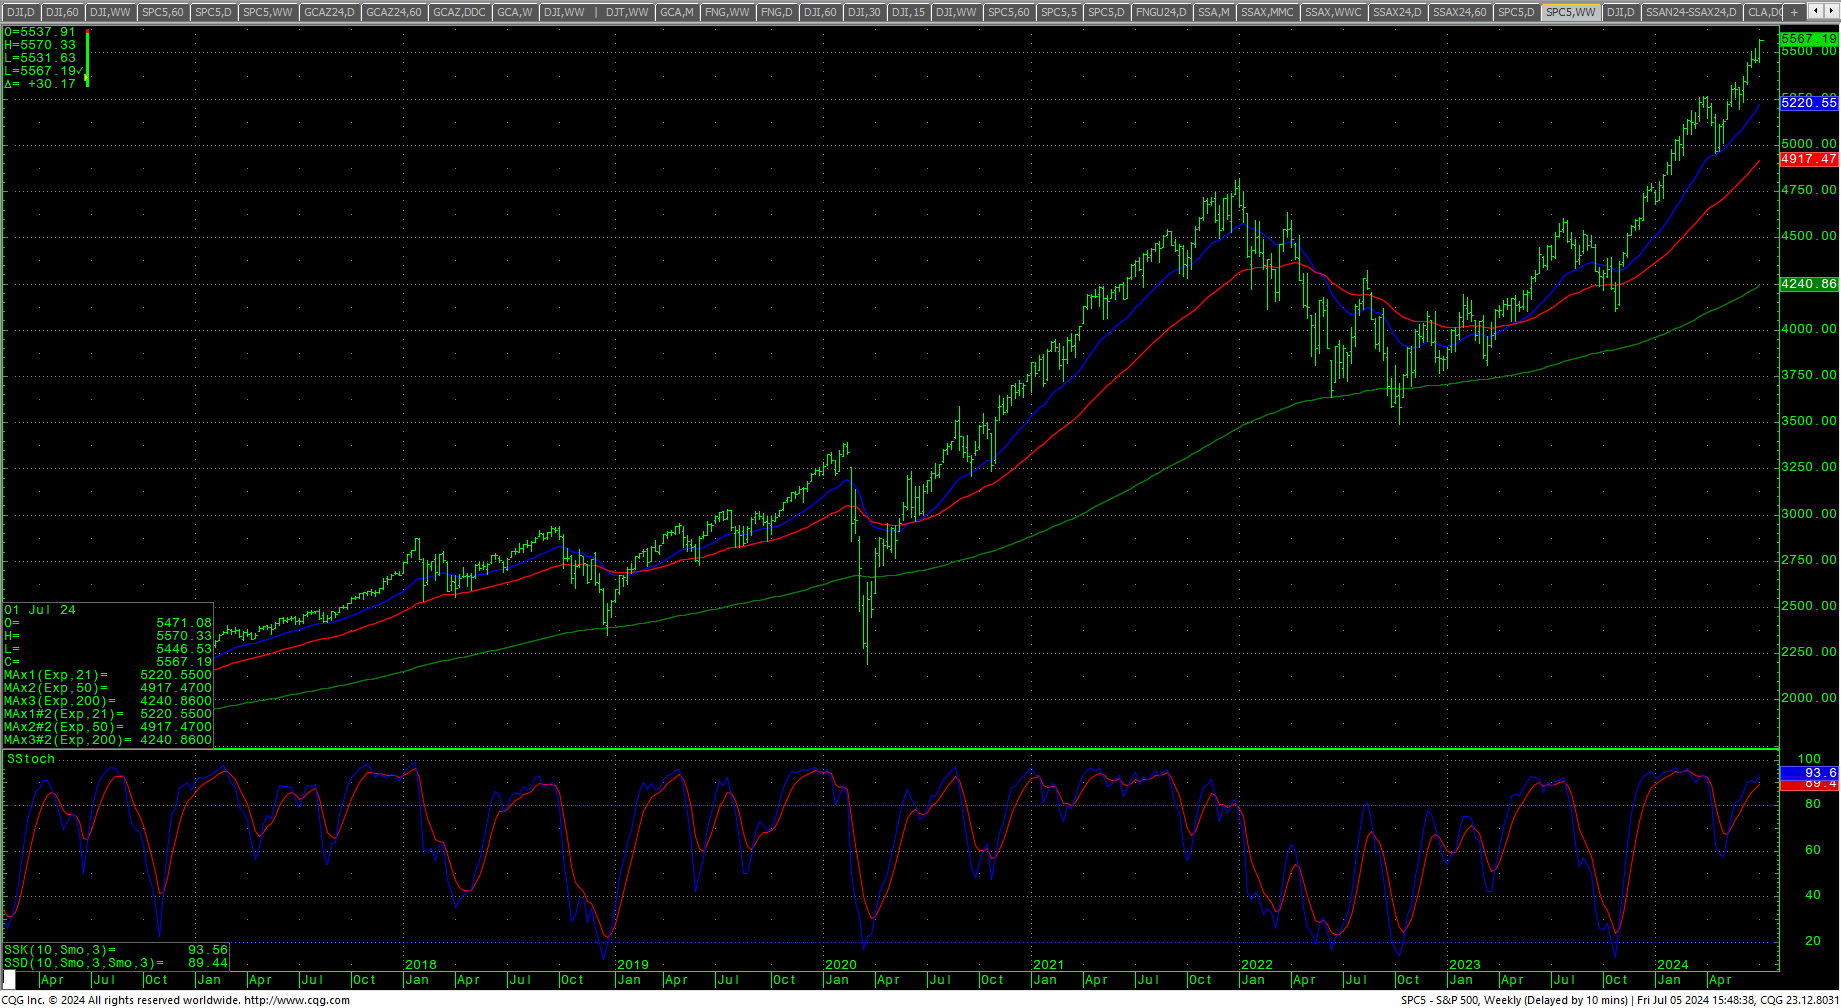 Support, short-term, is 5541 and 5523/5522. Trade back under 5522 opens counts to 5508 and 5493 through 5480. Closes under 5480 opens counts to 5425. A breakdown under 5425 can carry to 5381 with potential to pivotal support at 5336/5333. Daily closes under 5333 can test 5265 with potential to critical near-term support of 5189/5185. Closes under 5185 suggest 5099 with full potential to retest the 4953 area. Closes under 4953 open counts to 4776 and key support at 4714/4700 with potential to critical support of 4625. Closes under 4625 give counts to 4530.
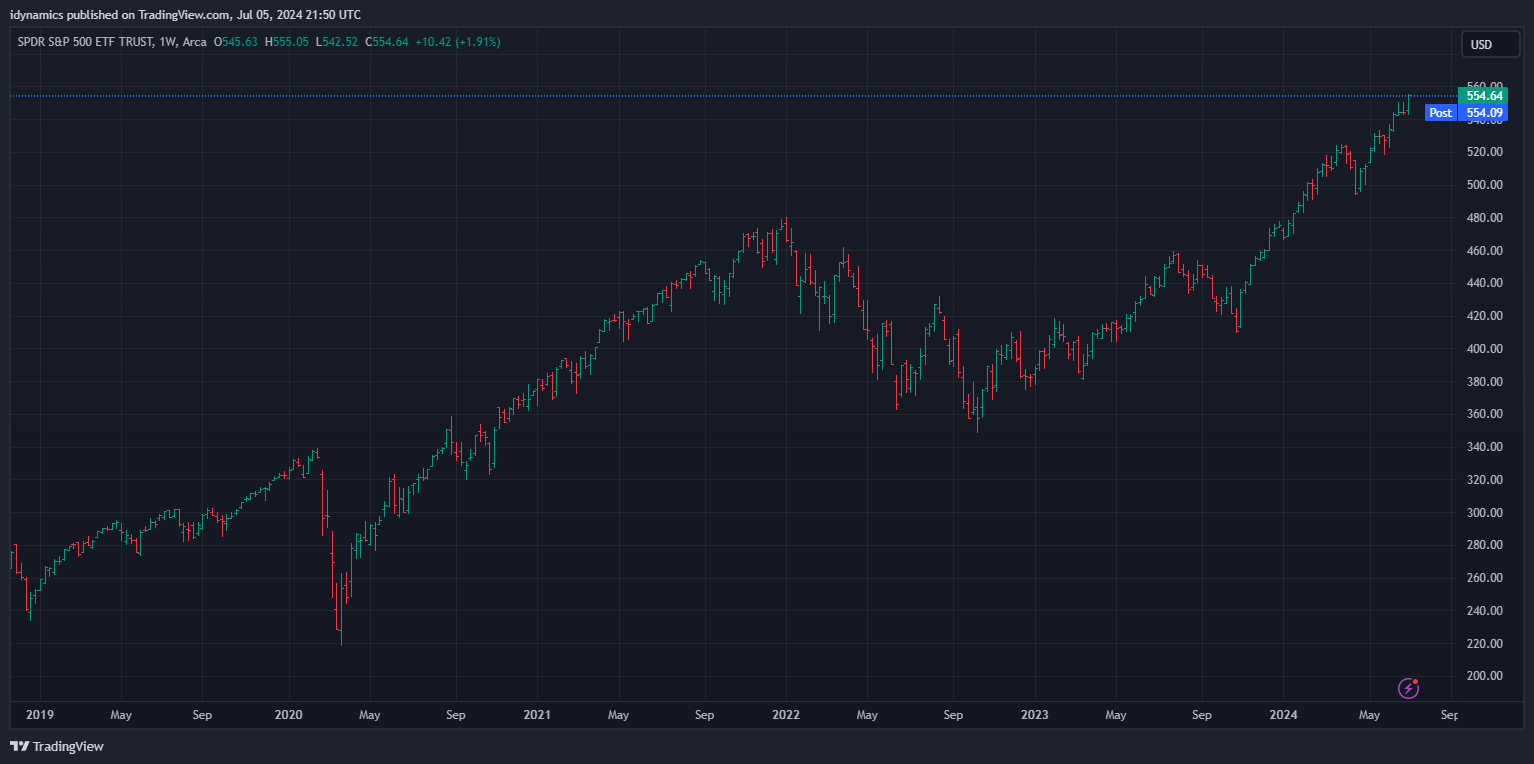
SPY Weekly
| Resistance | Support |
|
|
Charts courtesy of CQG, Inc., CNN, Koyfin, Trading View and AAII