
Week of March 28, 2025
VIX WEEKLY
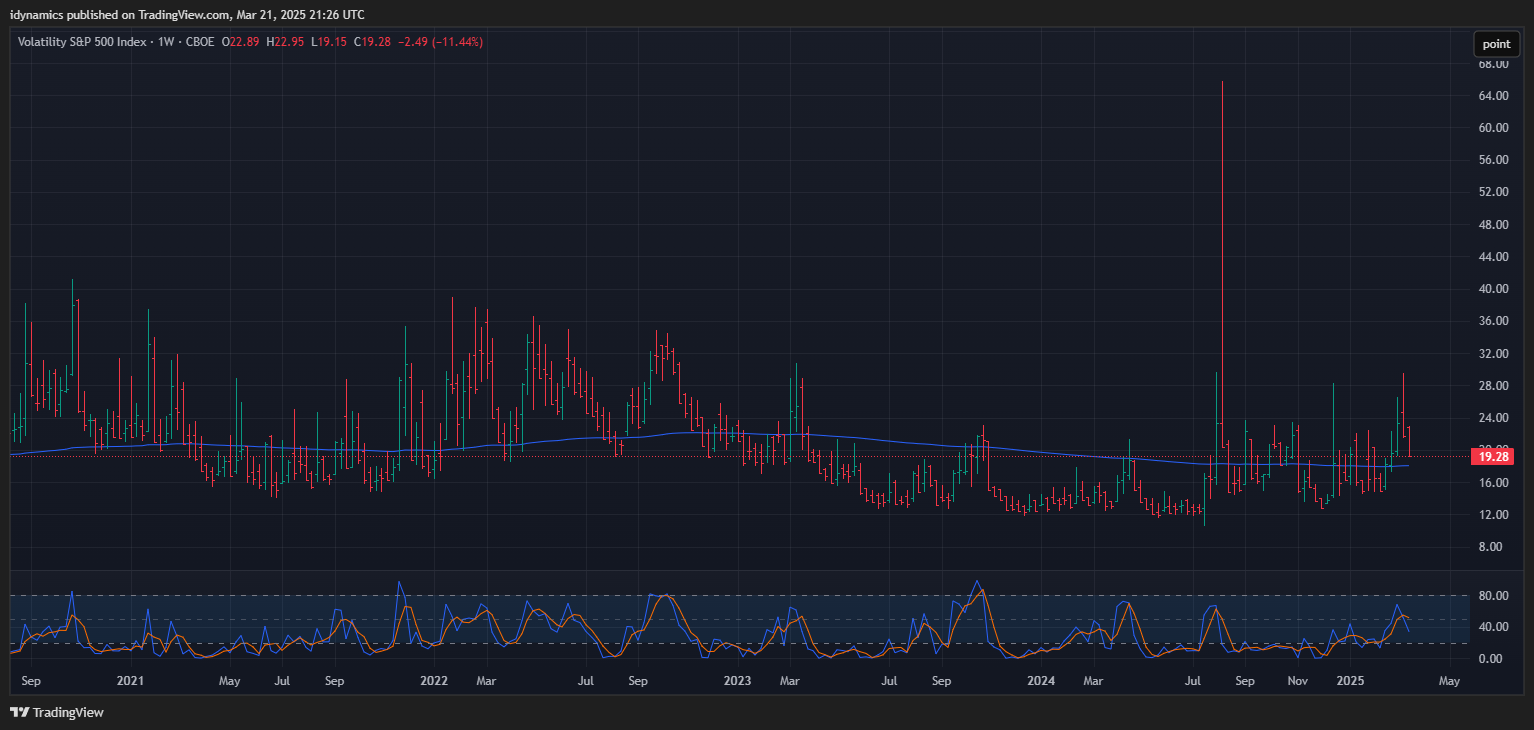 This is the fourth installment in these short-term timing updates with the notice that next week could be another extremely key timing point as we have EXTREMLY CRITICAL TIMING on the 27th and 28th. The focus is next on March 27-28 where we could see some expanded ranges and volatility.
From previous updates:
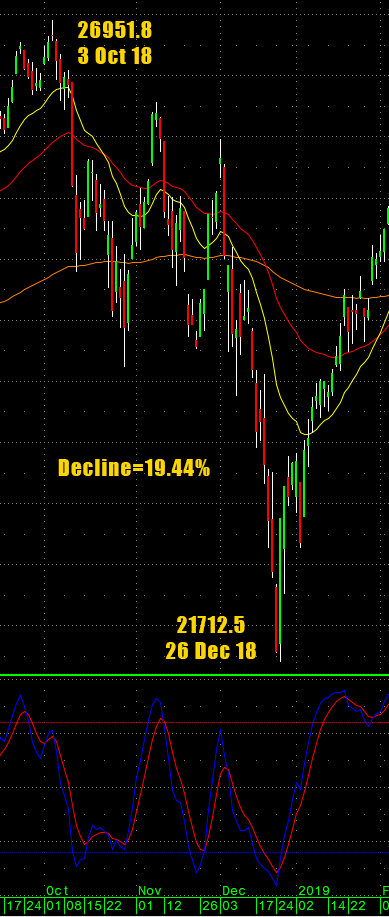
“If you were following along in early February, we pointed out that the week of February 21 was critical and a counter-move could begin in that critical timing.” “The high for the SPX futures basis the March contract SPAH, was set on February 19th at 6166.50.”: “…we indicated that this starts a time window that runs through the early part of May 2025 and closely resembles a pattern in late 2018 where the Dow lost -19.44%. If we follow this pattern the month of March could be seriously rough sailing for the stock market.”
Dow Jones Late 2018 Window
 Now, we need to be realistic. For Q1 2025, the Dow is only down -1.33% at this moment. Sentiment numbers have most analysts proclaiming that “the correction is over” as the -10%/-11% (SPX and futures) decline meets all the requirements for a shakeout in an overvalued market. It is hard to argue that 80% bears versus 20% bulls is not an historic level of negative sentiment. In addition, tech stocks and secondaries have been crushed with the FANG down -14% from its highs and the Russell down almost -16% with the Nasdaq down -11%/-12% from its ATH. Those analysts may be correct and stocks might be oversold here. April has the potential to prove this theory wrong.
AAII Investor Sentiment Survey
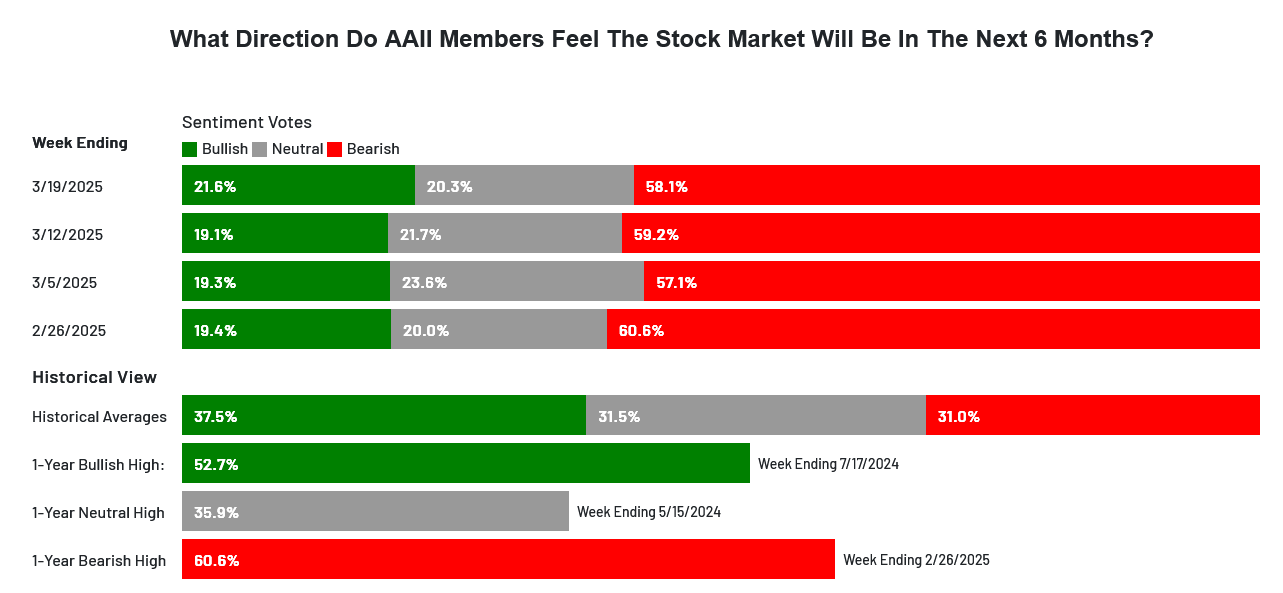 The latest AAII came in at 58% bears to 22% bulls with the remaining 20% neutral. Readings like this have not been seen since 2009. But this timing window is far from over, it runs minimally into early May and if that does not end the move there is a very strong probability of this running into late July early August. Things can be choppy and, we need to consider the fact that we might be on the edge of “The Big One,” or at least “A Big One.”
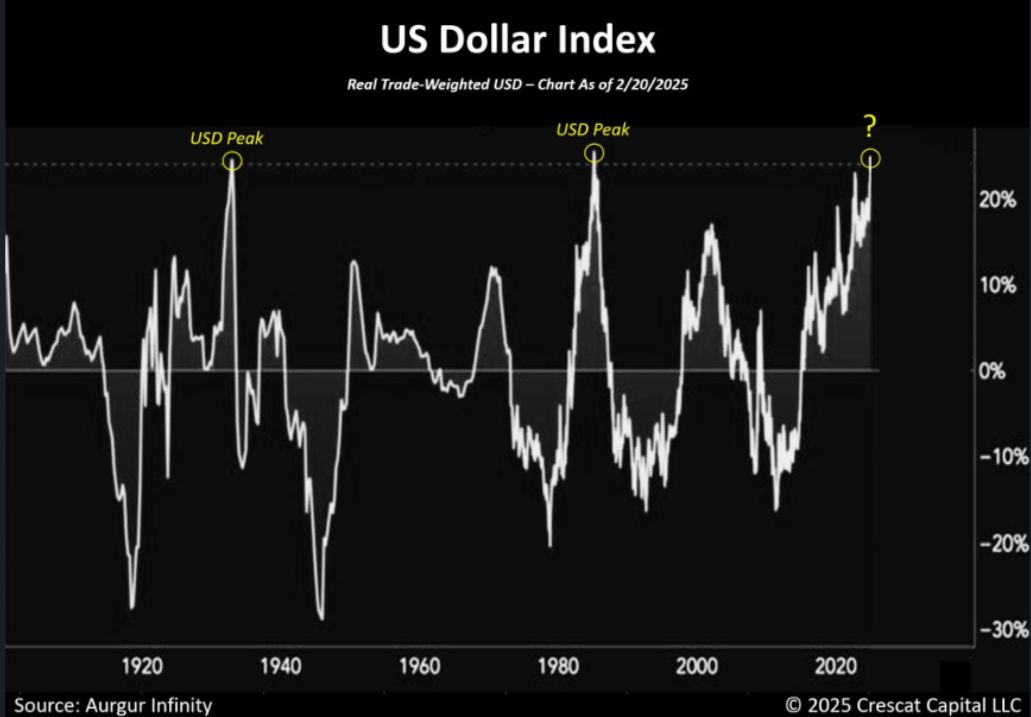 One of the biggest strikes against the market is the Trade Weighted Value of the U.S. Dollar. The second is the over-leveraged trade in retail. Retail has been rewarded over the past two years by buying the dips. That said, consumer debt is at $1.2+ trillion and average interest is running at 22-23% while Average Weekly Hours Worked have declined during this same two-year period. Meaning, pedestrian consumers are stretched thin.
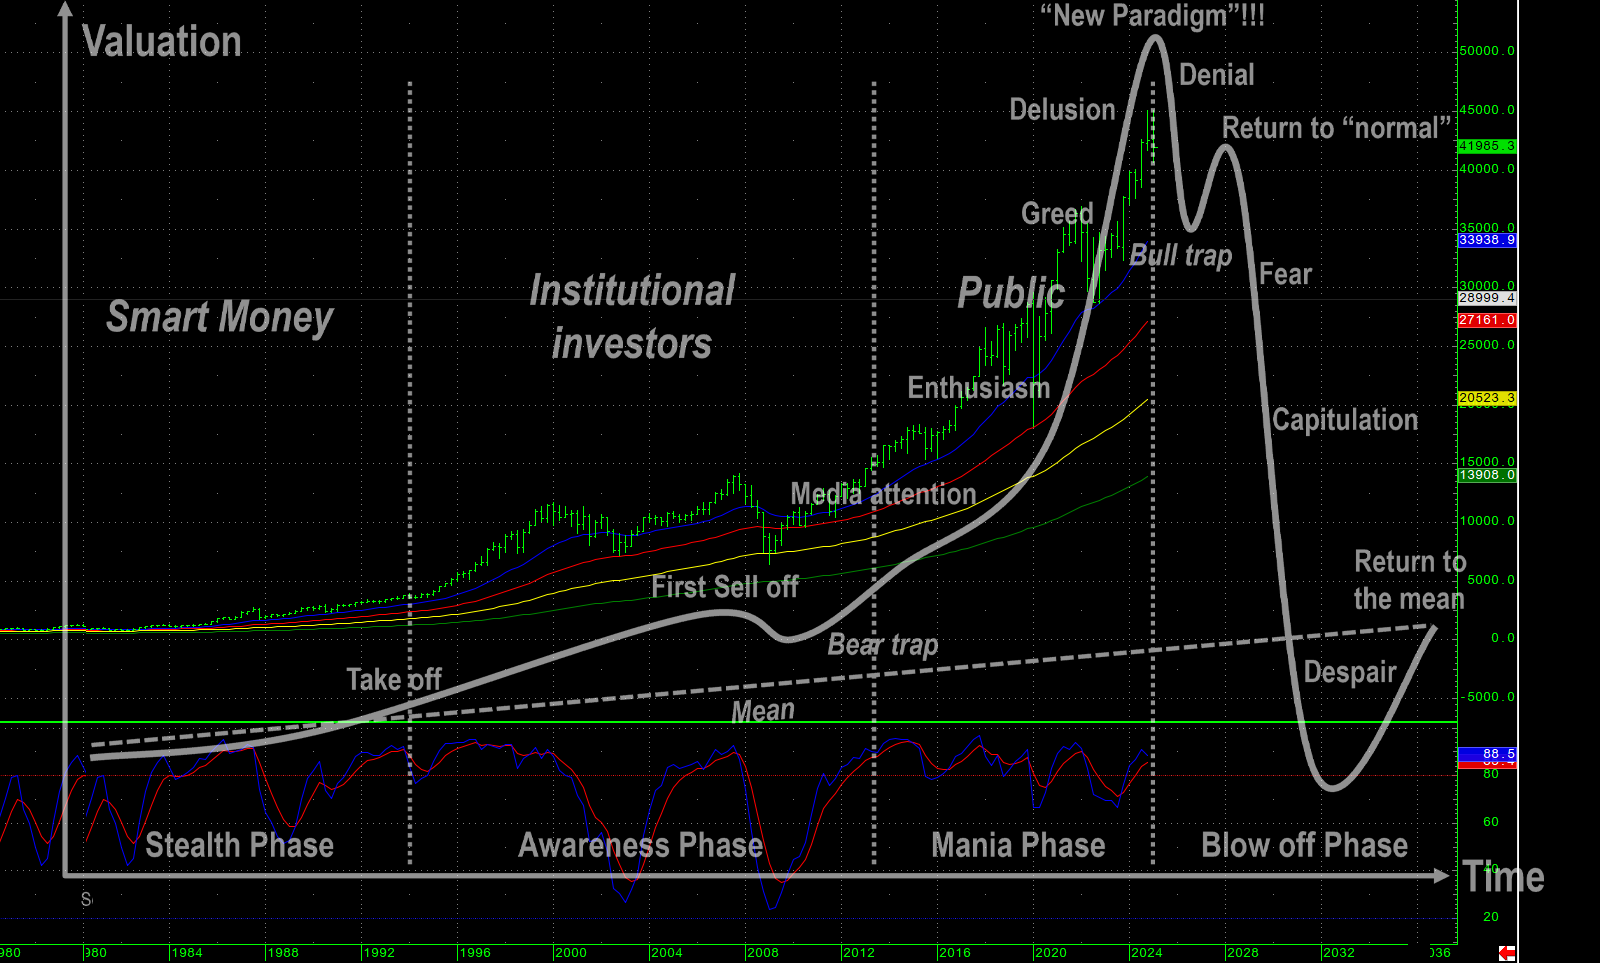
If we are potentially in the beginning of a bear market and the end of a mania, this phase is called “Denial.” The cycle then goes to a “Return to Normal.” This then gives way to “Fear.” So, while the sentiment indicators are showing fear, price action is anything but. From an extremely long-term perspective, we may be ending 40 years of Neoliberalism and entering a “Technoliberalism” that focuses on technology as the driver. This may be a given with AI and AGI. Certainly the political arena is pulling in this direction. How successful it might be is a huge unknown. Reality may be dictated by crypto.
Anatomy of a Mania?
 April Showers?
Again, this current window does not end until early May and could run into mid-Summer, late July to early August. While the energy shifts a bit coming out of March, April has the potential to be much more aggressive. Conflict is a keyword, how it plays out needs to be seen. I would not rule out a Black Swan in April, something that confirms the long-term trends and takes participants by storm. The weekend of April 19-20 is key with the 21st as the next ultra critical timing point.
Timing Dates for March/April
- 03/27-28 *** X critical week with potential for increased ranges/volatility
- 04/07 **
- 04/12 **
- 04/21 *** X critical
SPM5 Futures Daily Continuation H-L-C
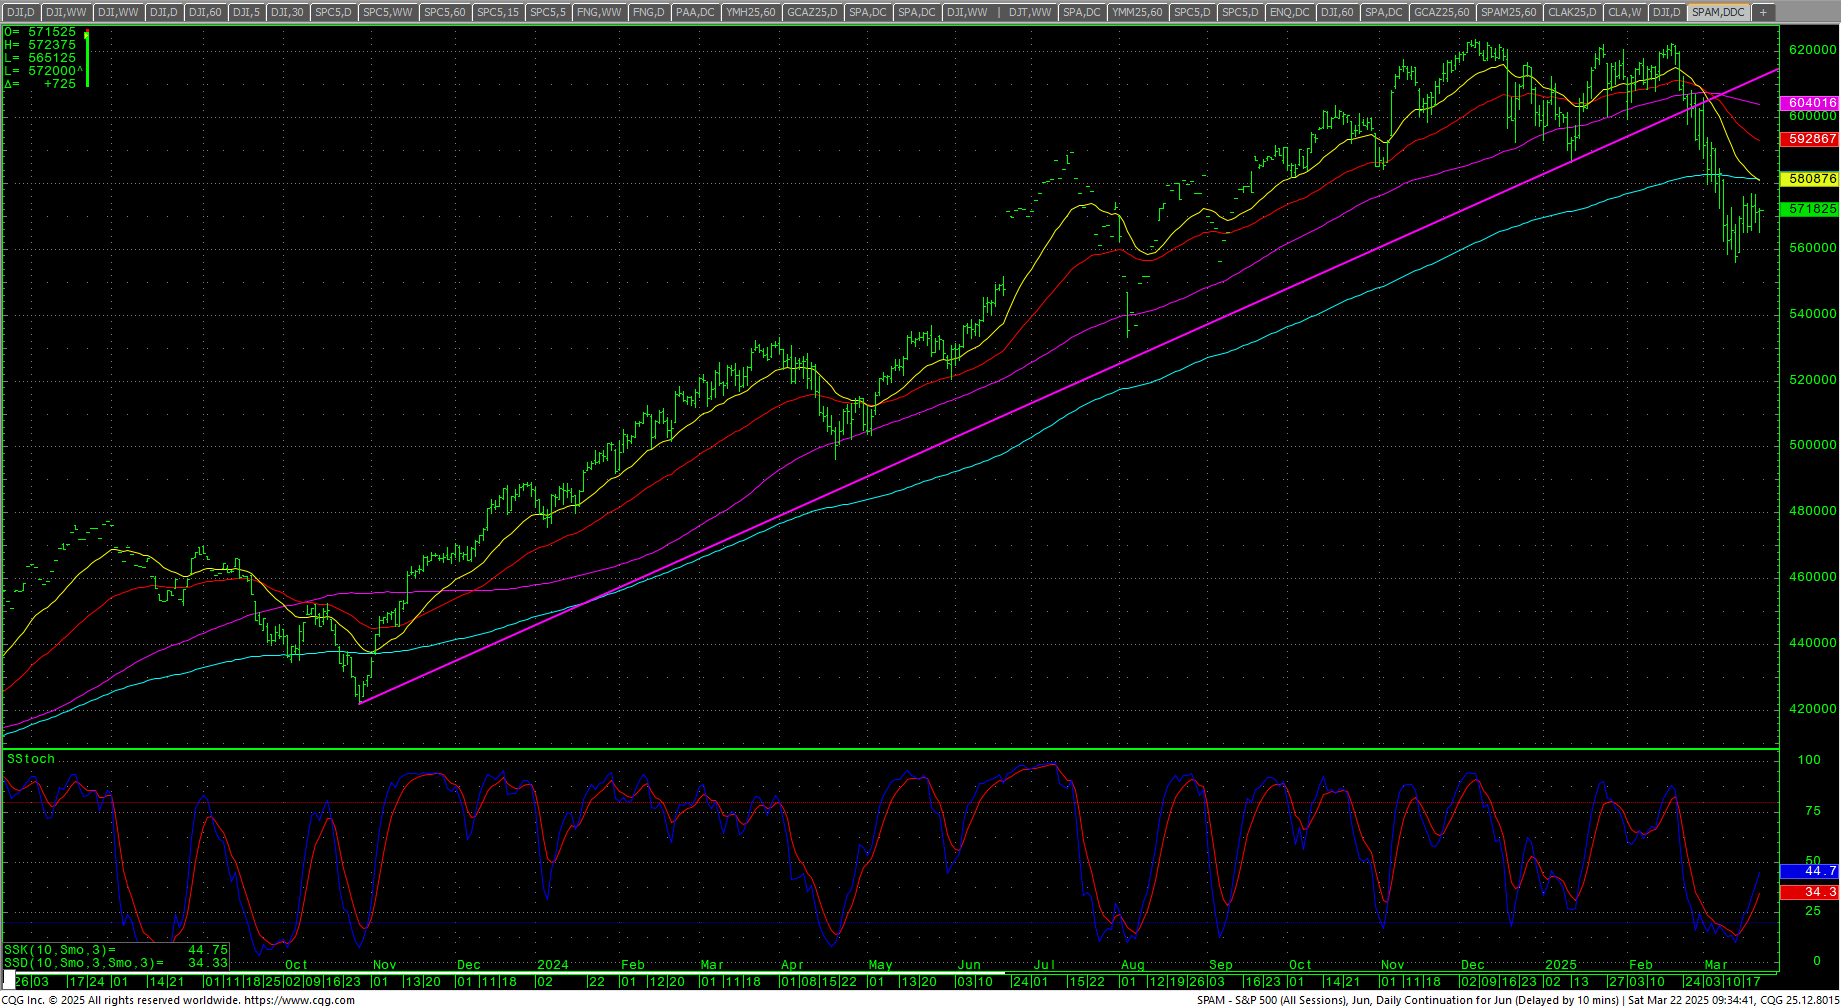 March futures left the board on Friday and June is now the lead month for SPX futures (SPM5). June ended the Triple Witching at a 55.75 premium to the March so the spot chart, depending on the charting system, will need to take into consideration the spread.
For this update, we will focus on SPM5. The daily stochastics have turned up and the MACD is reaching oversold conditions. The RSI got back above 40 late last week which is a good sign near-term. Prices remain below the 200-day MA as they build a flagging pattern off to the side of the recent decline.
The intraday high for SPM5 was set on 6 December 2024 at 6235.00. The closing high was set on 4 December 2024 at 6227.25. The current closing low for the decline was set at 5578.25 on 13 March 2025 and the intraday low was set the same day at 5559.75. The total decline thus far has been -11%.
SPM5 Futures Hourly Continuation H-L-C
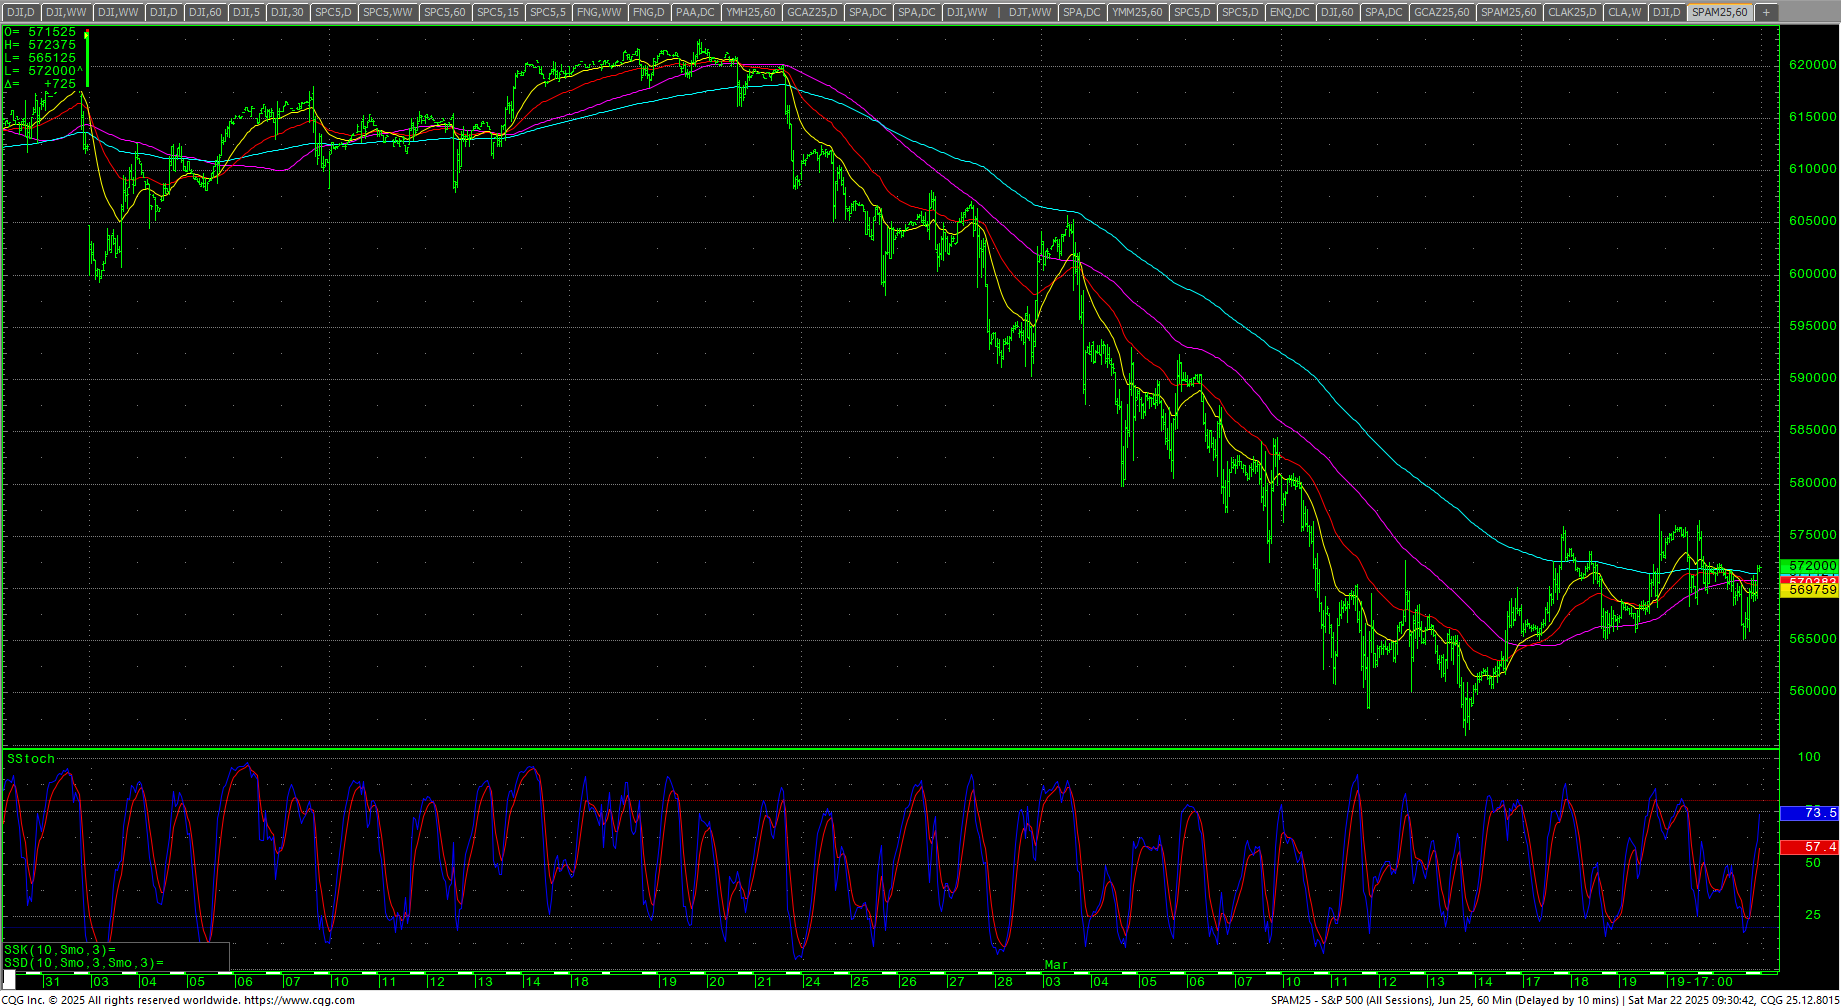 Support for spot SPM5 futures is 5690.00, 5665.10 and pivotal at 5640.25/5639.00. A breakdown under 5639 minimally tests 5612.40/5609.45. Under 5609.45 should retest the 5559.75 swing lows with SPM5 support at 5599.25. Closes under 5559.75 opens counts for a test of critical support at the spot swing low of 5509.25 with support at 5520/5518. Closes under 5509.25 will open counts to 5464.70/5449.30 and ultimately to a band of intermediate-term support that runs from 5394 through 5385.60 and 5366.95.
Resistance is currently key in a band from 5749.70 through 5768.60 with an hourly swing high at 5770.05. Rallies through 5770.05 will open counts to the next band at 5808.40 to 5814.00. Closes over 5814 are near-term friendly and setup a test of pivotal resistance at 5867.50/5869.00. A move above 5869.00 opens counts to 5892.50 with full potential to critical resistance at 5970.75/5973.00 with trading resistance at 5932.50 and 5939.25. Closes over 5973.00 minimally suggest a move to 6058.70 to 6068.00 with potential for a retest of the highs at 6235.00.