
TECHNICAL ANALYSIS (by Intraday Dynamics)
Knives Out?
Now that we are in the critical month of March, I wanted to update on the timing as we are right now in a big window and next weeks marks EXTREMLY CRITICAL TIMING on the 11th and 12th.
Reiterating: “If you were following along in early February, we pointed out that the week of February 21 was critical and a counter-move could begin in that critical timing.”
The high for the SPX futures basis the March contract SPAH, was set on February 19th at 6166.50.
Prices have seen some extreme volatility the past two sessions as the Tariff Tantrums continued to shake the markets. With this window running through Wednesday, expect the volatility to continue here.
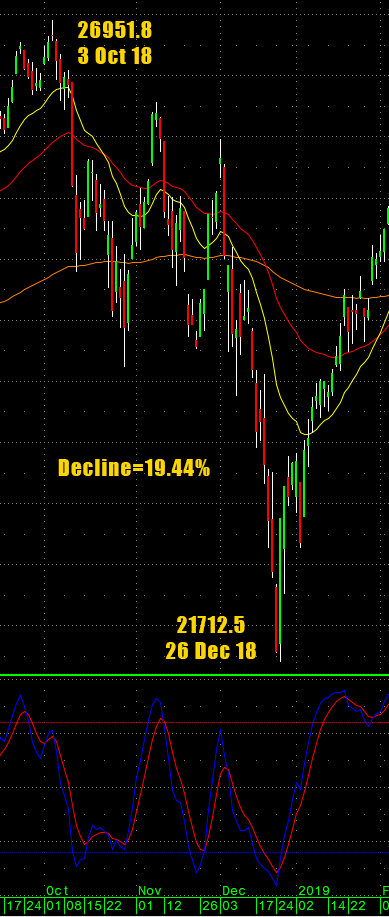
From the update last week: “…we indicated that this starts a time window that runs through the early part of May 2025 and closely resembles a pattern in late 2018 where the Dow lost -19.44%. If we follow this pattern the month of March could be seriously rough sailing for the stock market.”
Dow Jones Late 2018 Window
The focus is next on March 11-12 where we could see some fireworks. Expect to see at least one day next week where there is a very large range and/or net change.
Timing Dates for March
- 03/03-05 *** X critical
- 03/11-12 *** X critical high volatility/wide ranges
- 03/21 *** X
- 03/27-28 *** X critical
SPX Spot Futures Daily Continuation H-L-C
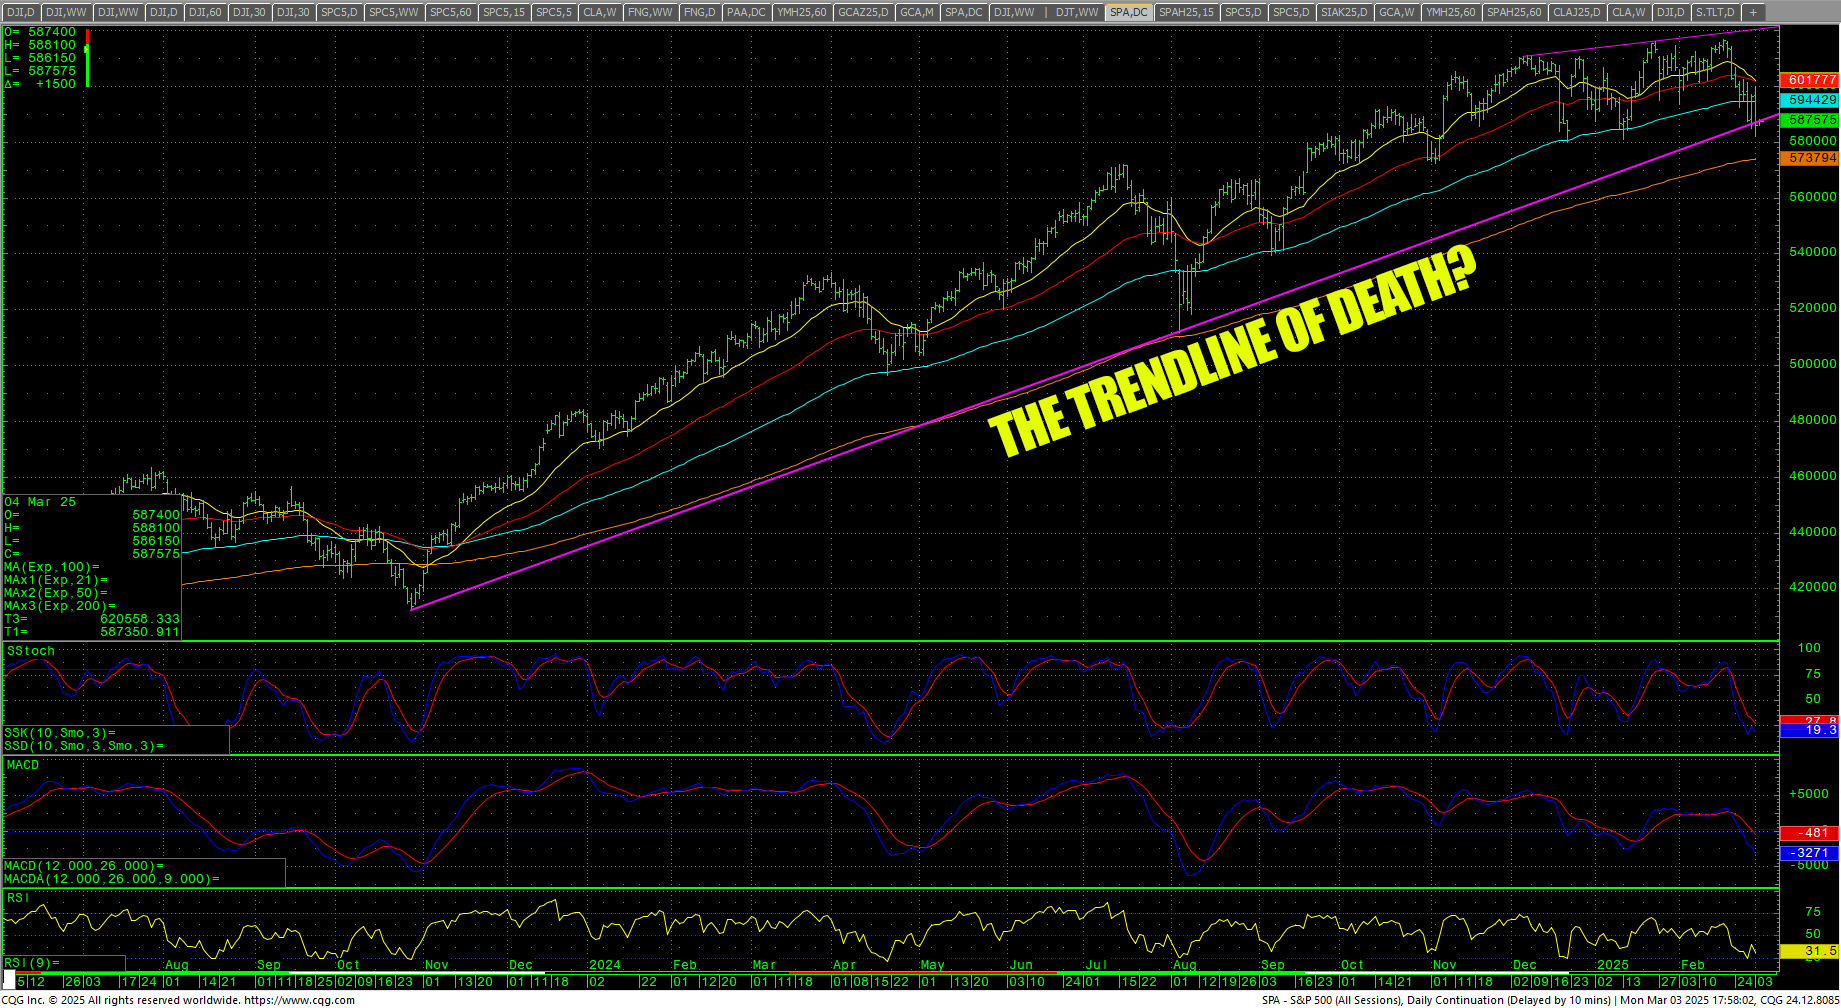 As of tonight, March futures are up following Monday’s wide outside day down. SPAH closed Monday under “the trendline which should not be broken on the daily continuation chart. The technical picture is negative with the MACD and RSI in sell mode. Prices are trading under the 100-day MA.
S&P 500 Stocks Under the 200-day MA
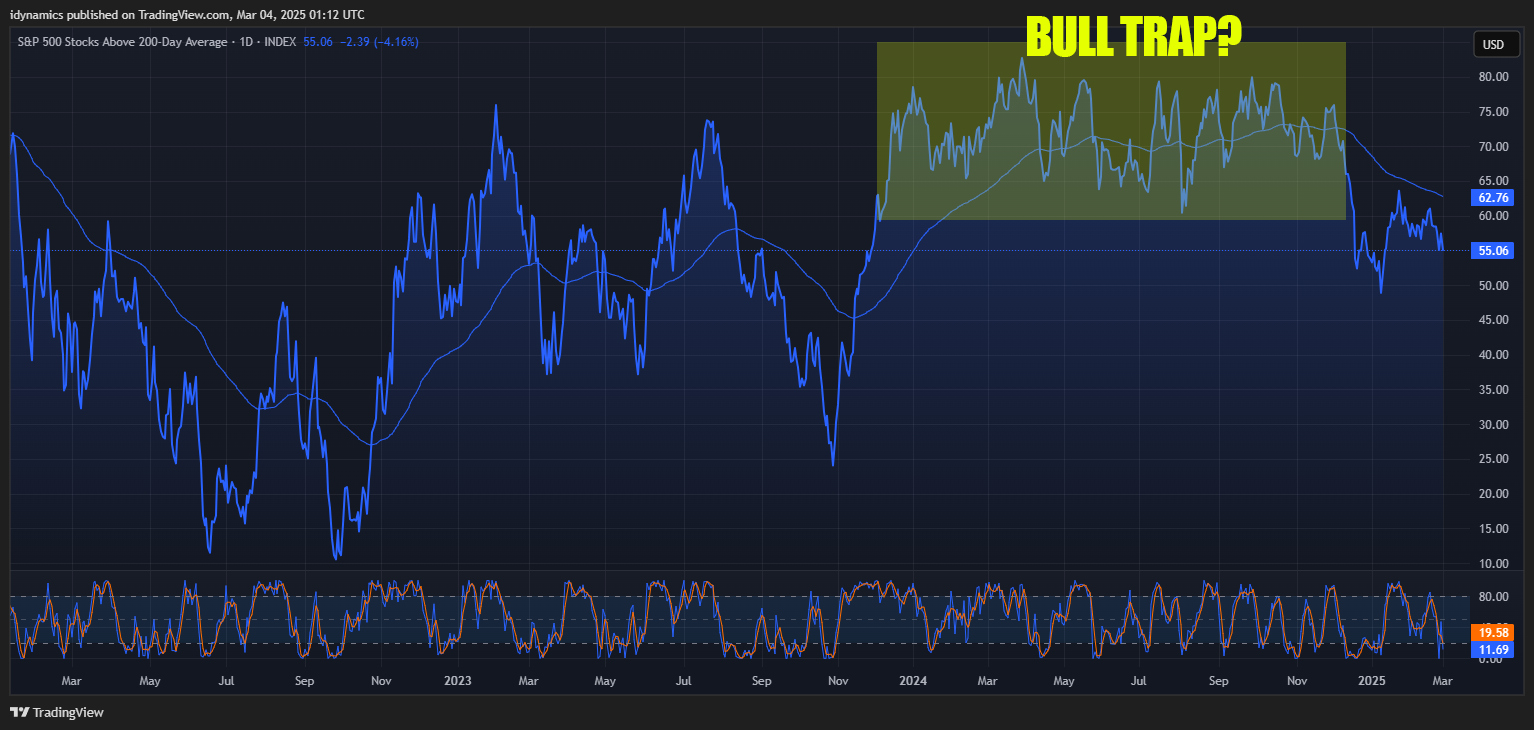 Something pointed out in the weekend update, the percentage of SPX stocks under the 200-day MA is showing an anemic market with a potential (massive) bull trap. The period from January 20, 2025, through late February was one of the largest retail periods historically, which means weak handed retail investors have piled in to the market over the past month plus.
VIX Daily Close
 SKEW Daily Close
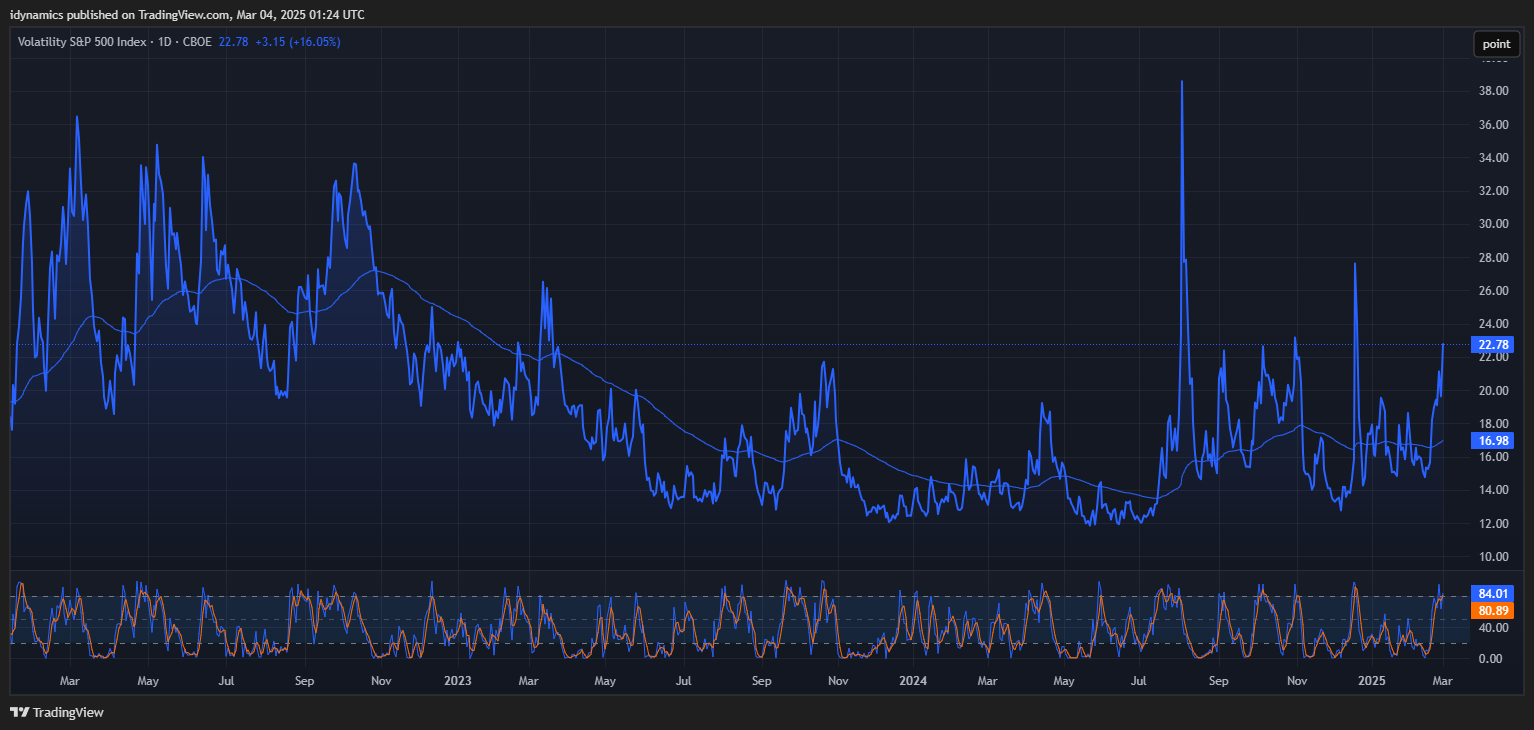
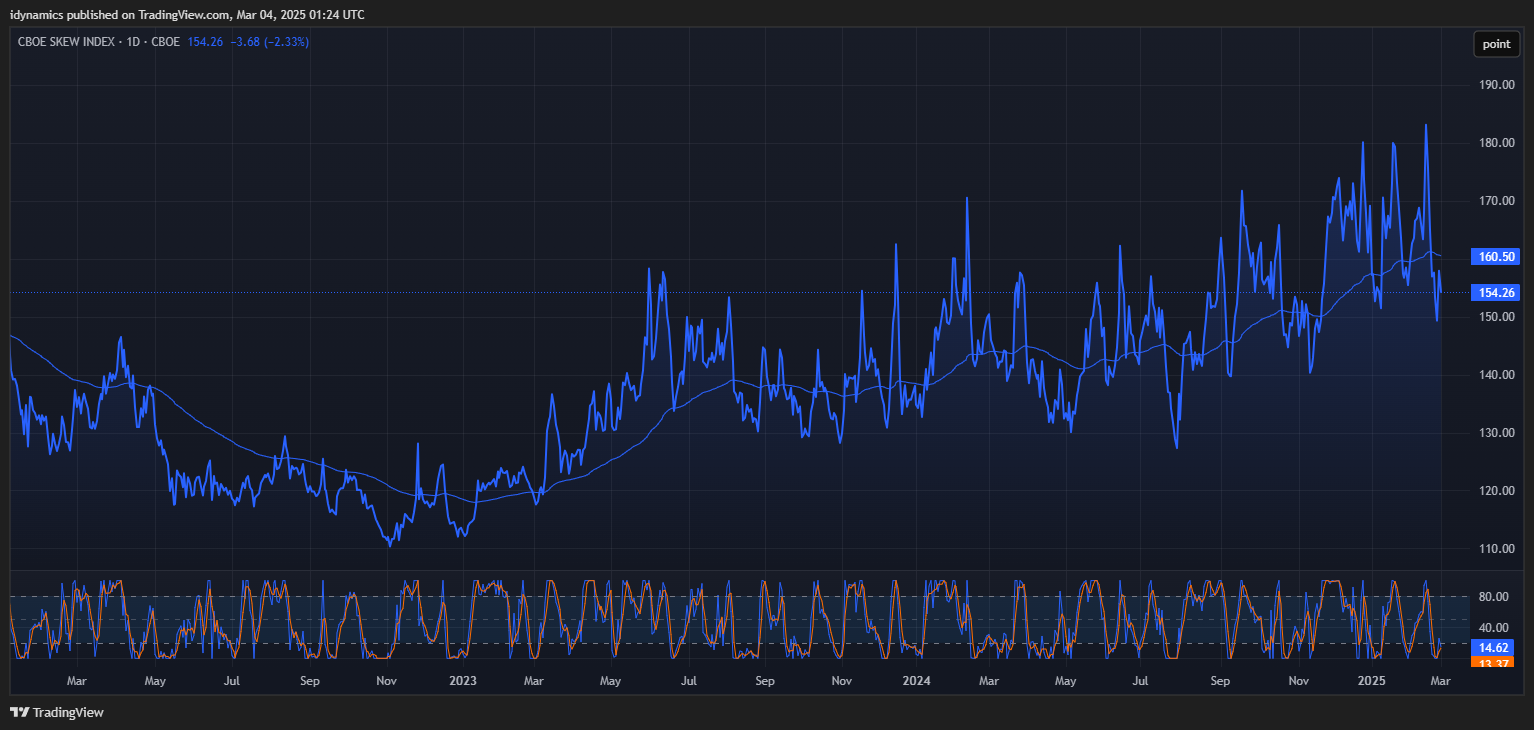 Now, it is important to point out that the sentiment is sharply leaning into fear with the AAII bull/bear reading at an extreme of 80/20, four to one bears to bulls. The SKEW has cooled off with the recent breakdown and the VIX heated up a bit with Monday’s trade. If the market is about to go into a fitful-type selloff, you can throw the sentiment indicators out the window and just go with the trend.
Support for the SPAH is 5821.75, 5809.00 and 5800.75 (20 December 2024 low). A breakdown under 5800.75 should minimally test 5766.70. The November 2024 low is ultra-critical for systems traders, and it comes in at 5727.00/5724.25. A breakdown under 5724.25 is bearish to 5643.25 with counts into critical support of 5519.75/5518.00. Closes under 5518.00 count to 5381.60/5366.95 with full potential to 5120.00.
Resistance is at 5890.00/5896.85. A drive above 5896.85 sets up 5911.15 with potential to 5932.20/5933.00. Closes over 5933.00 minimally count to 5953.45. A breakout through 5953.45 should test 5994.15 with potential to pivotal short-term resistance at 6034.80/6036.00. Closes over 6036.00 should minimally test 6080.30/6085.15. Closes over 6085.15 sets up a retest of the highs at 6160.00/6166.50.