
TECHNICAL ANALYSIS
The DJIA spent the entire week in negative territory, closing down 2.77% or 953.4 points. The hourly chart is showing a rounded top formation as prices react to frothy sentiment the past two weeks and a cacophony of negative headlines coming from America’s major ‘corporations.’ Prices ended at the bottom of the weekly range in a bearish candle that took the DJIA back to four week lows. If the short-term charts ‘rounded top’ plays out, then lower prices are in the immediate future
Dow Jones Industrial Average Hourly HLC
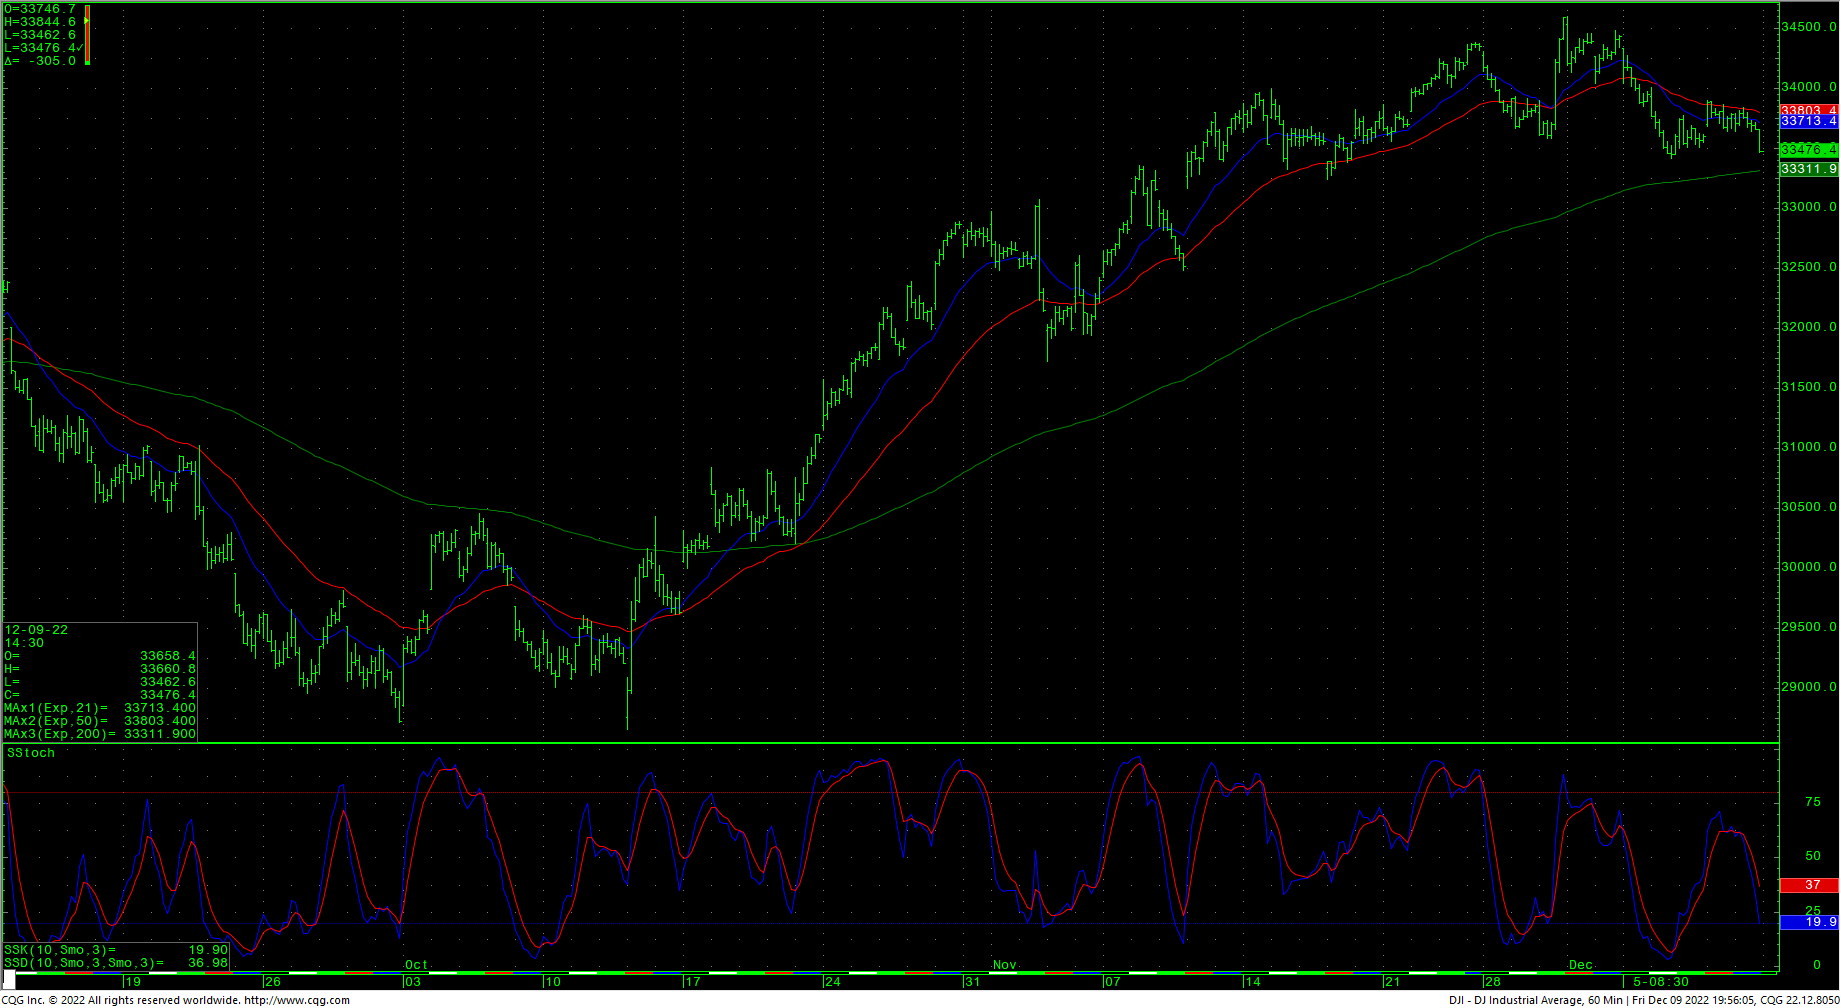
Support is 33418 and a breakdown under this week’s lows should carry to pivotal short-term support at 33190/33158. (Note that a potential downside target can be calculated to 32241.) The 33158 area represents the last major wave lows on the hourly and the start of a gap area and that gap runs all the way to 32627. Support is short-term critical at 32820/32800. Closes under 32800 set up the 32627 gap with counts to 32442 and possibly 32324. A breakdown under 32324 opens counts to the target of 32241…then 32099 with longer-term potential to 31727.
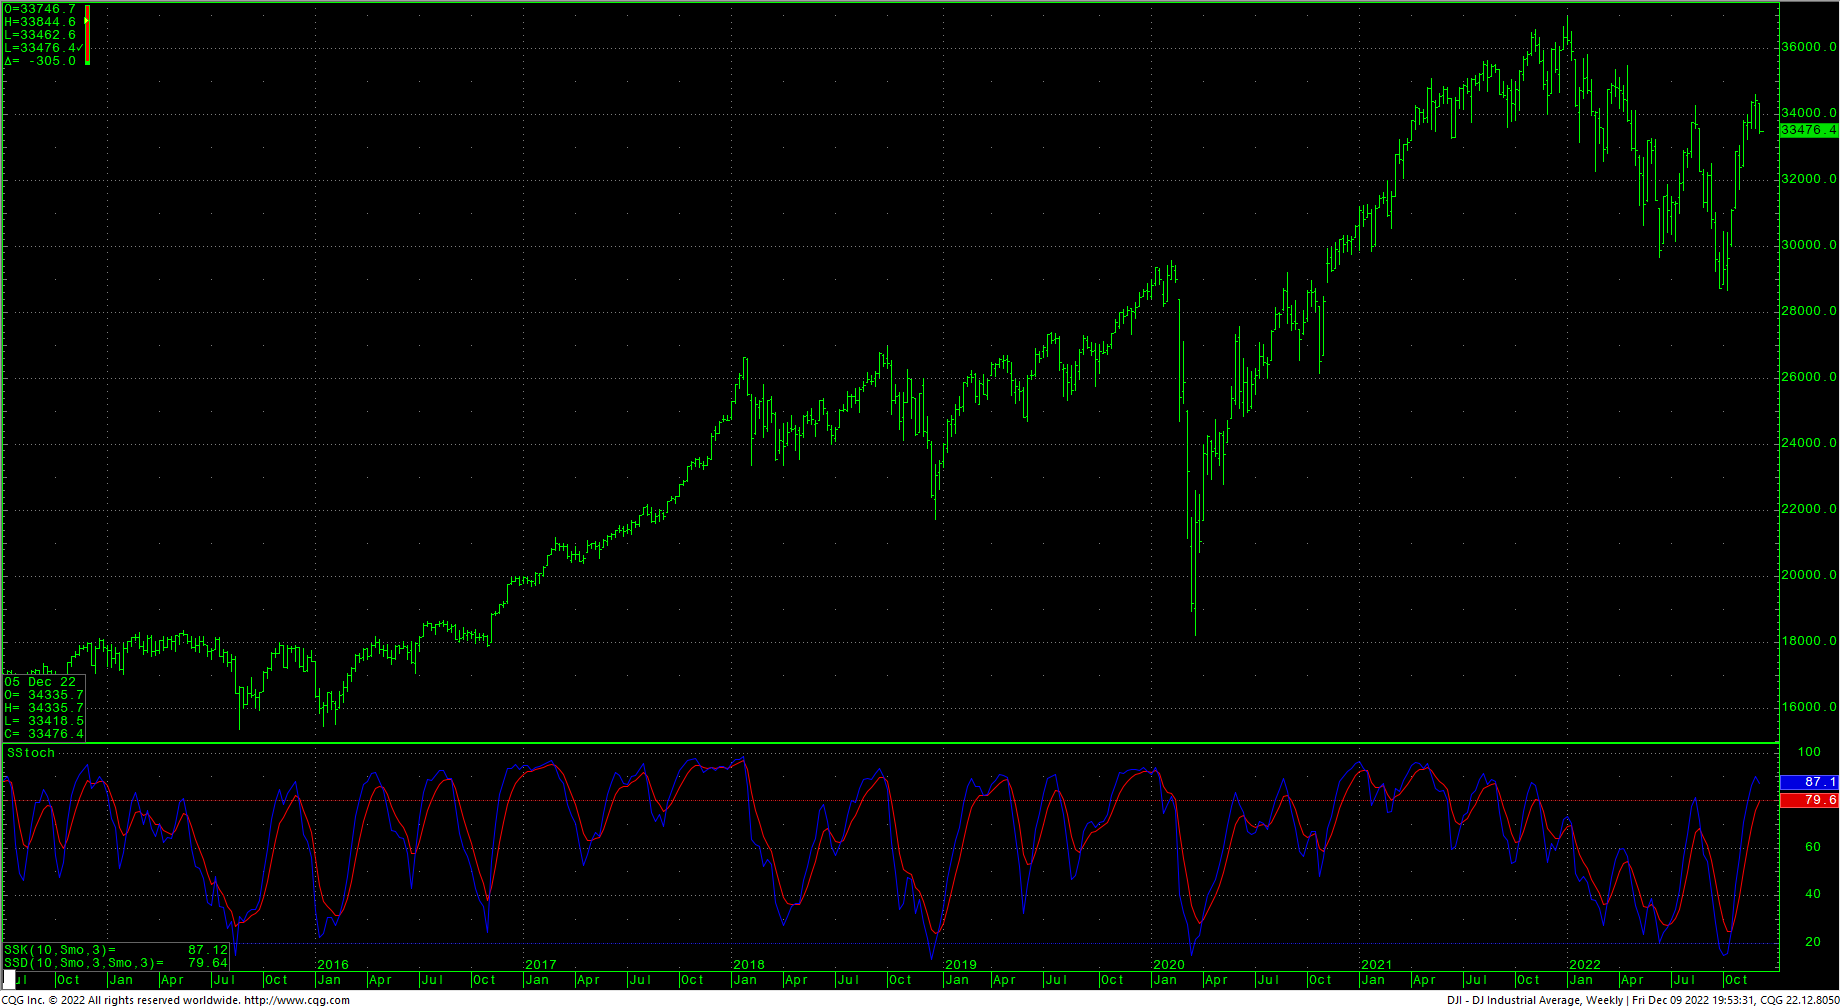
Dow Jones Industrial Average Weekly HLC
Resistance is 33578 and 33696/33700. A rally over 33700 can carry to 33868/33912. That level is a key swing level on the short-term charts and a drive over 33912 suggests 34007 and critical short-term resistance at 34145/34150. Closes over 34150 are short-term friendly and setup a test of 34301/34317. Above 34317 setup a drive to 34483 with potential to the recent tops at 33584.
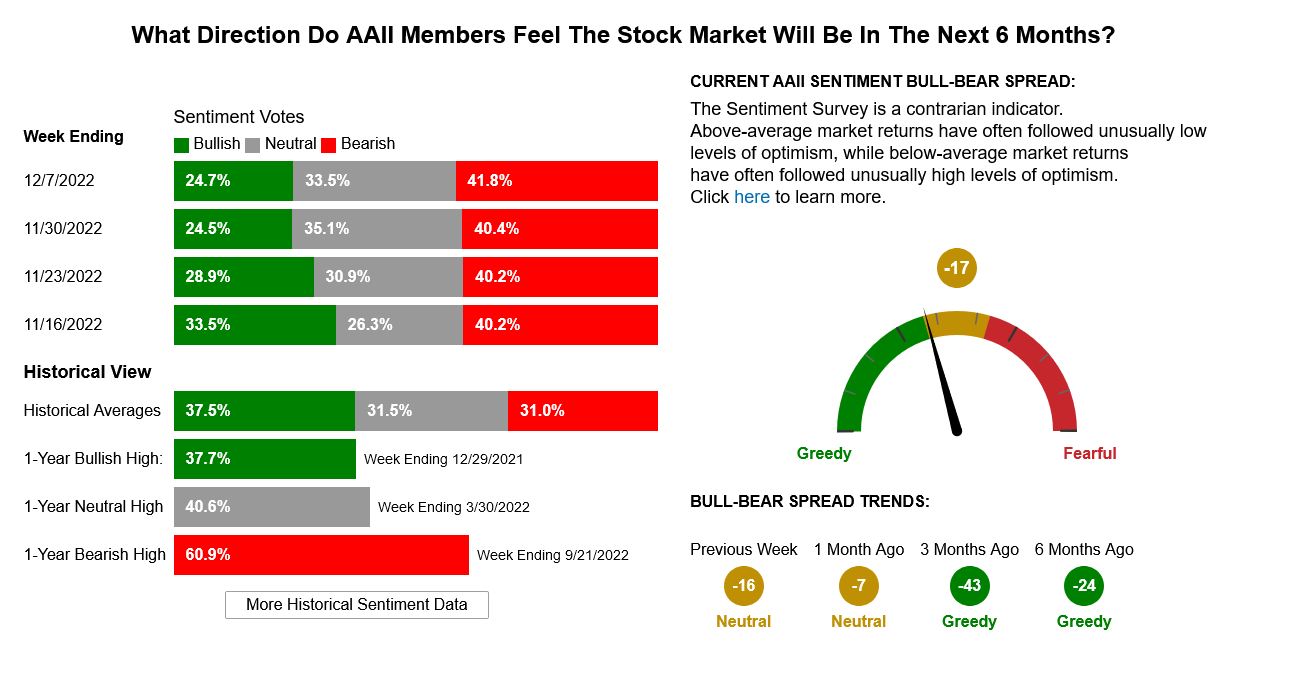
AAII Investor Sentiment Survey
Resistance
- 33578 **
- 33696/333700 *** ↑
- 33868/33912 *** ↑
- 34007 **
- 34145/34150 *** ↑
- 34310/34317 *** ↑
- 34483 **
- 33585/33590 *** ↑
Support
- 33418 **
- 33190/33158 *** ↓
- 32820/32900 *** ↓
- 32627 **
- 32243 **
- 32324 *** ↓
- 32099 ***
- 31727 *** ↓