
TECHNICAL ANALYSIS
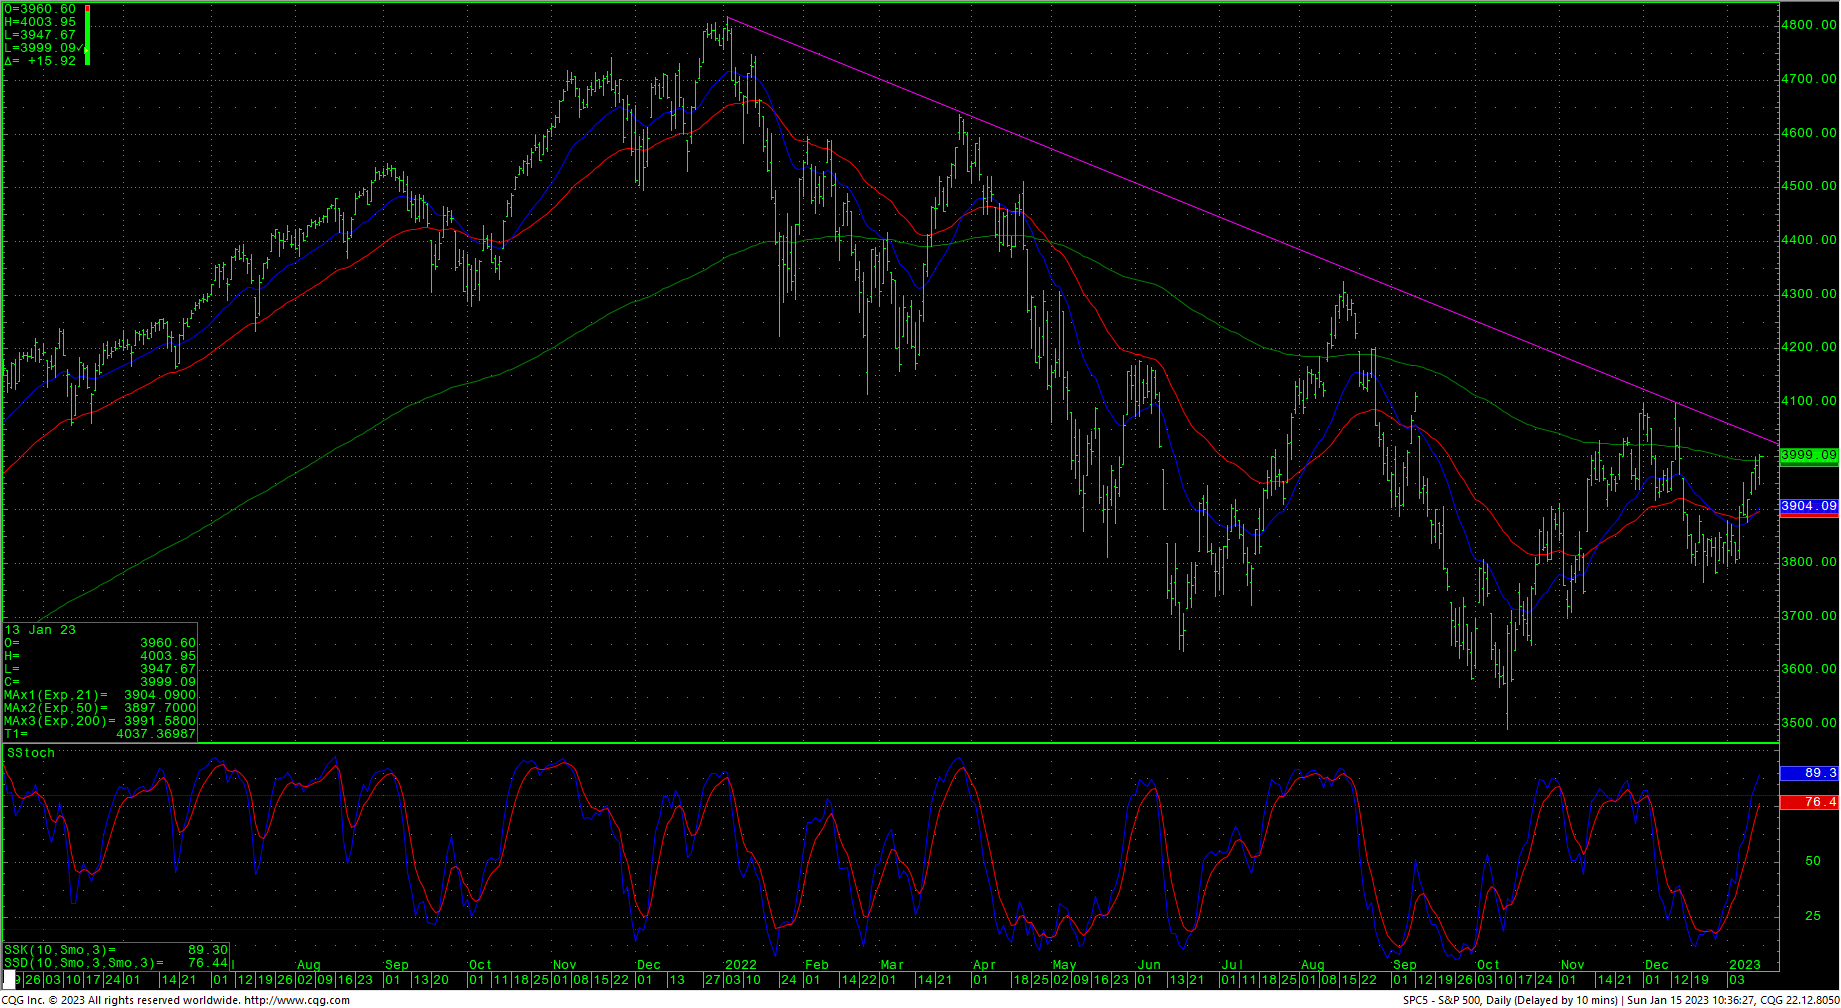
The DJIA spent most of last week on the upside and settled with a 1.99% increase on the week as prices inch back toward the late 2022 swing highs. The “Dow” continues to outperform the S&P500 and the tech-centered Nasdaq Composite. The 52-week H/L line remains frothy, closing the week at -0.16. Sentiment leans mixed with large financial conglomerates announcing layoffs and forecasts of slowdowns to come in 2023/2024. Psychologically, the market might be more than primed for yet another severe reality check. Historically, stock prices tend to lead economics with roughly a six-month lead time. With 2022 being the first negative year since 2018, it might be smarter to look at the years that follow negative returns. 2018 saw a decline of -4.23% which was followed by a positive year in 2019 of +31.21%. The last time the markets saw consecutive negative years was 2000-2002, the end of the “dot com” bubble. Globally, many of the world’s major indices are performing substantially better than the US blue chips and secondary markets. Australia, Germany, the UK and France have all moved back to near record highs in the past few months. The Morgan Stanley Emerging Markets Index is breaking out a of a large, inverted head and shoulders pattern on the daily/weekly charts and projects back toward late 2021 levels currently. Technically, the chart to watch right now is the S&P500. The daily closed just over the 200-day moving average last Friday (currently around 3991.6). The large sloping trendline on both the daily and weekly, that encompasses the upper end of this massive triangle that has formed, comes in to start the week at 4037.4.
Dow Jones Industrial Average Weekly HLC
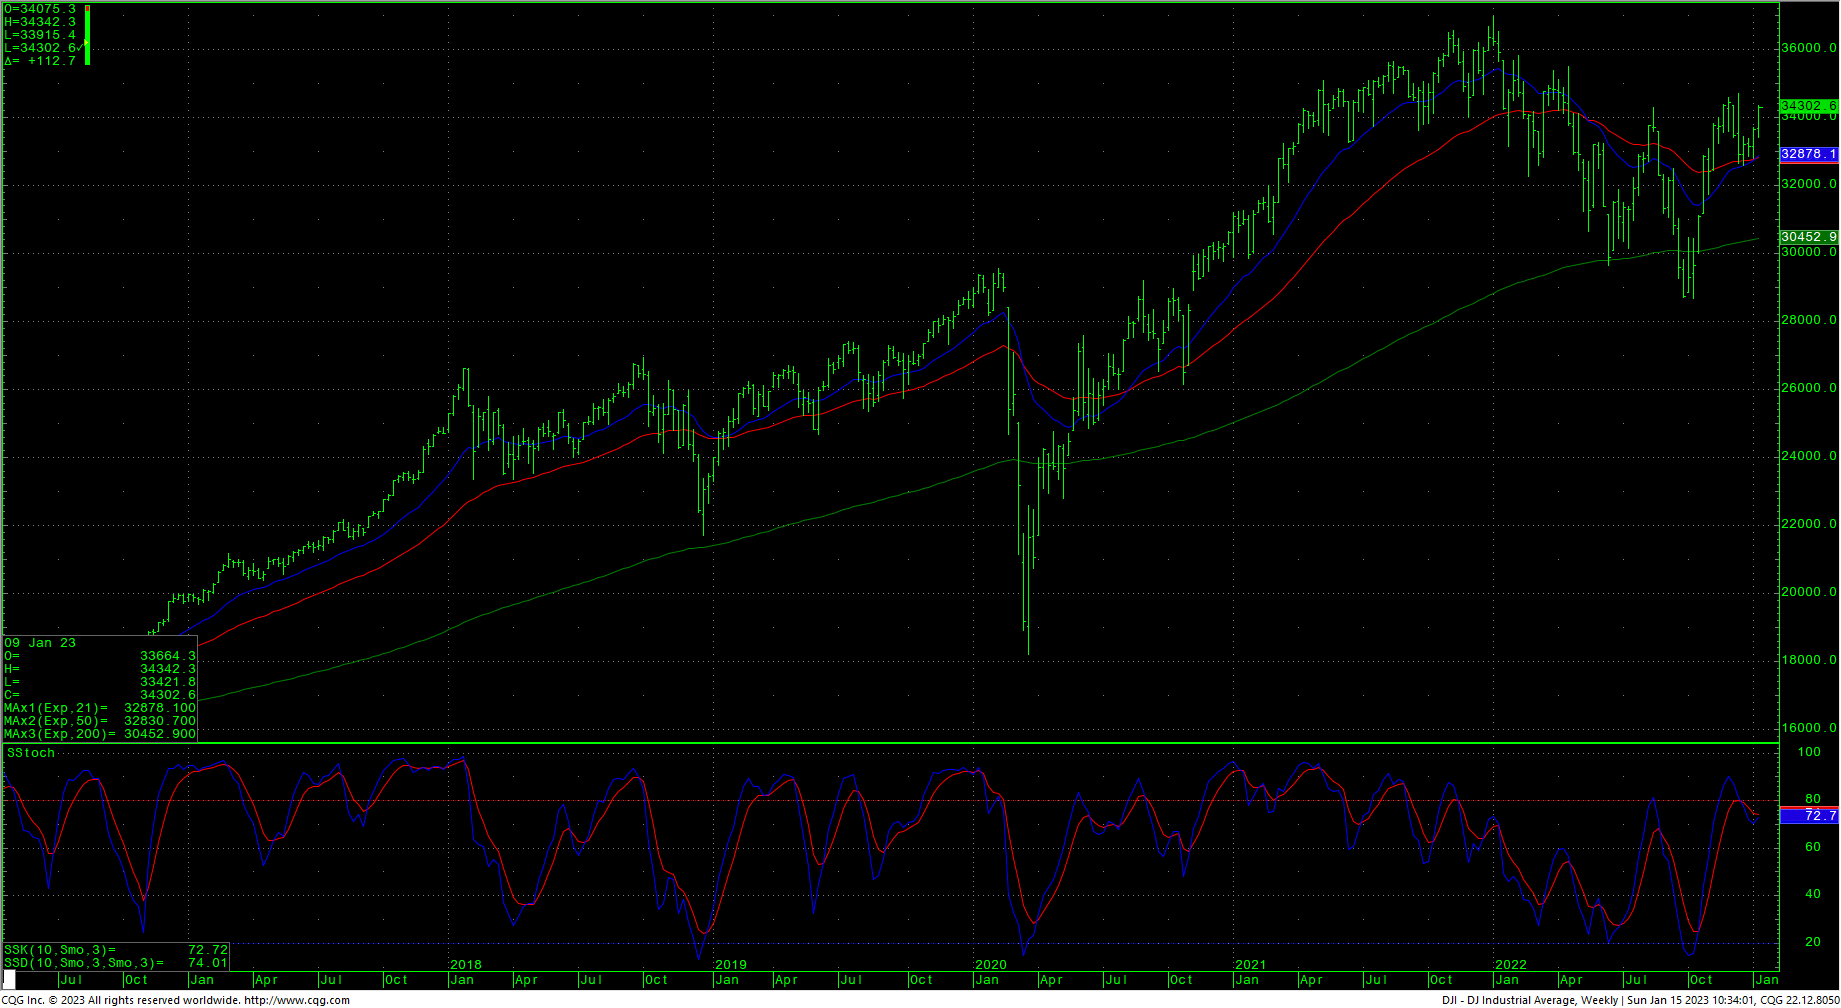
The DJI ended the week with the hourly in overbought conditions but note that the weekly stochastics are potentially hooking higher. This pattern can lead to two things. The first is a possible bearish divergence on further rallies. The second would be a possible runaway move to new highs. The next key area is 34400. A continued move above 34400 opens counts to 34589 and the December swing highs at 34712 and will open potential to a band of long-term resistance at 34879 through 34995/35000. This band at 35000 is not just a psychological benchmark but is pretty much the final area of weekly resistance before setting the DJIA up to probe the Spring 2022 tops at 35492 and the February 2022 tops at 35824. Closes over 35800/35824 would signal a test of the record highs at 36799 and 36952.
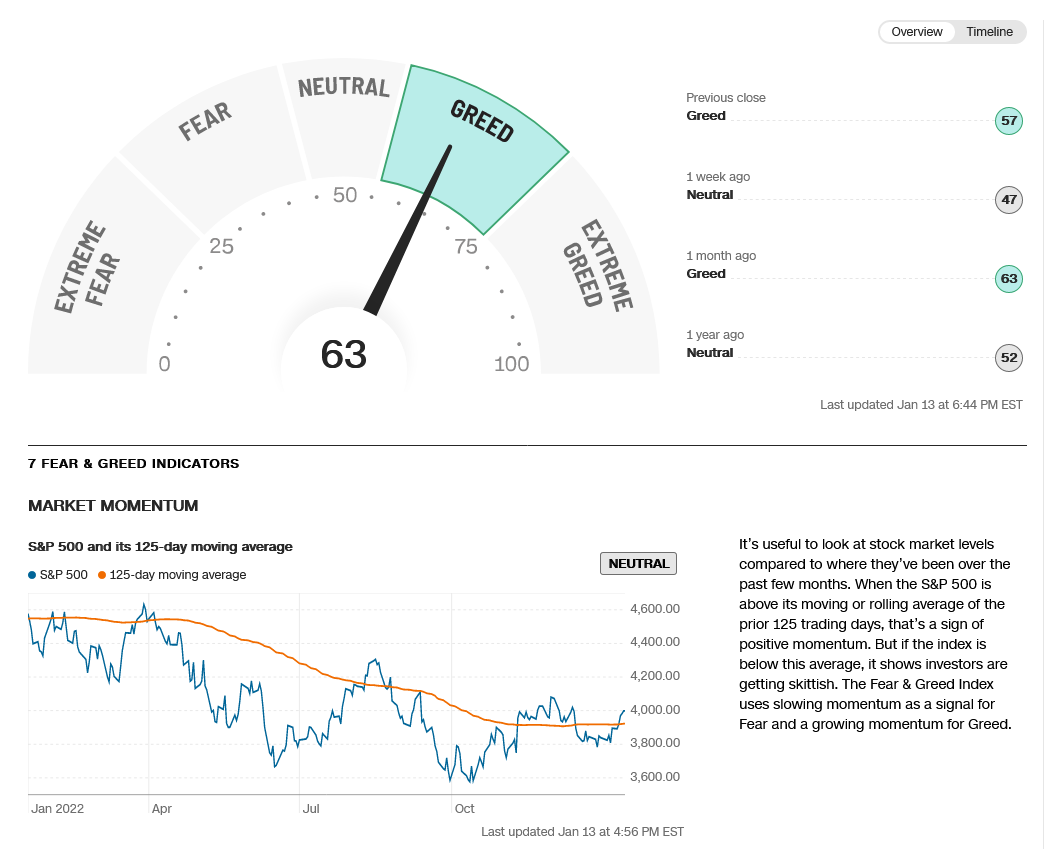
CNN Fear & Greed Index
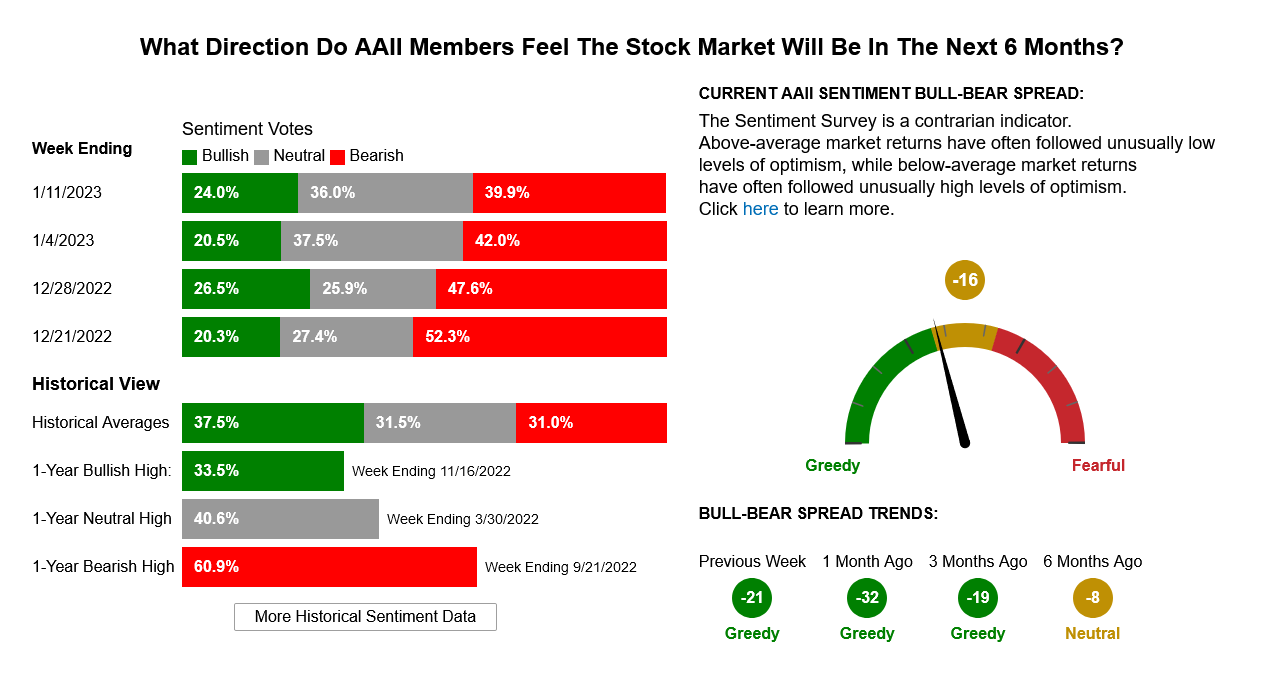
AAII Investor Sentiment Survey
Support is at 34128 and 34083. A breakdown under 34083 sets up a test of the 33925/33915 area. Closes below 33915 can test 33795 with counts to pivotal short-term support of 33665/33650. Daily closes under 33650 should minimally test 33457 with potential to critical short-term support at 33249/33240. Any trade back under 33240 is a bearish signal and likely means the lows at 32600/32573. Below that is support at 32400 and 32343. A breakdown under 32343 opens counts to key short-term support of 32170. A breakdown with closes under 32170 sets up 32099 with longer-term potential toward 31727/31686. Closes under 31686 will open counts into the 30972/30960 level with support of 31423 and 31160.
Resistance
- 34395/34400 ***↑
- 34589 *** ↑
- 34700/34712 *** ↑
- 34879 **
- 34995/35000 *** ↑
- 35190 **
- 35360 **
- 35492 *** ↑
- 35800/35824 *** ↑
- 36799/36952 *** ↑
Support
- 34128 **
- 34083/34080 *** ↓
- 33925/33915 *** ↓
- 33795 ***
- 33665/33650 *** ↓
- 33457 ** ↓
- 33330 **
- 33249/33240 *** ↓
- 33146 ***
- 33013/33000 **
- 32967 **
- 32867/32850 *** ↓
- 32800 *** ↓
- 32654 **
- 32600/32573 *** ↓
S&P 500 Cash Index
As mentioned above, the S&P index closed above the 200-day moving average on Friday. The market continues to trade inside of a narrowing triangle pattern with hefty trendline resistance above. The 21-day has moved above the 50-day moving average with last week’s trade. The hourly is overbought and the next area of pivotal resistance is 4016/4021. A further drive above the 4021 level should take the index to 4048 with potential toward 4100 and possibly 4155. A breakout over the 4155 level gives counts to a gap area at 4203 to 4218 and longer-term counts to critical resistance of 4311/4315.
S&P 500 Index Daily HLC
S&P 500 Index Weekly HLC
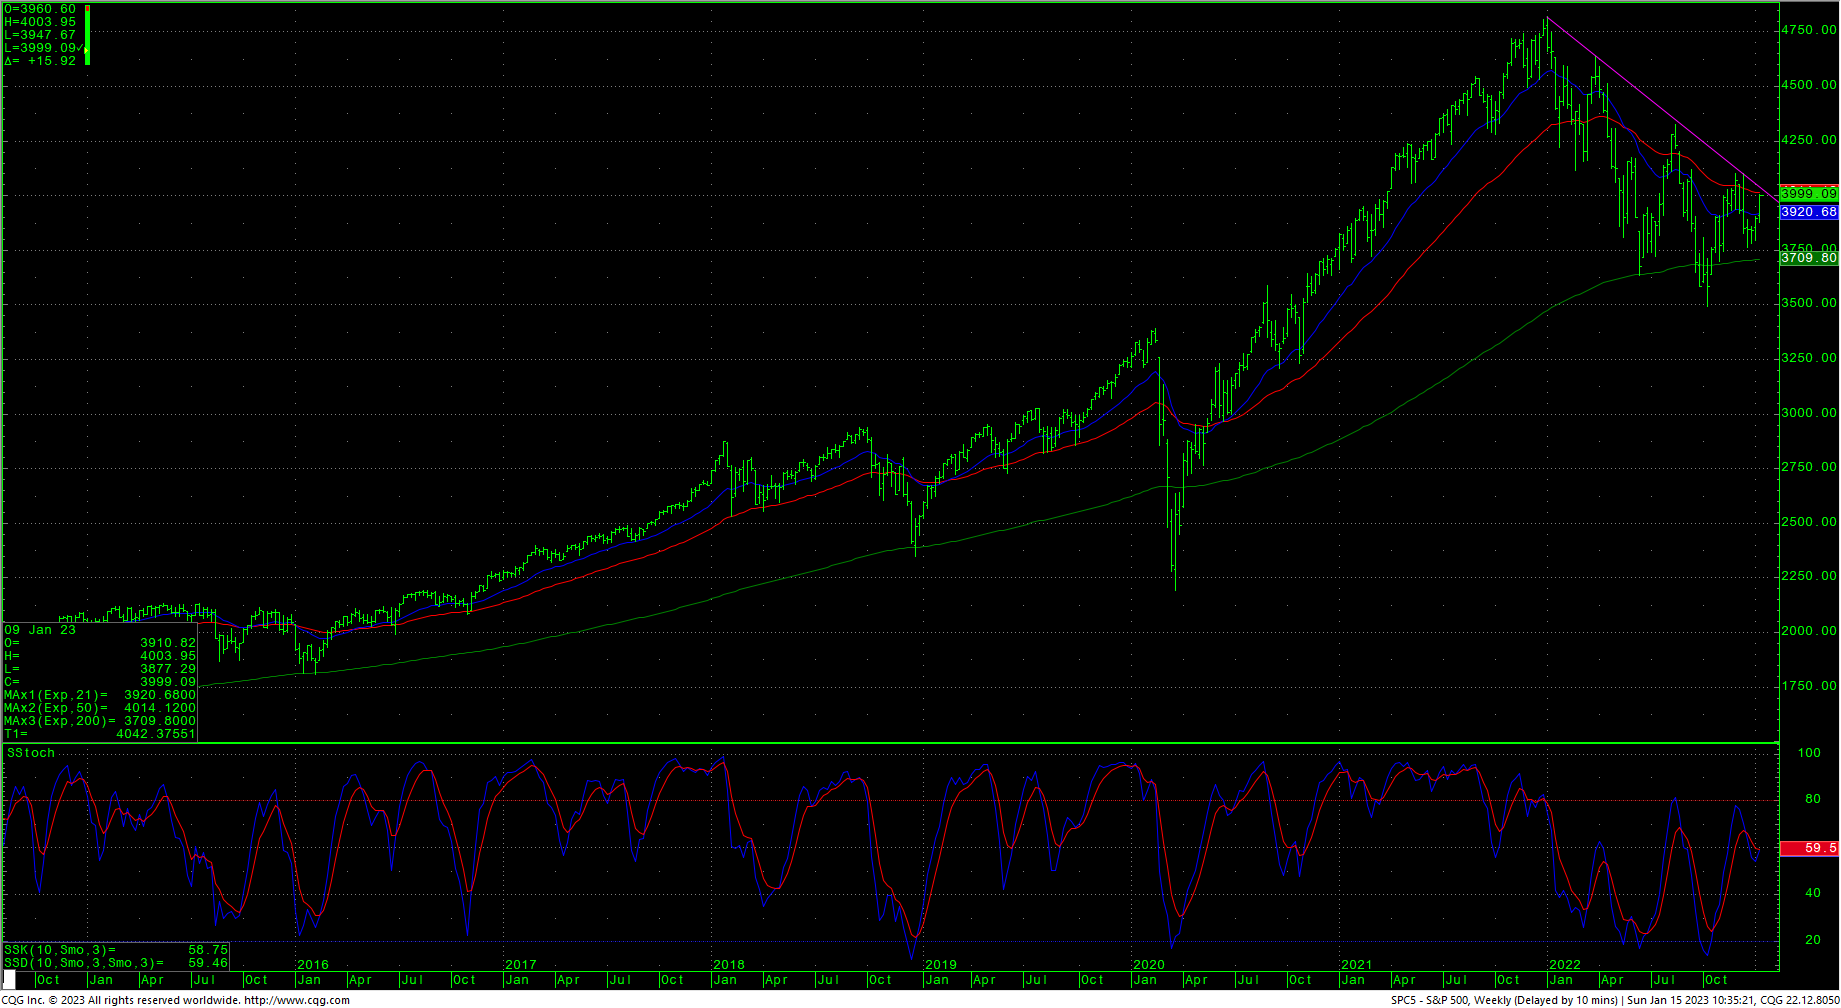
The market ended in overbought short-term conditions on Friday and support is at 3969. Trade under 3969 should test pivotal short-term support of 3947. A breakdown under 3947 suggests a test of the gap area at 3930/3928 with potential to 3912/3910. Daily closes under 3910 set up intermediate-term support of 3890/3884. Closes under 3884 minimally should test critical short-term support of 3855/3850. Daily closes under 3850 suggest 3799/3797 with potential to 3764. Support is critical against the 3724/3720 area. Closes under 3720 open counts to 3643/3635. Under 3635 is bearish and signals a test of the lows at 3491.
Resistance
- 4000 *** ↑
- 4016/4021 *** ↑
- 4048 ***↑
- 4100 ***
- 4155 *** ↑
- 4203/4218 ***
- 4311/4315 *** ↑
Support
- 3969 **
- 3947 ***
- 3930/3928 ***
- 3912/3910 *** ↓
- 3890 **
- 3884 *** ↓
- 3855/3850 *** ↓
- 3815 **
- 3799/3797 *** ↓
- 3764 ***
- 3724/3720 *** ↓
- 3643/3635 *** ↓