
Timing
TECHNICAL ANALYSIS
Major Indices Week of April 28, 2023
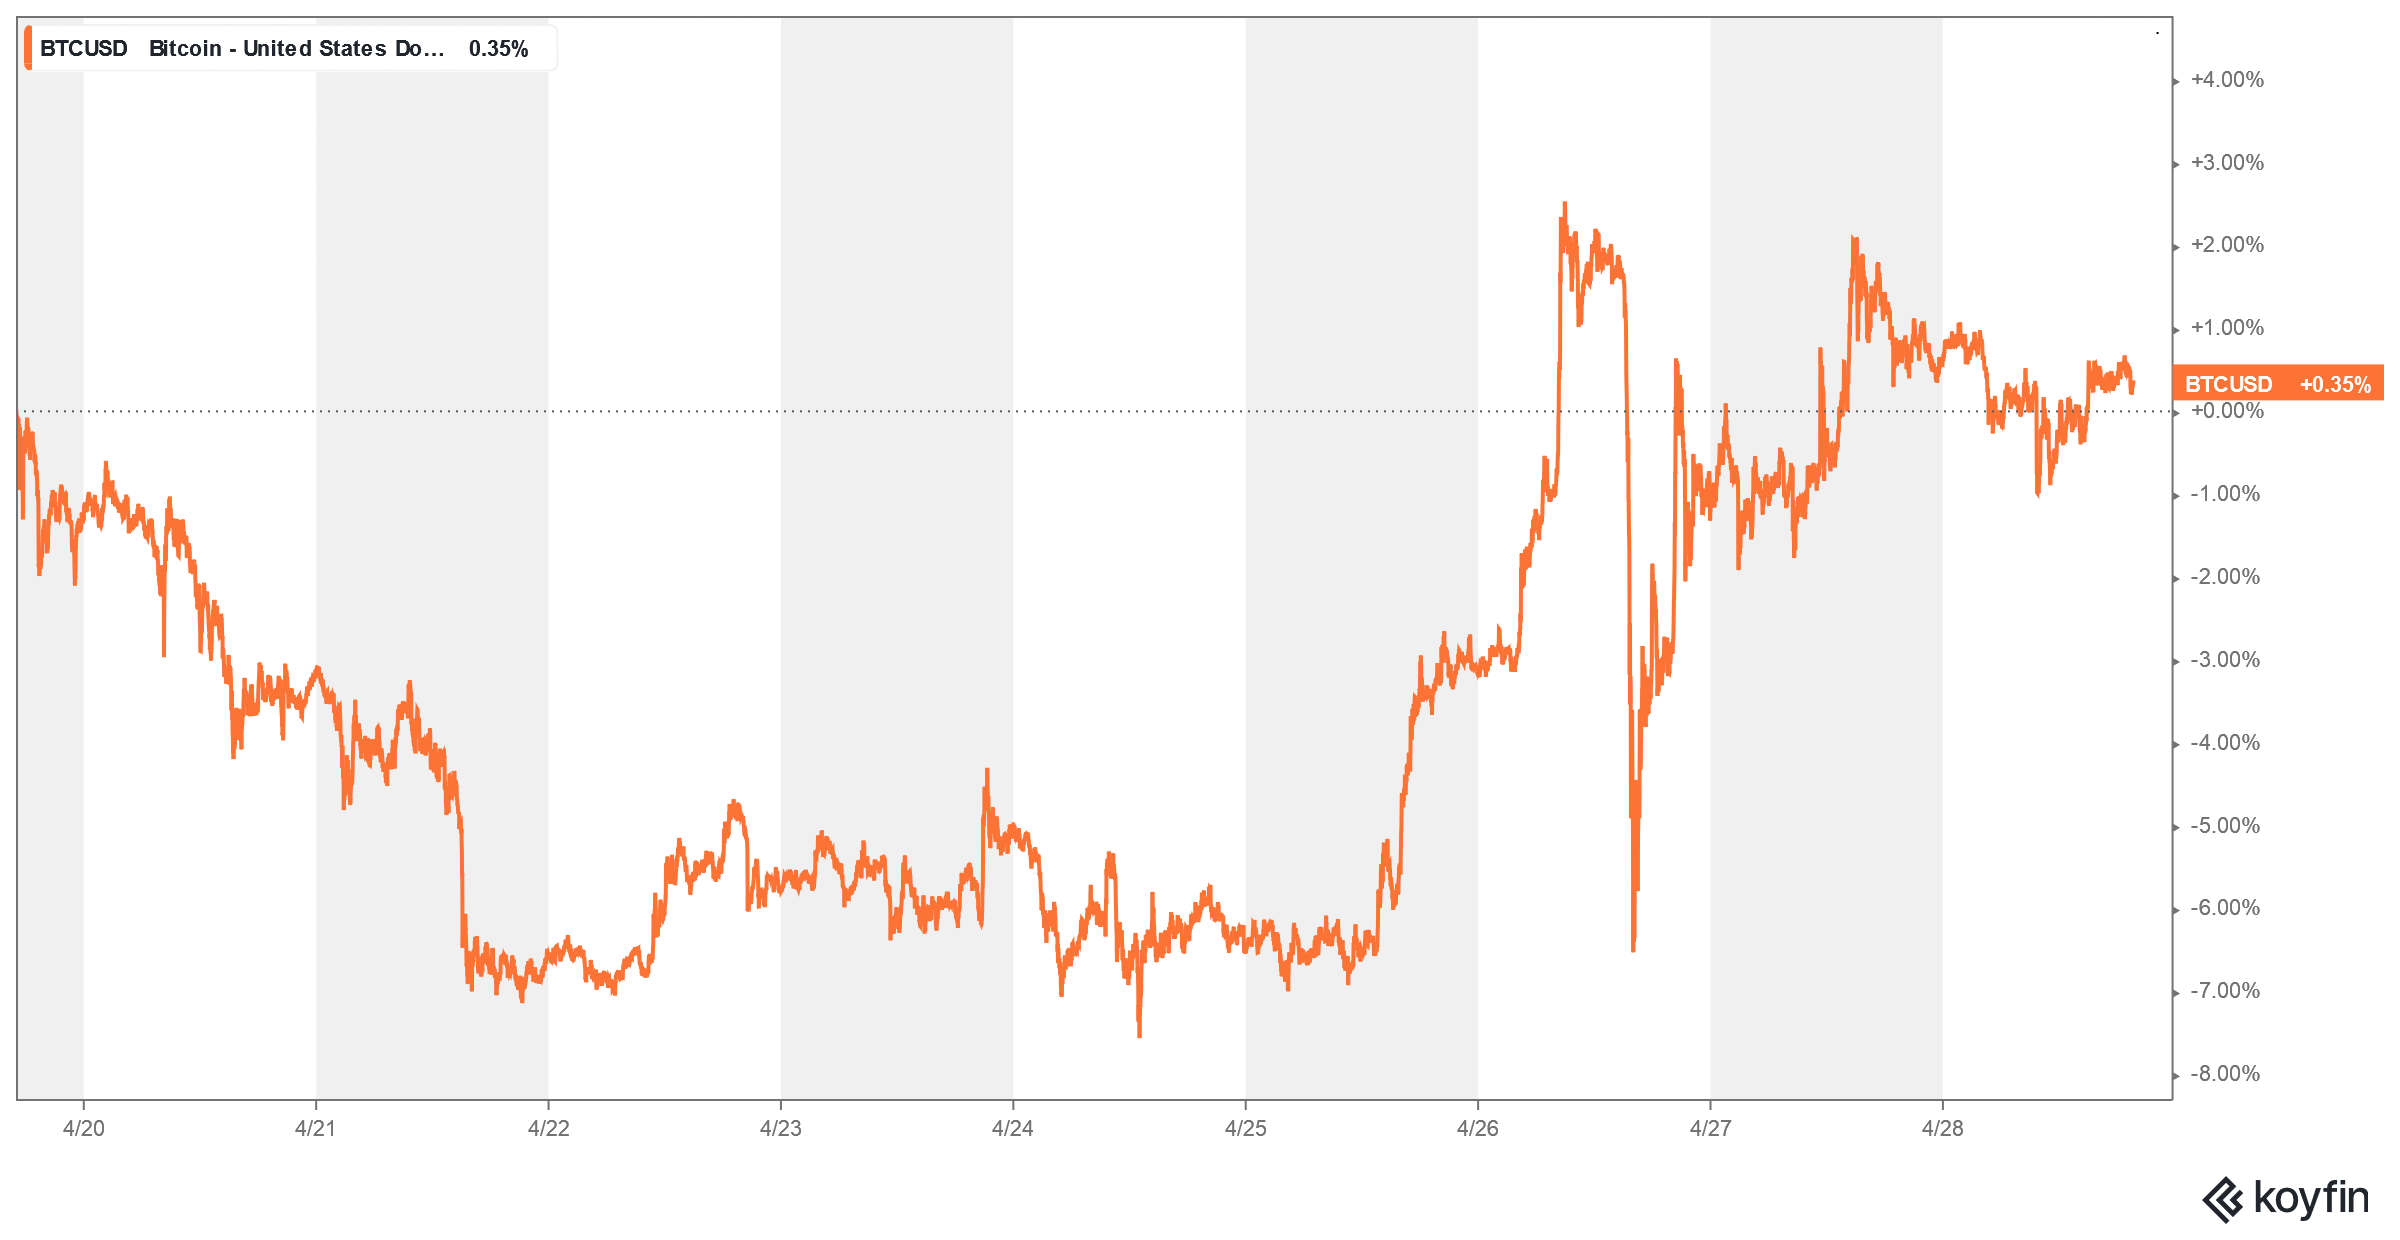
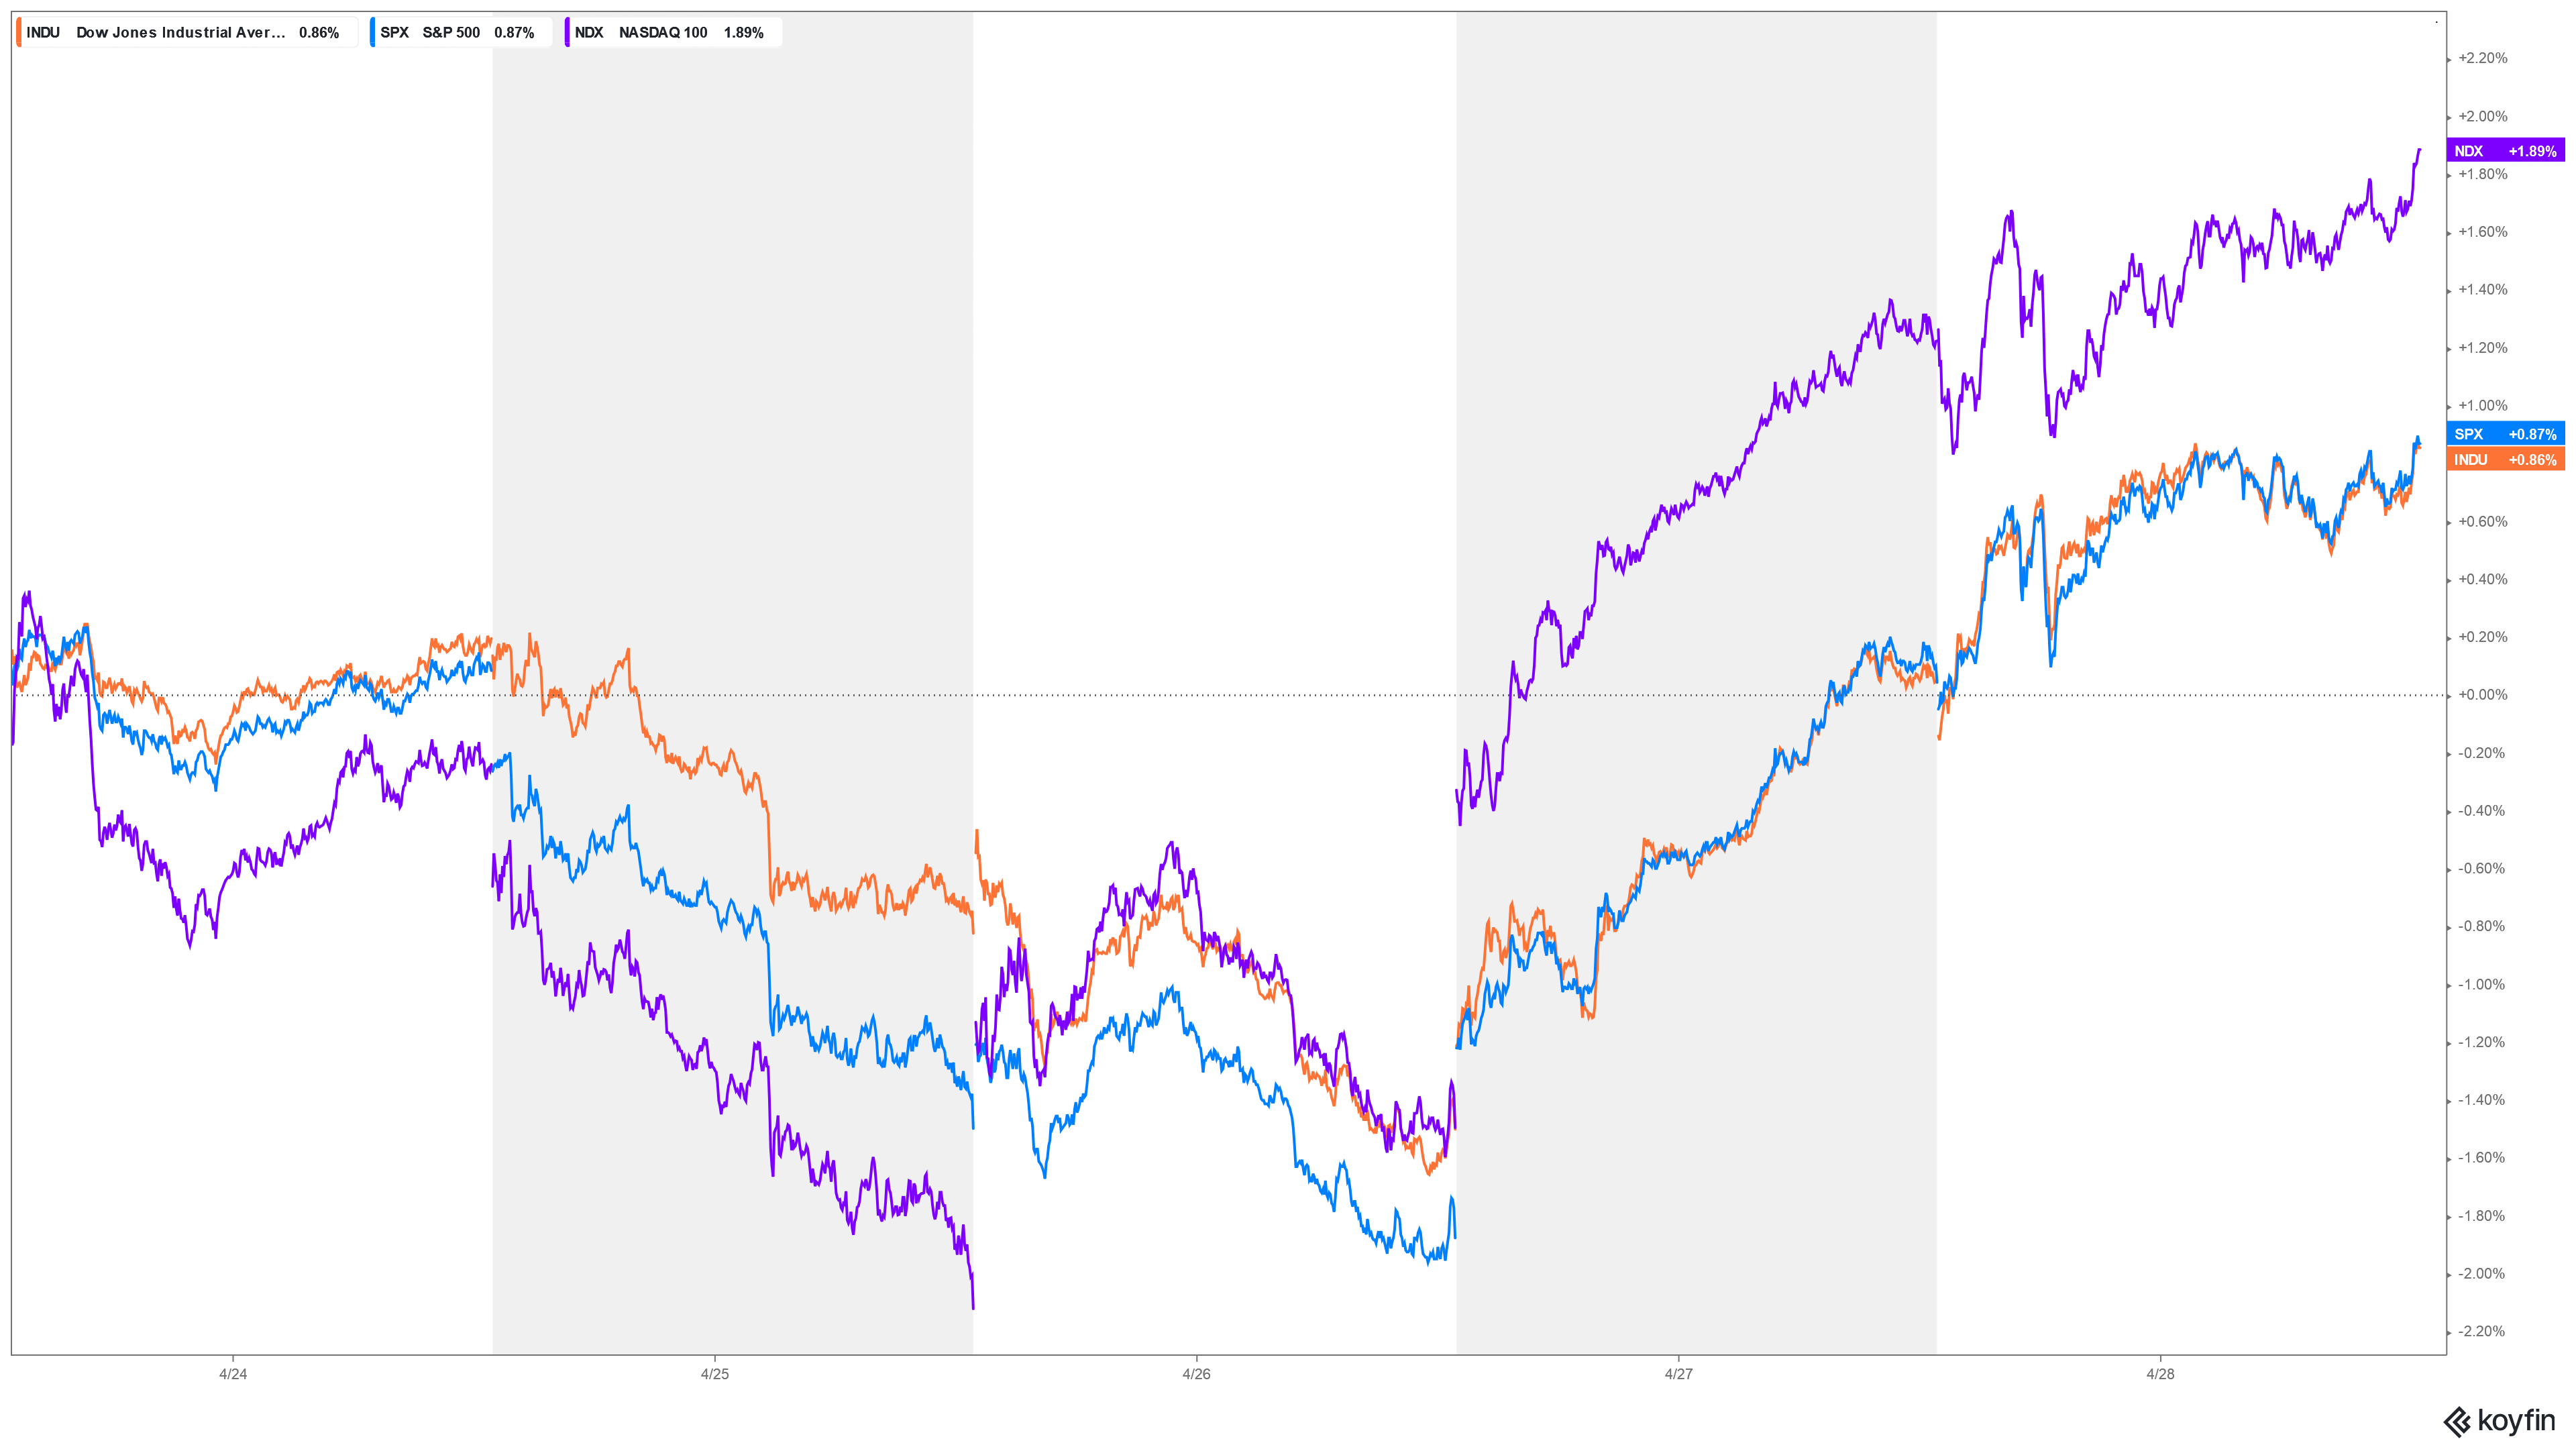 Stocks traded in a volatile outside week up last week with all the major indices ending higher for the week. Friday’s rally trade was also the end of the month of April and it was the best monthly performance for stocks since January of this year. The Dow ended the month +2.48% and the week +0.86%. The close is the highest weekly close for the Dow since January 23rd. The S&P closed the month +1.46% and the week +0.87%. Last week’s close is the highest since August 15, 2022 for the S&P500. The Nasdaq ended the month +1.58% and the week +1.28%. Last week’s close is the highest Since September of 2022 for the Nasdaq. The action was commensurate with the critical timing for stocks outlined in our timing updates. Longer-term readers know that oftentimes, critical timing becomes a point where energy builds up and then is released immediately after the timing. In this case, prices narrowed into an extremely tight range and then became volatile immediately out of the timing window. Another timing note is that the recent window highlighted cryptos…and Bitcoin immediately moved into extreme volatility out of this timing point.
Bitcoin: April 20 Through April 28, 2023
Here are the upcoming timing points for May 2023.
Timing Points May 2023
- 05/01 ** minor
- 05/04 *** key
- 05/09 ** minor
- 05-15/16 *** X Key week (Critical)
- 05/25 ** minor
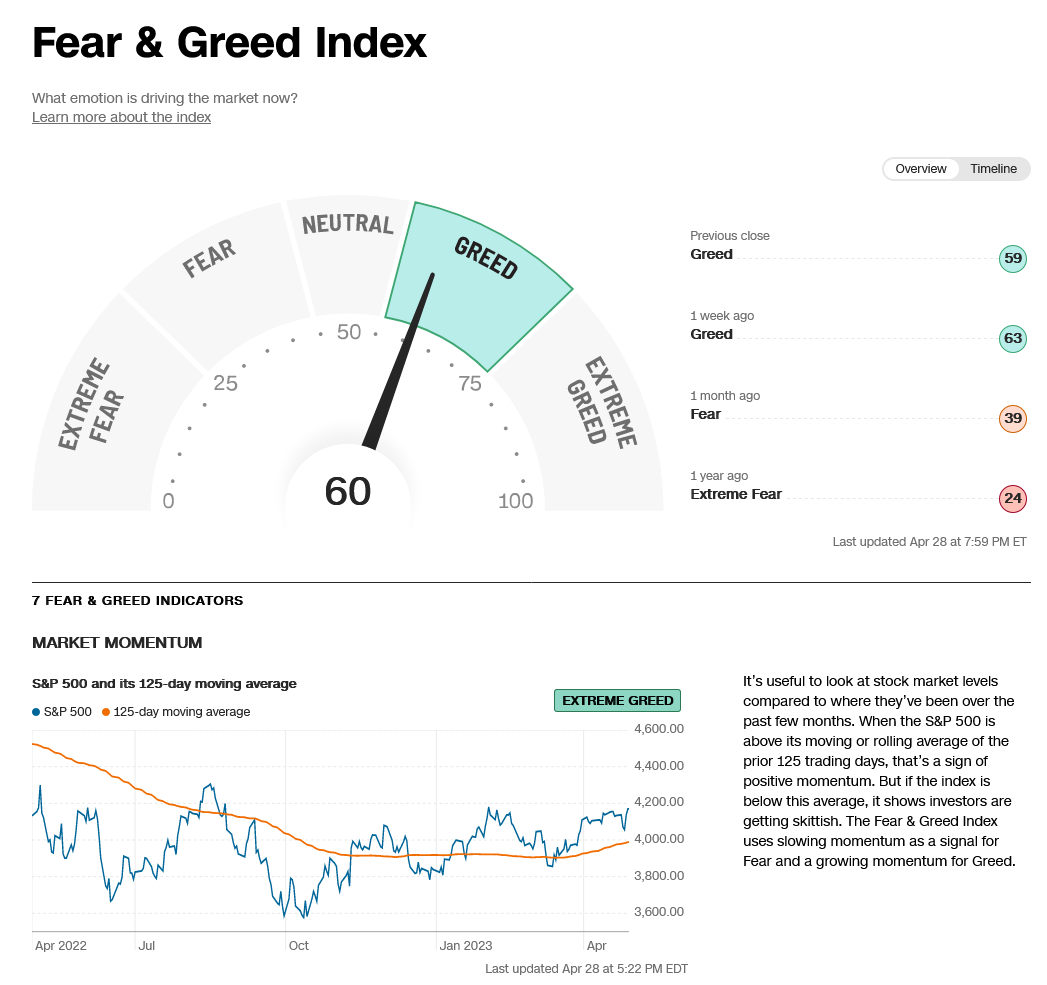
CNN Fear & Greed Index
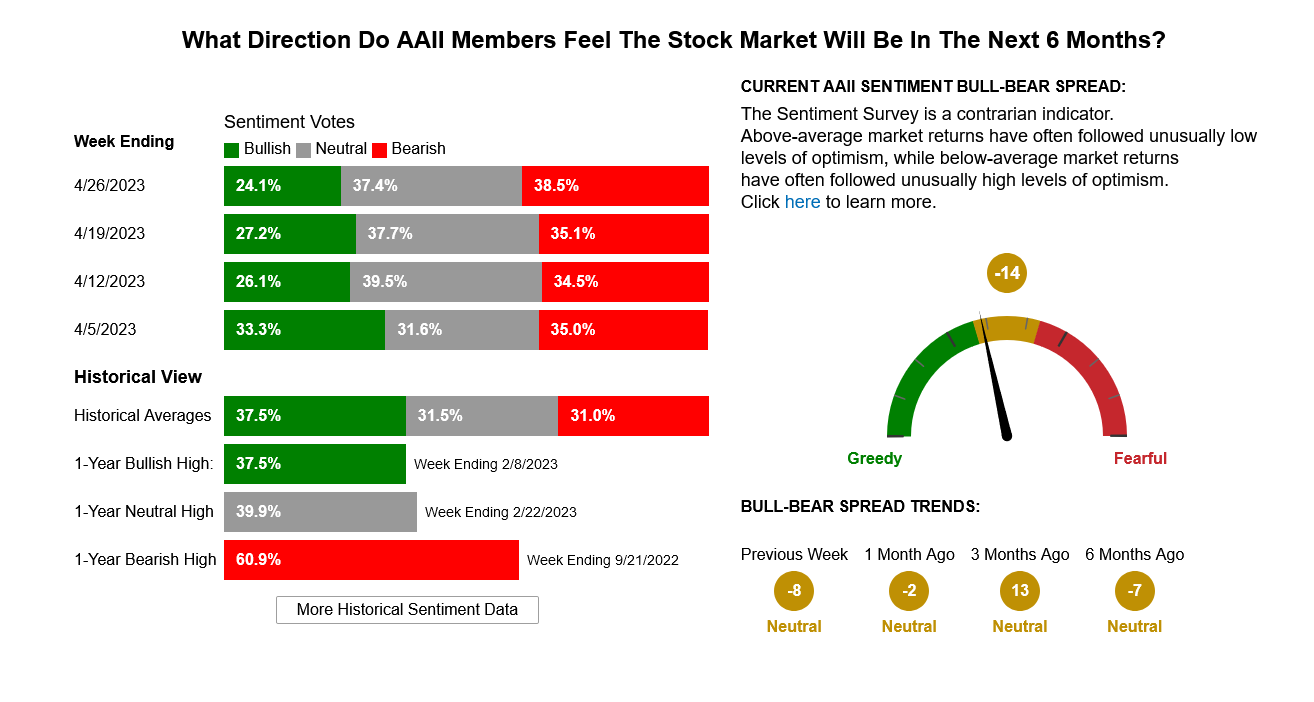
AAII Investor Sentiment Survey
VIX Volatility Index Weekly
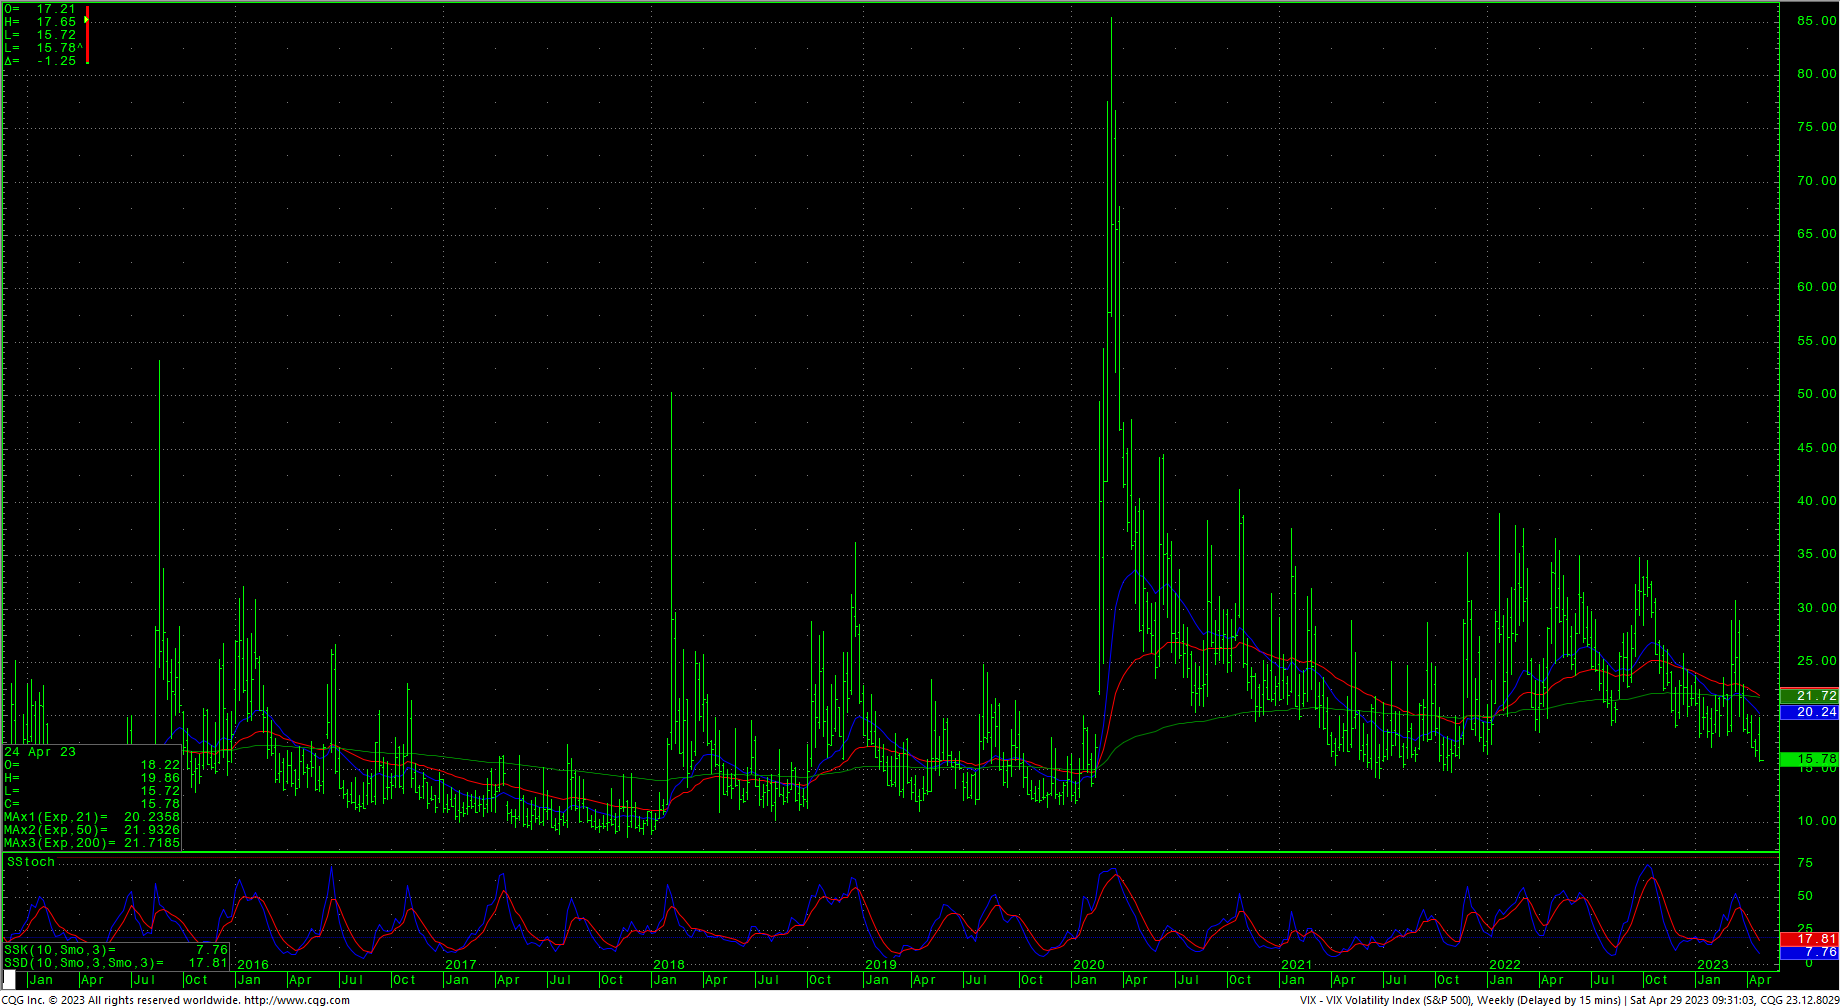
Sentiment remains neutral to greedy. The 52-week, high-low ratio declined slightly last week to +0.38%, however that does remain frothy as an indicator. Another cautionary indicator of relative greed is the VIX, which is now moving into the lowest reading since October of 2021.
Dow Jones Industrial Average Hourly HLC
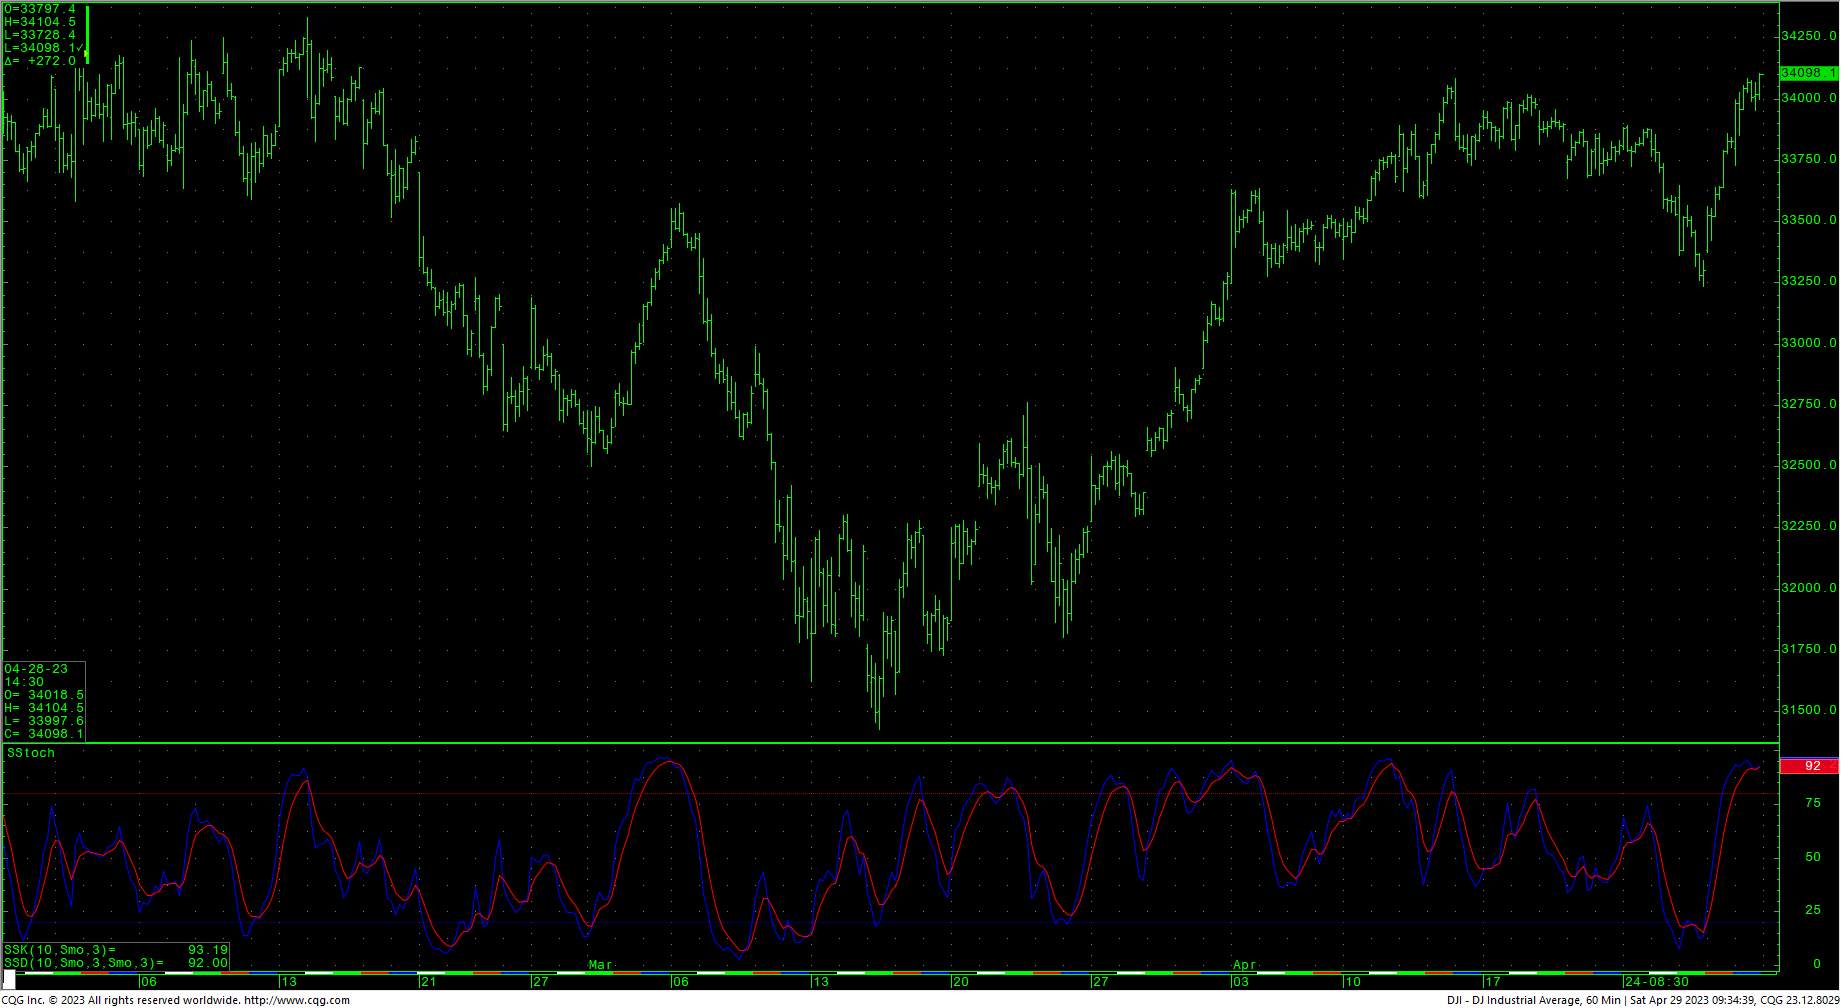
The hourly chart shows overbought conditions on Friday’s close as prices have now moved to the highest levels since mid-February of this year. The weekly is in a hook higher on the stochastics as prices penetrate the overhead trend line on that chart. The Dow cleared a pivotal area of resistance and now has opened counts to 34712 with resistance at 34222 and 34334/34342. A drive over 34712 can test significant long-term resistance at 34879 and 34995 and offers full counts back critical resistance at 35492. Closes over 35492 will open counts to 35824. Closes over 35492 should minimally test a gap area on the daily at 35996 to 36044.
Dow Jones Industrial Average Weekly HLC
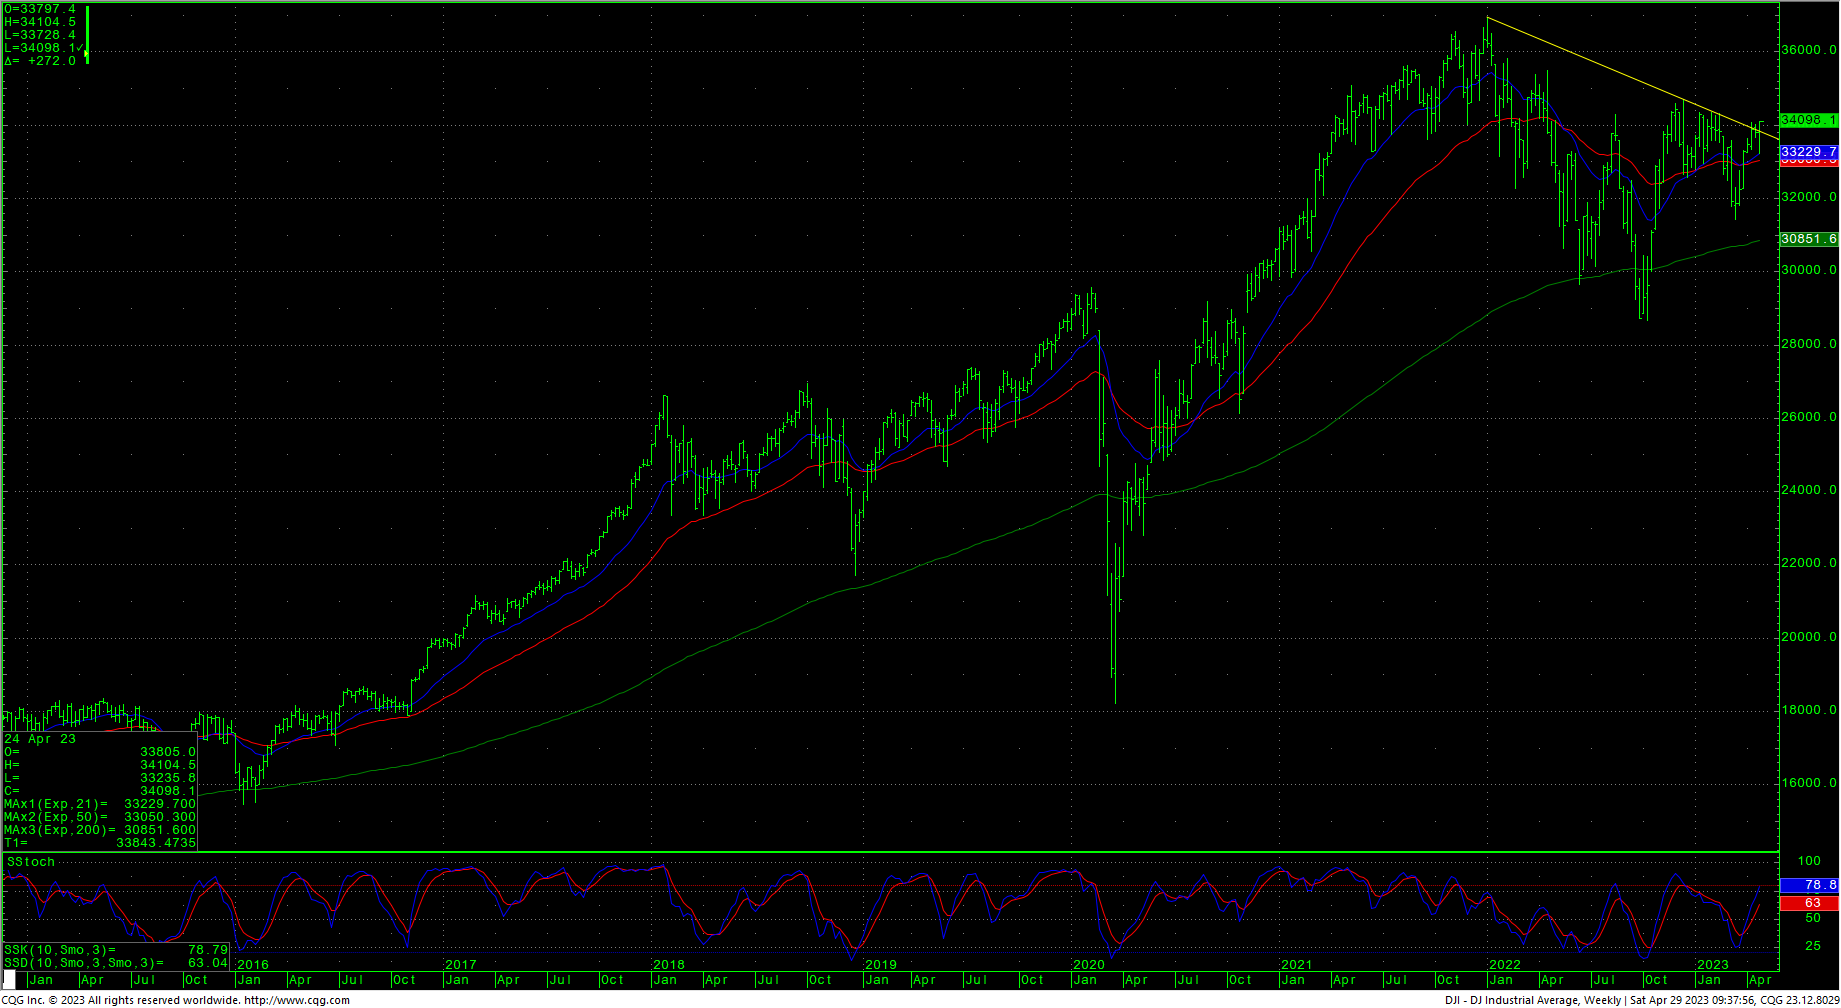
Support for the Dow is 33900 and 33772. A breakdown under 33772 should test 33670 with counts to 33567/33560 through 33473. Closes under 33473 setup a move to 33278/33241 with counts to pivotal short-term support of 33083/33070. A breakdown under 33070 sets up 32767 with counts to critical support of 32451/32440. Closes under 32440 set up a move to intermediate support in the 31727/31686 level. A breakdown with closes under 31686 will open counts into the 30972/30960 level with support of 31429/31423 and 31160. There is a gap on the daily chart that runs from 31160 to 31119.
Resistance
- 34104 **
- 34130 **
- 34222 *** ↑
- 34334/34342 *** ↑
- 34395 **
- 34495 **
- 34595 **
- 34712 *** ↑
- 34879 ***
- 34995 *** ↑
- 35112 **
- 35225 **
- 35372 ***
- 35492 *** ↑
- 35800/35824 *** ↑
- 35996 ***
- 36044 **
- 36168 **
- 36513 *** ↑
- 36799/36952 *** ↑
Support
- 33997 **
- 33950 **
- 33900/33899 *** ↓
- 33850 **
- 33760 **
- 33670 *** ↓
- 33595 **
- 33567/33560 *** ↓
- 33473 *** ↓
- 33360 **
- 33278/33241 *** ↓
- 33200 **
- 33083/33070 *** ↓
- 32968 **
- 32850 ***
- 32767 *** ↓
S&P 500 Cash Index
The S&P has also reached some extremely overbought conditions on the hourly chart with Friday’s rally. Prices traded to, and ended right at, the recent swing highs at 4169. As mentioned above, the close is the highest weekly close for the S&P since August 15, 2022. The daily close can be considered friendly, even with the current frothy short-term indicators. Continued rallies with should test the overhead gap area at 4203 to 4218 and longer-term counts to critical resistance of 4311/4315. Daily closes over 4315 open counts to 4385 with full potential to long-term critical resistance of 4486/4505. Closes over 4505 can carry to 4593 with full potential toward 4637. A breakout above 4637 opens potential toward 4748 and ultimately 4818.
S&P 500 Index Weekly HLC
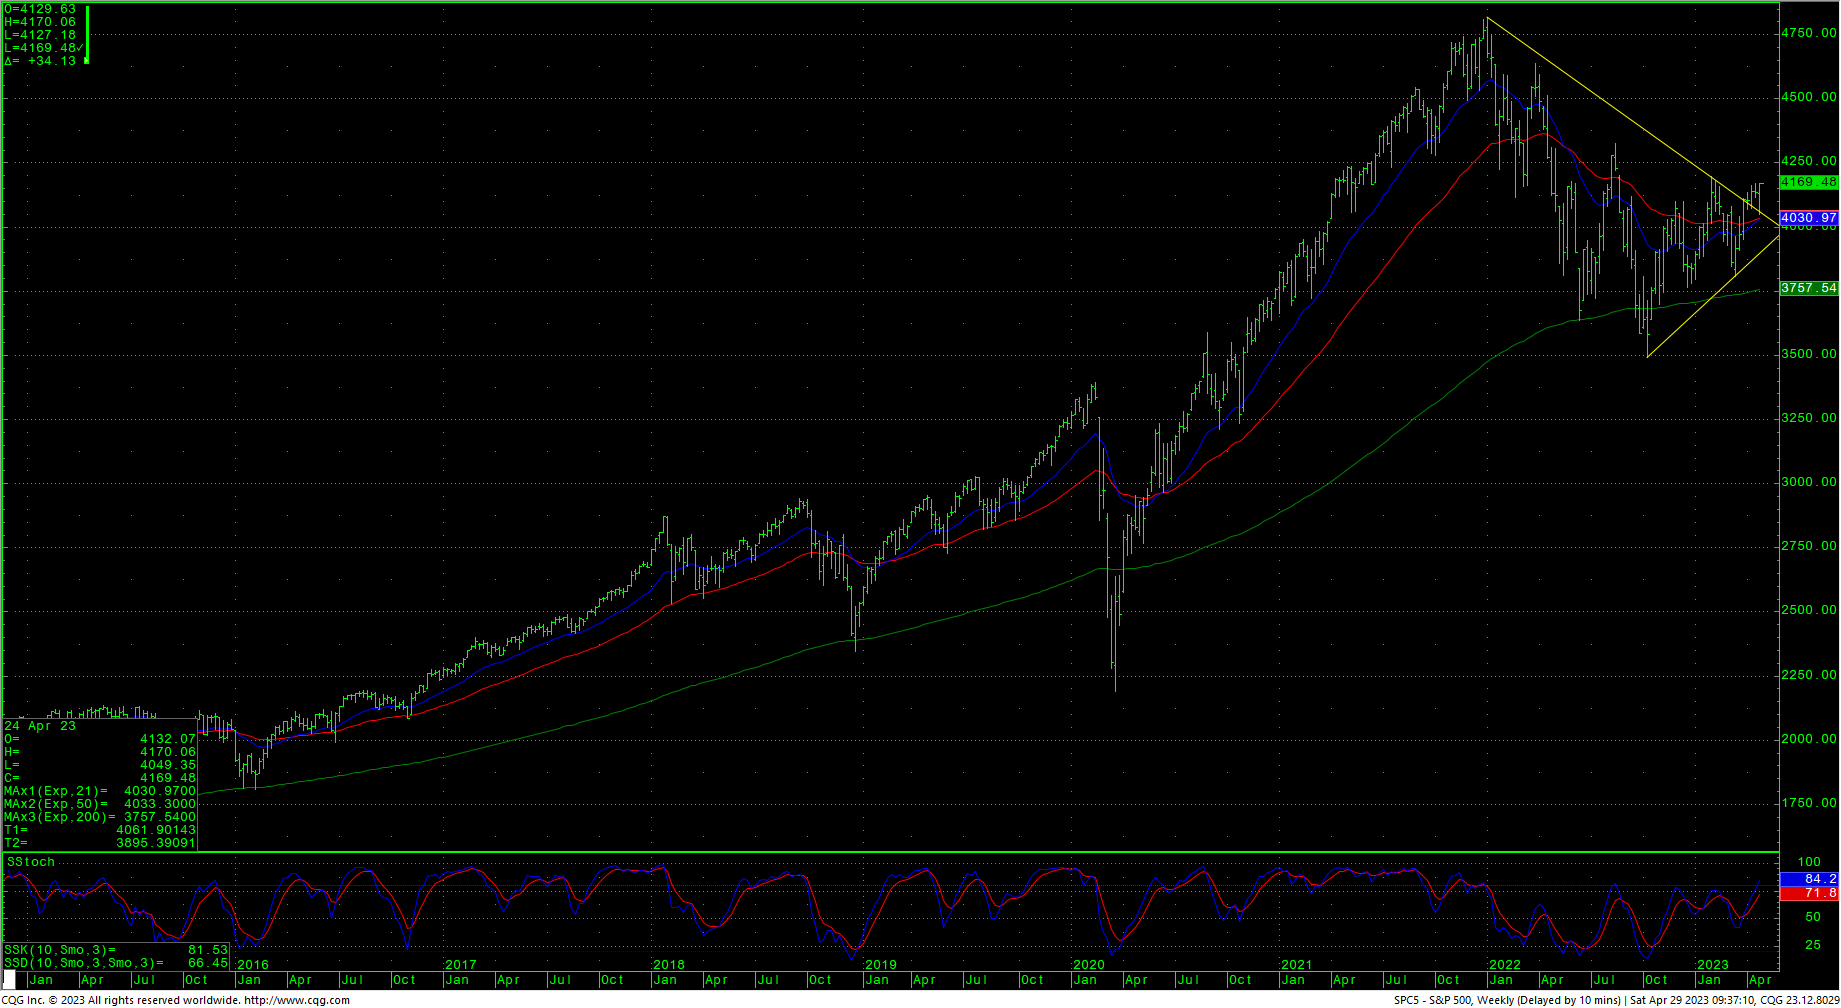
Support is 4141 and 4123. A breakdown under 4123 should test 4109 with counts to 4095/4084. A breakdown under 4084 should test 4058 with counts to 4031/4028. Closes under the 4028 level should carry to 3989 with counts to pivotal near-term support of 3946/3940. Closes under 3940 setup a retest of 3868/3865. A breakdown under 3865 can test 3808 through 3797. A breakdown with closes under 3799/3797 opens counts to critical support against the 3760/3750 level. Under 3750 sets up a move to 3657 and full potential back to critical long-term support of 3505/3491.
Resistance
- 4203/4218 ***
- 4311/4315 *** ↑
- 4350 **
- 4385 *** ↑
- 4430 **
- 4486 *** ↑
- 4505 *** ↑
- 4593 **
- 4637 *** ↑
- 4665 **
- 4748 *** ↑
- 4818 *** ↑
Support
- 4152 **
- 4141 ** ↓
- 4123 *** ↓
- 4109 *** ↓
- 4095/4084 *** ↓
- 4058 *** ↓
- 4031/4028 ***↓
- 4002 **
- 3965 **
- 3946/3940 *** ↓
- 3868/3865 *** ↓
- 3845 **
- 3808 *** ↓
- 3799/3797 *** ↓
- 3760/3750 *** ↓
- 3667/3657 *** ↓
Gold at a Crossroads
Gold Inflation-Adjusted Monthly
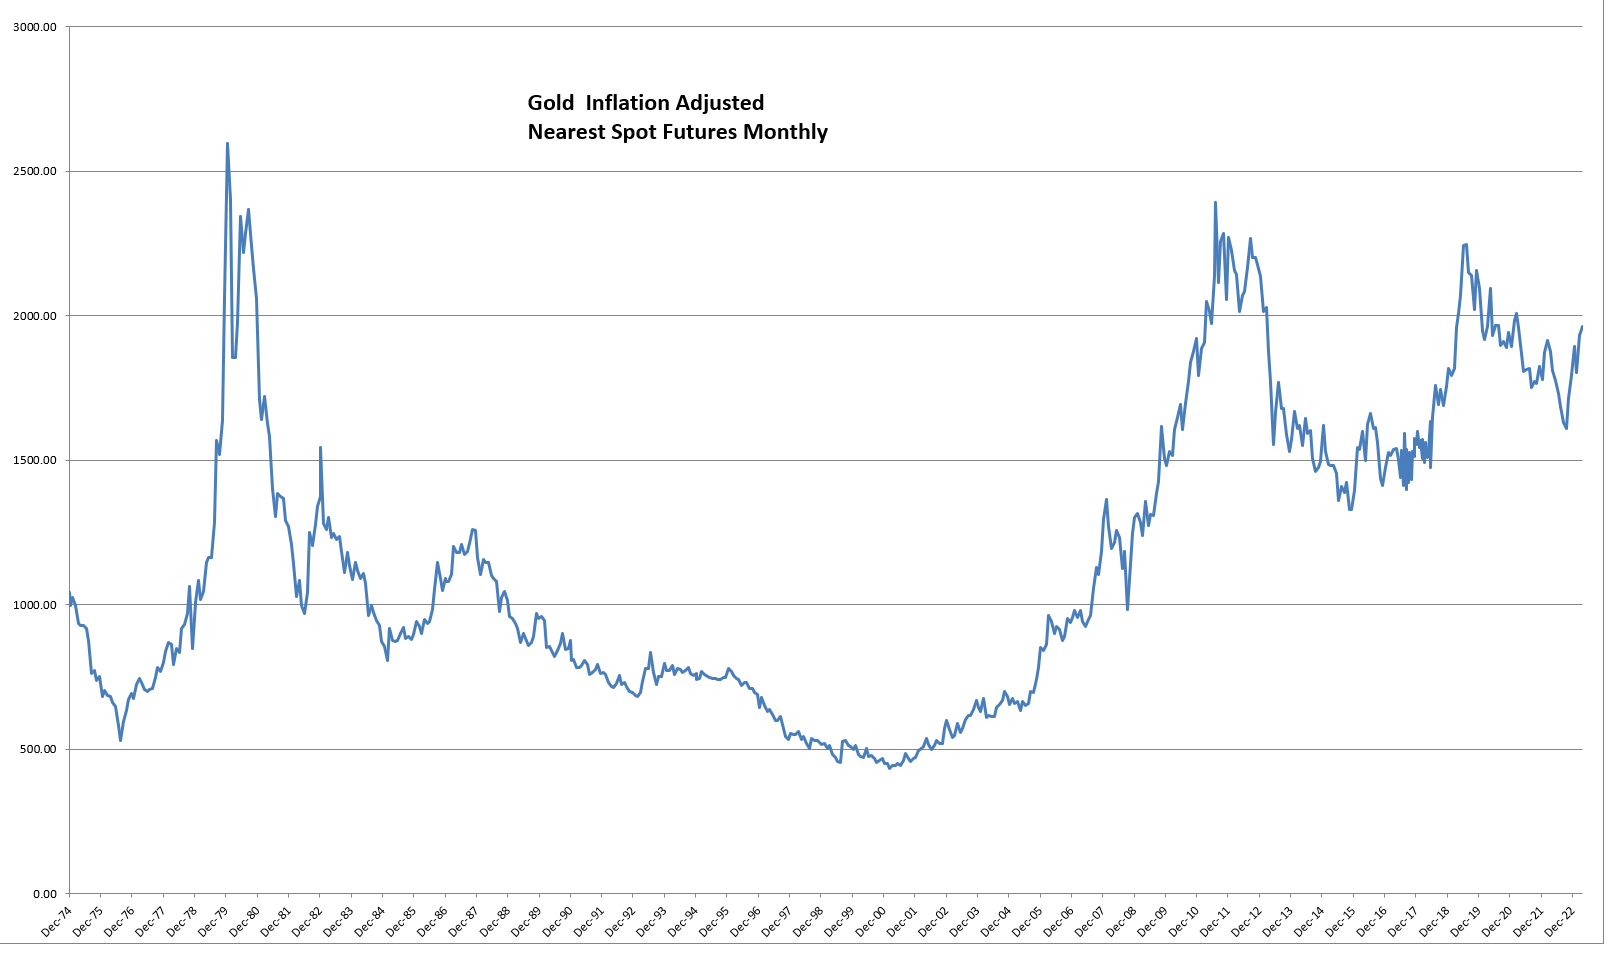
Gold prices have recently traded back toward the record highs and conventional wisdom states that anything above the $2000 level is the ceiling. When adjusted for inflation, gold remains well below the all-time highs set back in the 1970s. Central banks have been on a buying spree in the past year and that brings to question what their thoughts are for the global economy. Socially, gold is a stereotype, from the sarcastic doom and gloom laughter on South Park to the constant barrage of gold advertisements on far right media. Price action may not be as simple as gold coins in your personal bomb shelter.
Gold Futures Nearby Monthly
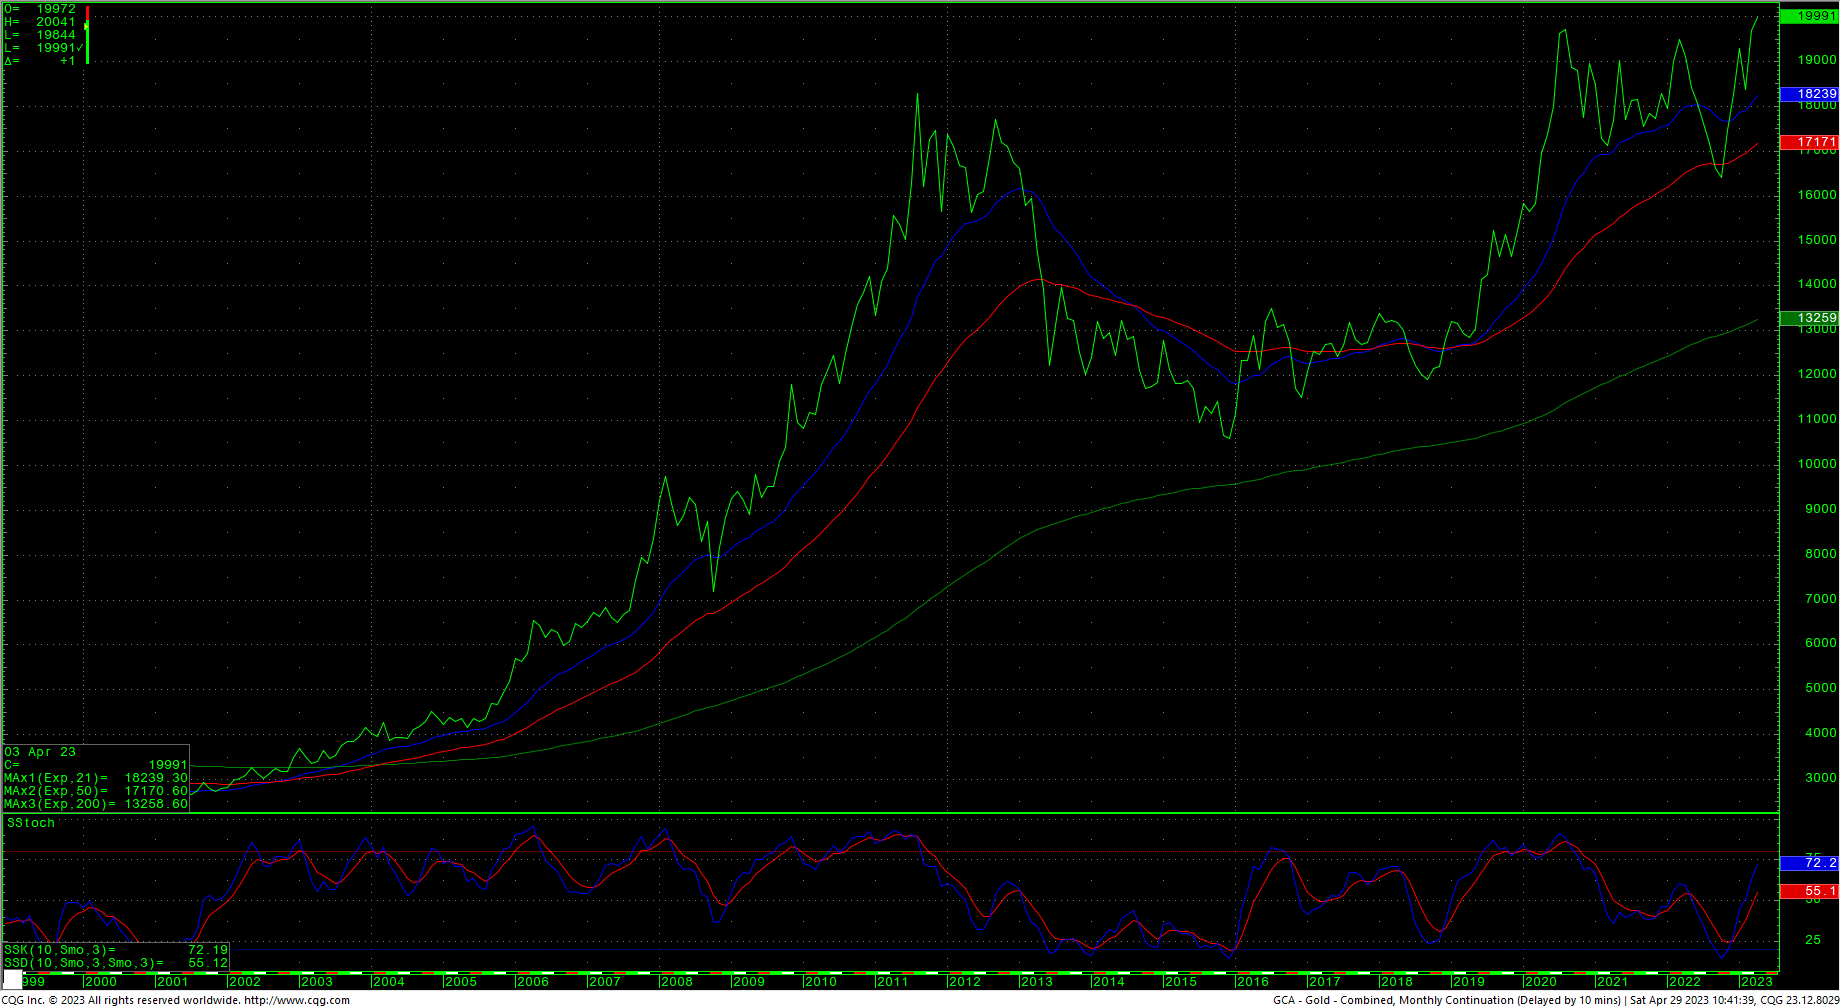
The spot monthly chart has hooked higher with the past six months of rally and April’s close is a new all-time record high, settling just under the $2000 level for nearby futures. The crossroads now; are we looking at a potential triple-top in spot gold against the 2060/2080 level…or could this recent leg, from the September 2022 lows, be the start of a move that will ultimately carry the gold market into new record highs and a test of the inflation-adjusted highs set in the 1970s? From an Elliot Wave perspective, it is possible that the rally from the lows this past February constitutes a one of three, with the trade from the recent top seen as a second wave correction that would be setting the stage for a three of three on both the daily and weekly charts. If the wave scenario holds true, the next rally in gold can be expected to be swift and would minimally carry nearby prices to just over $2500/$2600 spot. There are counts that suggest spot prices could see levels as high as $3600 for nearby futures. Short-term, what will void this pattern? Spot prices breaking down under 1964/1954 area would throw a wrench into the uber-bullish counts and suggest that the triple-top is in. Support is critical against the 1918/1910 area and closes under 1910 in spot would negate all bullish counts and set up 1863 with counts to 1816/1812. Stay tuned.