
TECHNICAL ANALYSIS
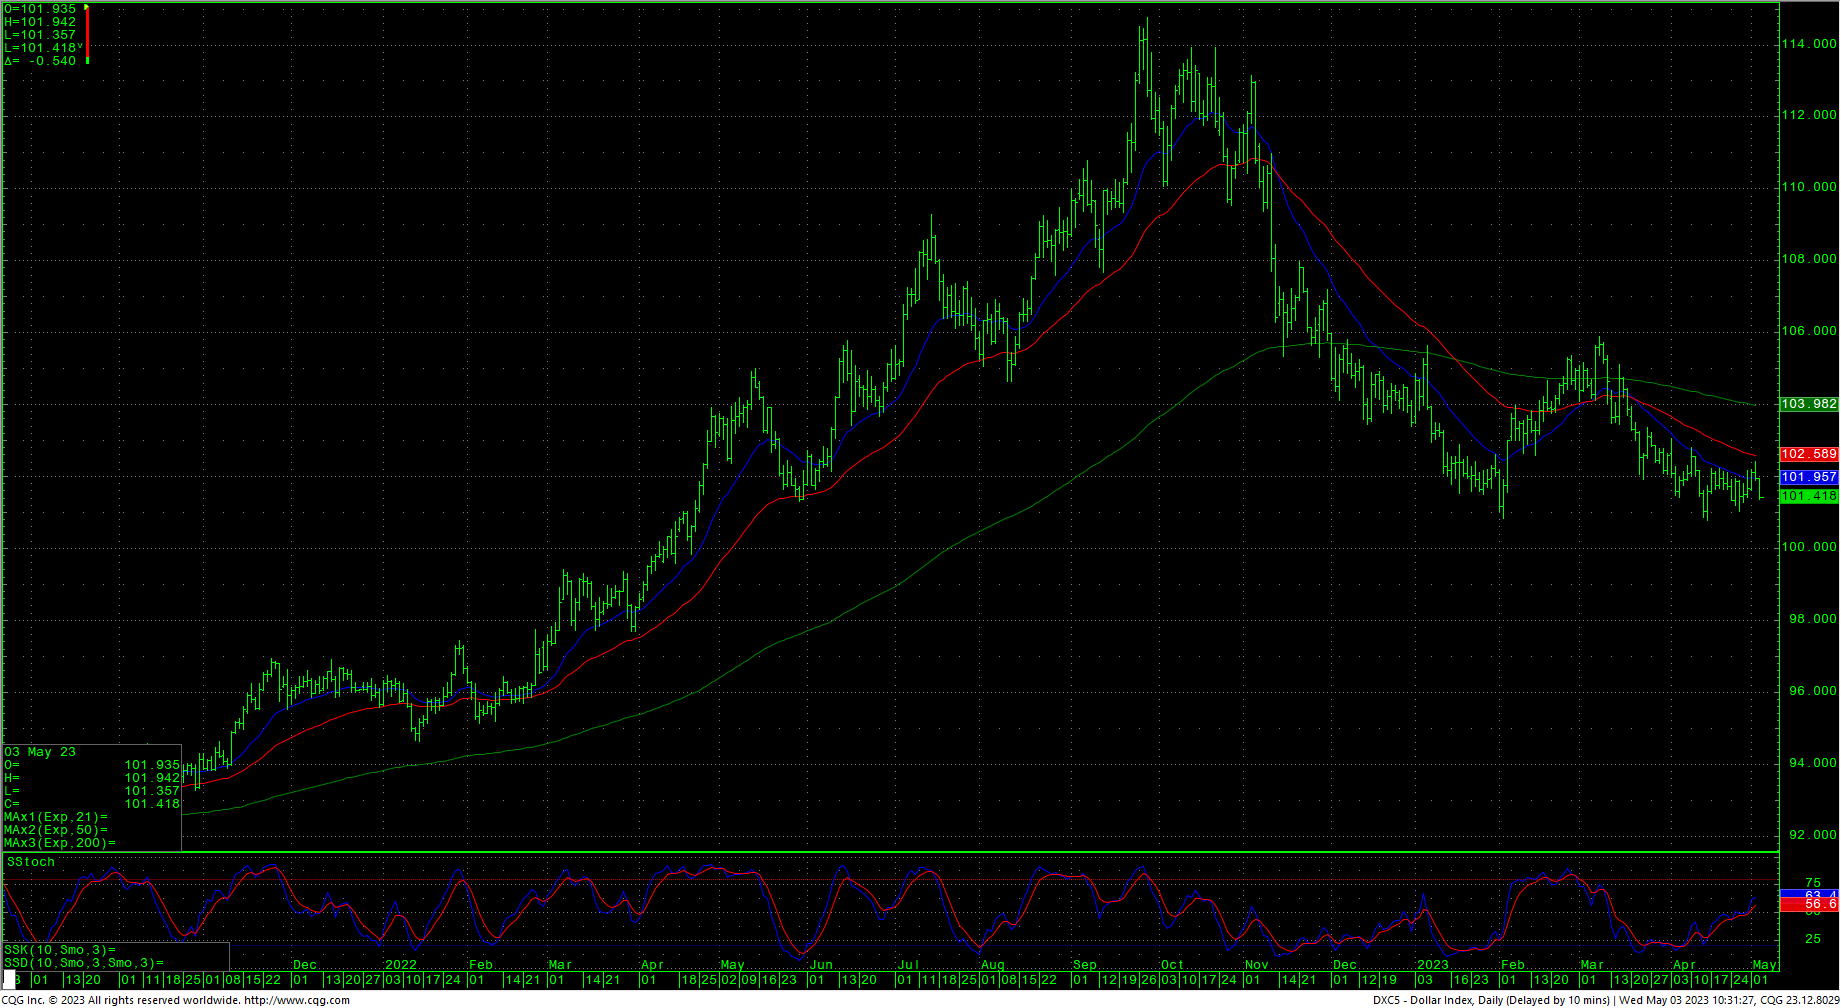
It has been a while since we looked at the charts for the Dollar Index. If you remember in the Fall of 2022, we had outlined some very important timing for the Dollar, writing: “could we be looking at an intermediate and perhaps even longer term high in the US Dollar?” Since late 2022, the Dollar has retraced a little over 50% of the entire move from the early 2021 low at 8921 to the 2022 high at 11477. The weekly chart is in a hook lower in the stochastics after having relieved deeply oversold conditions reached in January with the low of 10082.The daily chart has a double bottom now against that low and prices have been treading water in a very tight range for the past 4-6 weeks. All the daily moving averages are in a downtrend currently and the existing chart pattern appears to be an, intermediate-term, inverted cup and handle pattern. If this pattern holds true, then lower prices are ahead for the US Dollar with the very near-term targets at 9568 with critical monthly support at 9897/9830/9793.
US Dollar Index Monthly H-L-C
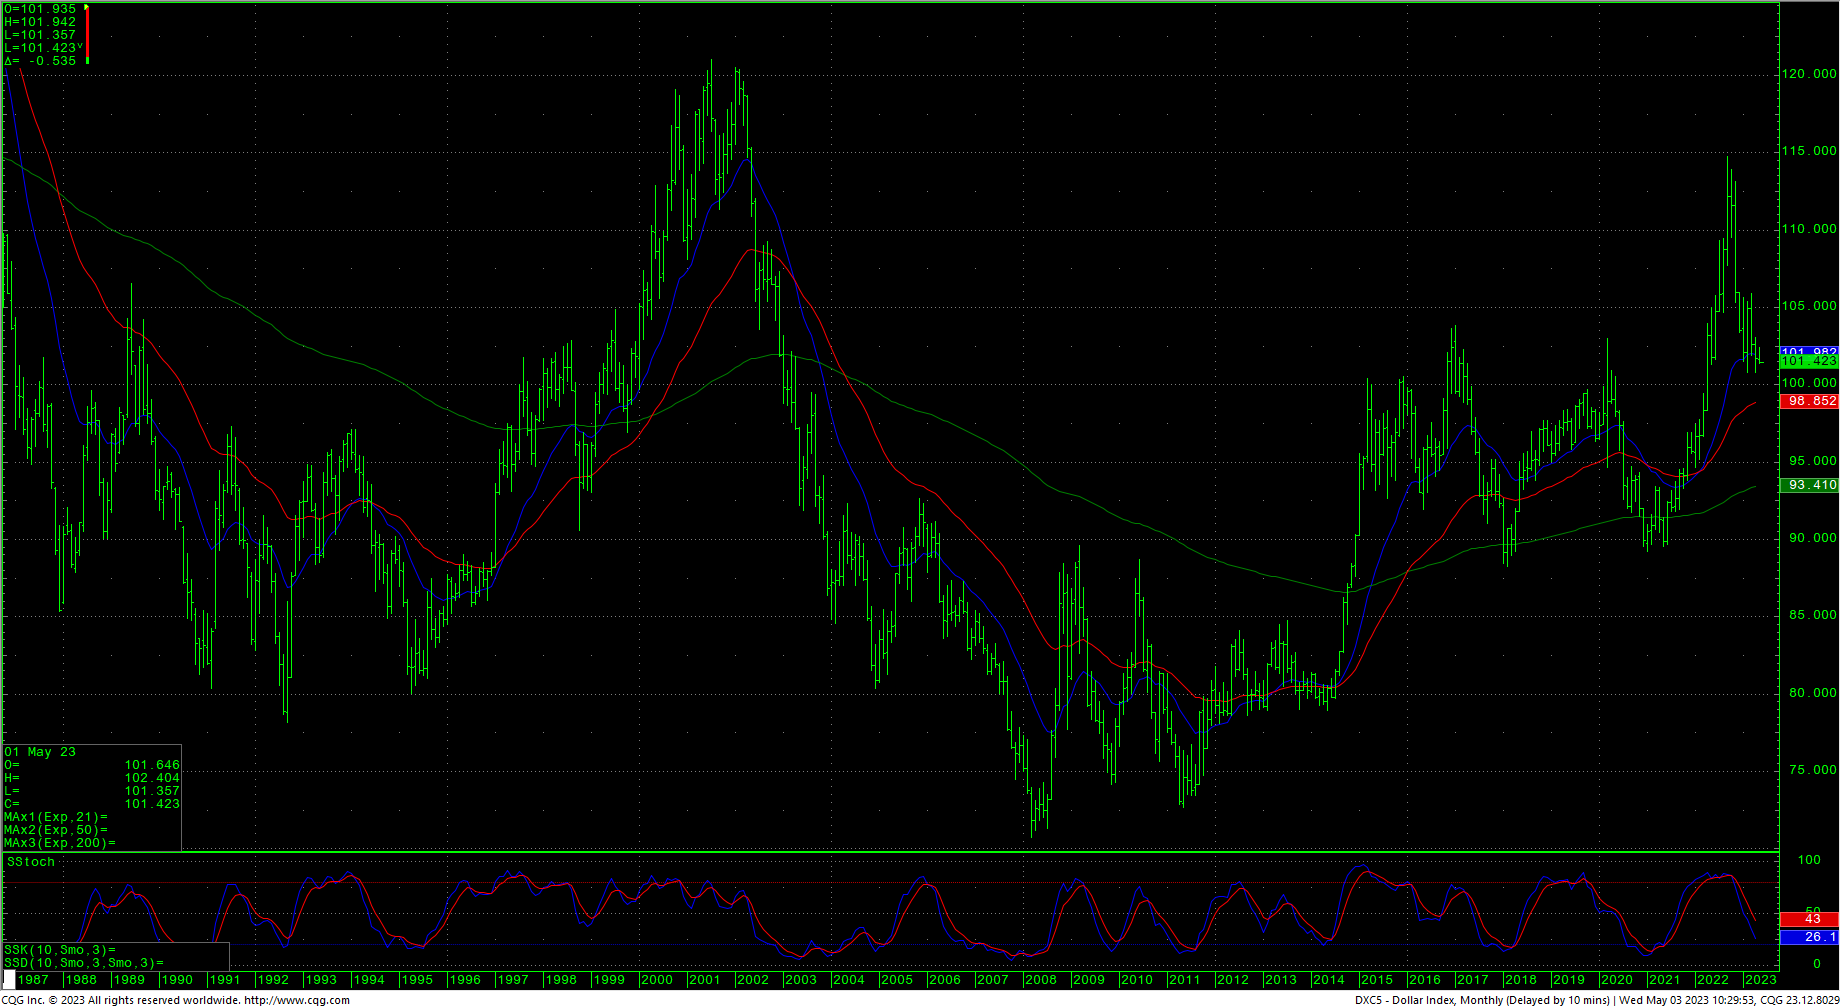
A key point to watch, for the super bears, would be any kind of false breakdown under the double bottom. There are two reasons to be on alert for this. One is that the weekly would still be flashing a preliminary bullish divergence on new lows. The second is the reality that prices are basically testing the 2022 breakout level above the previous multi-year highs of 2020 and 2017.
US Dollar Index Weekly H-L-C
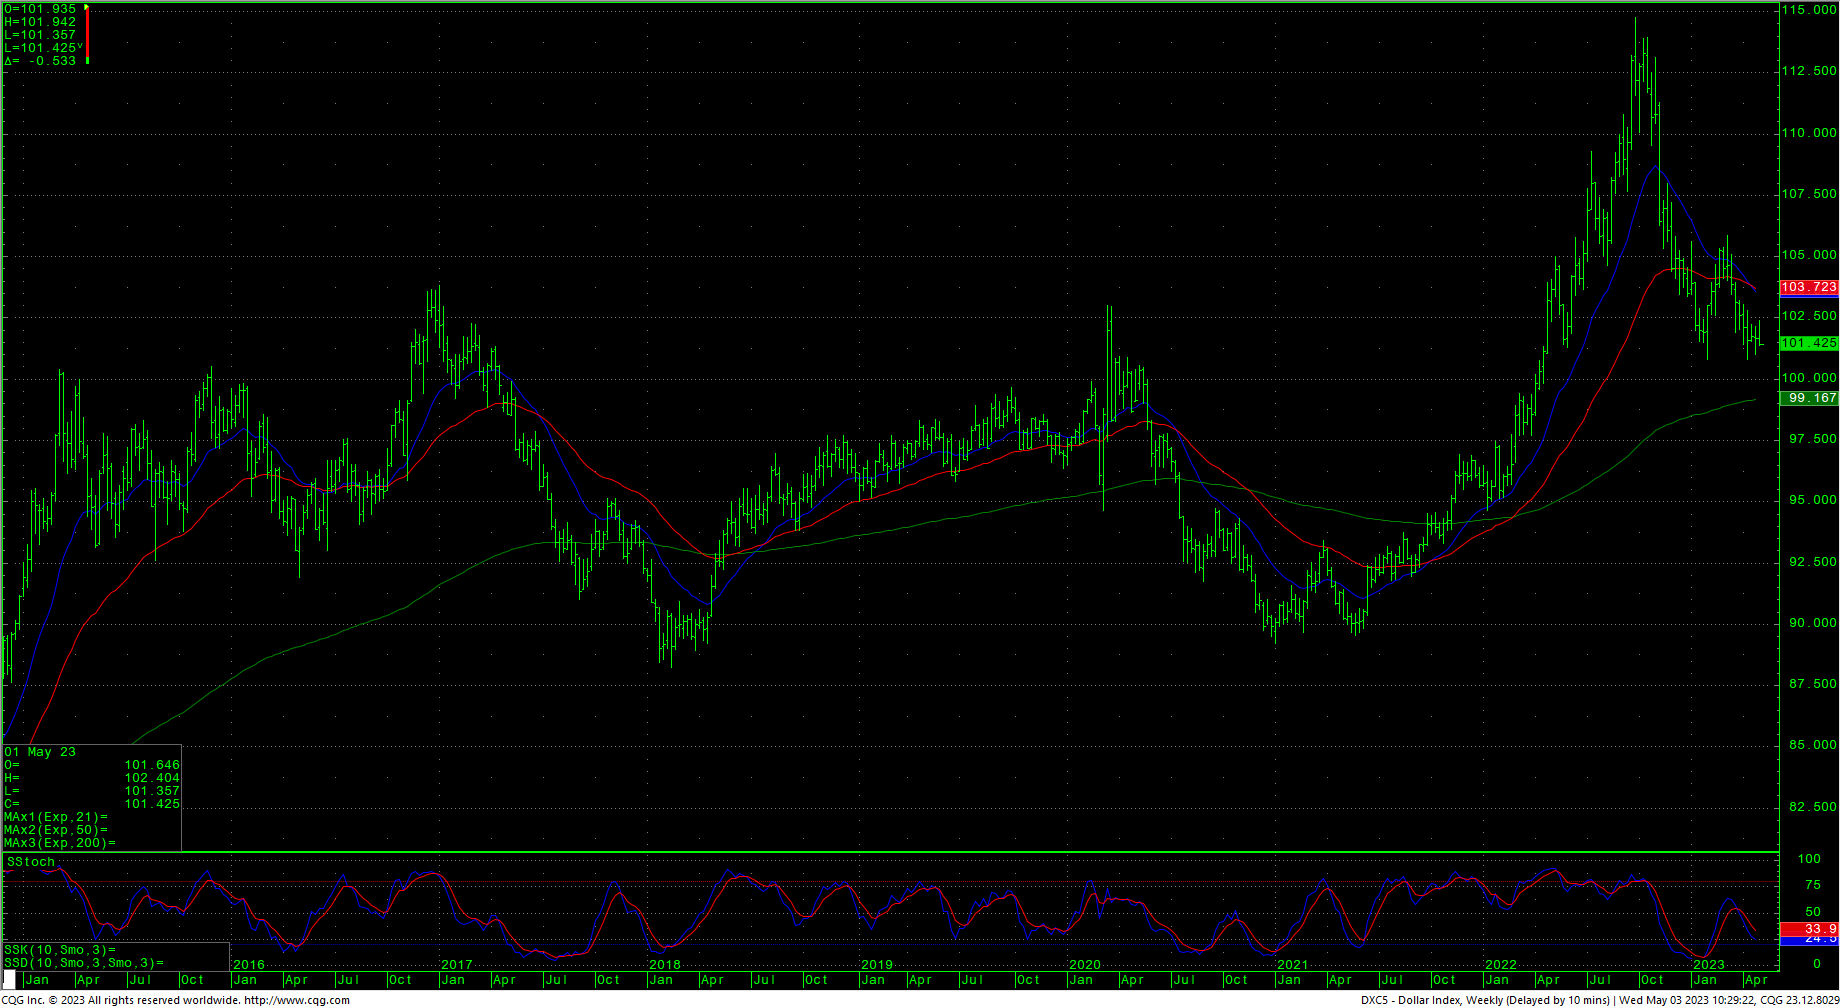
At this juncture, support is pivotal at the double bottom of 10082/10078. A breakdown with closes under 10078 will trigger counts to 9568 with significant long-term support of 9897, 9830 and 9793. The daily would need to see closes under 9793 to keep momentum going toward 9568. There is a critical band of monthly support that runs from 9560 through 9450. That level can be considered a place for a potential bear to terminate.
US Dollar Index Daily H-L-C
Note: The next KEY timing window for the Dollar is the week of May 19, 2023.
Short-term resistance is 10240 and 10280/10290. A drive over 10290 should minimally test 10335 with counts to 10393/10400. Closes over 10400 are near-term friendly to 10588/10615. Daily closes over 10615 set up 10778 with counts to pivotal resistance at 10943/10950. Closes over 10950 will open counts to 11128/11147. Daily closes over 11147 open counts to 11315 and possibly 11478.
Support
- 10082/10078 *** ↓
- 9897 *** ↓
- 9830 *** ↓
- 9793 *** ↓
- 9670 **
- 9568 *** ↓
- 9488/9450 *** ↓
- 9327 **
- 9180/9150 *** ↓
- 9050 **
- 8950/8930 *** ↓
- 8850/8825 *** ↓
Resistance
- 10240 **
- 10290 *** ↑
- 10335 *** ↑
- 10393/10400 *** ↑
- 10500 **
- 10588 ***
- 10615 *** ↑
- 10700 **
- 10775/10778 *** ↑
- 10840 **
- 10943/10950 *** ↑
- 11030 **
- 11128/11147 *** ↑
- 11226 ** ↑
- 11315 *** ↑
- 11470/11480 *** ↑
Charts courtesy of CQG, Inc.