
Timing
TECHNICAL ANALYSIS
Major Indices Week of May 5, 2023
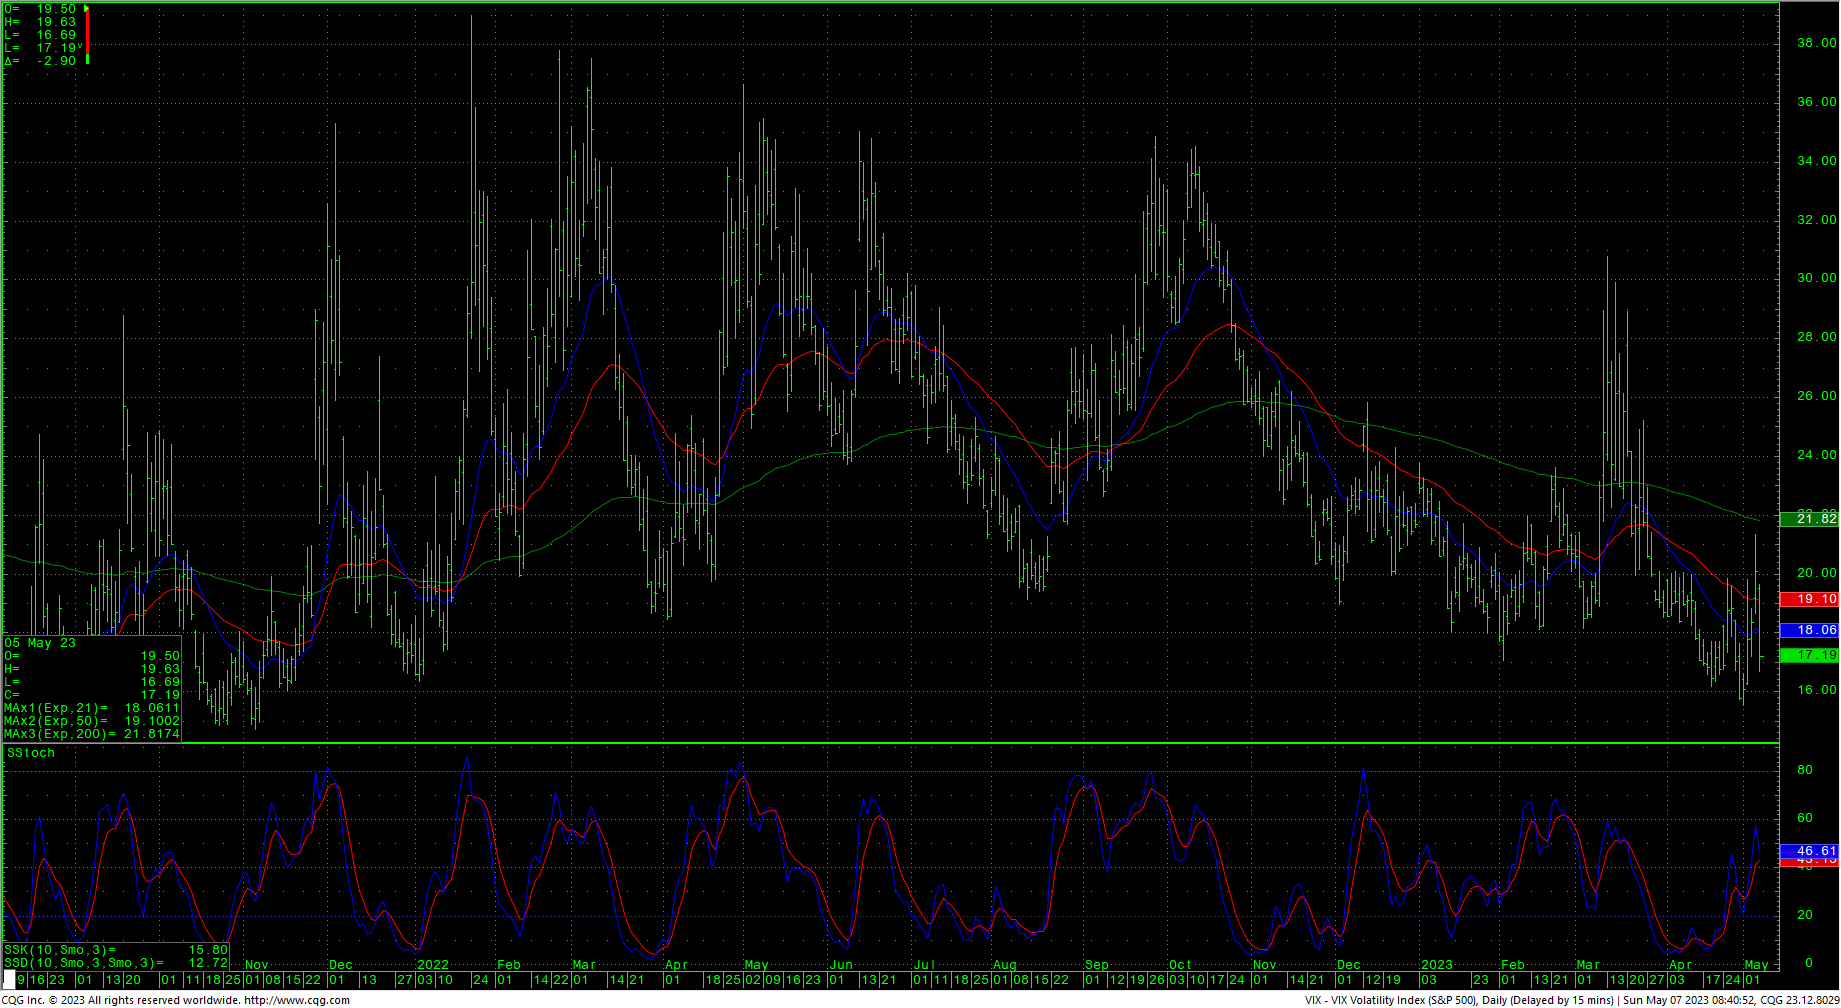
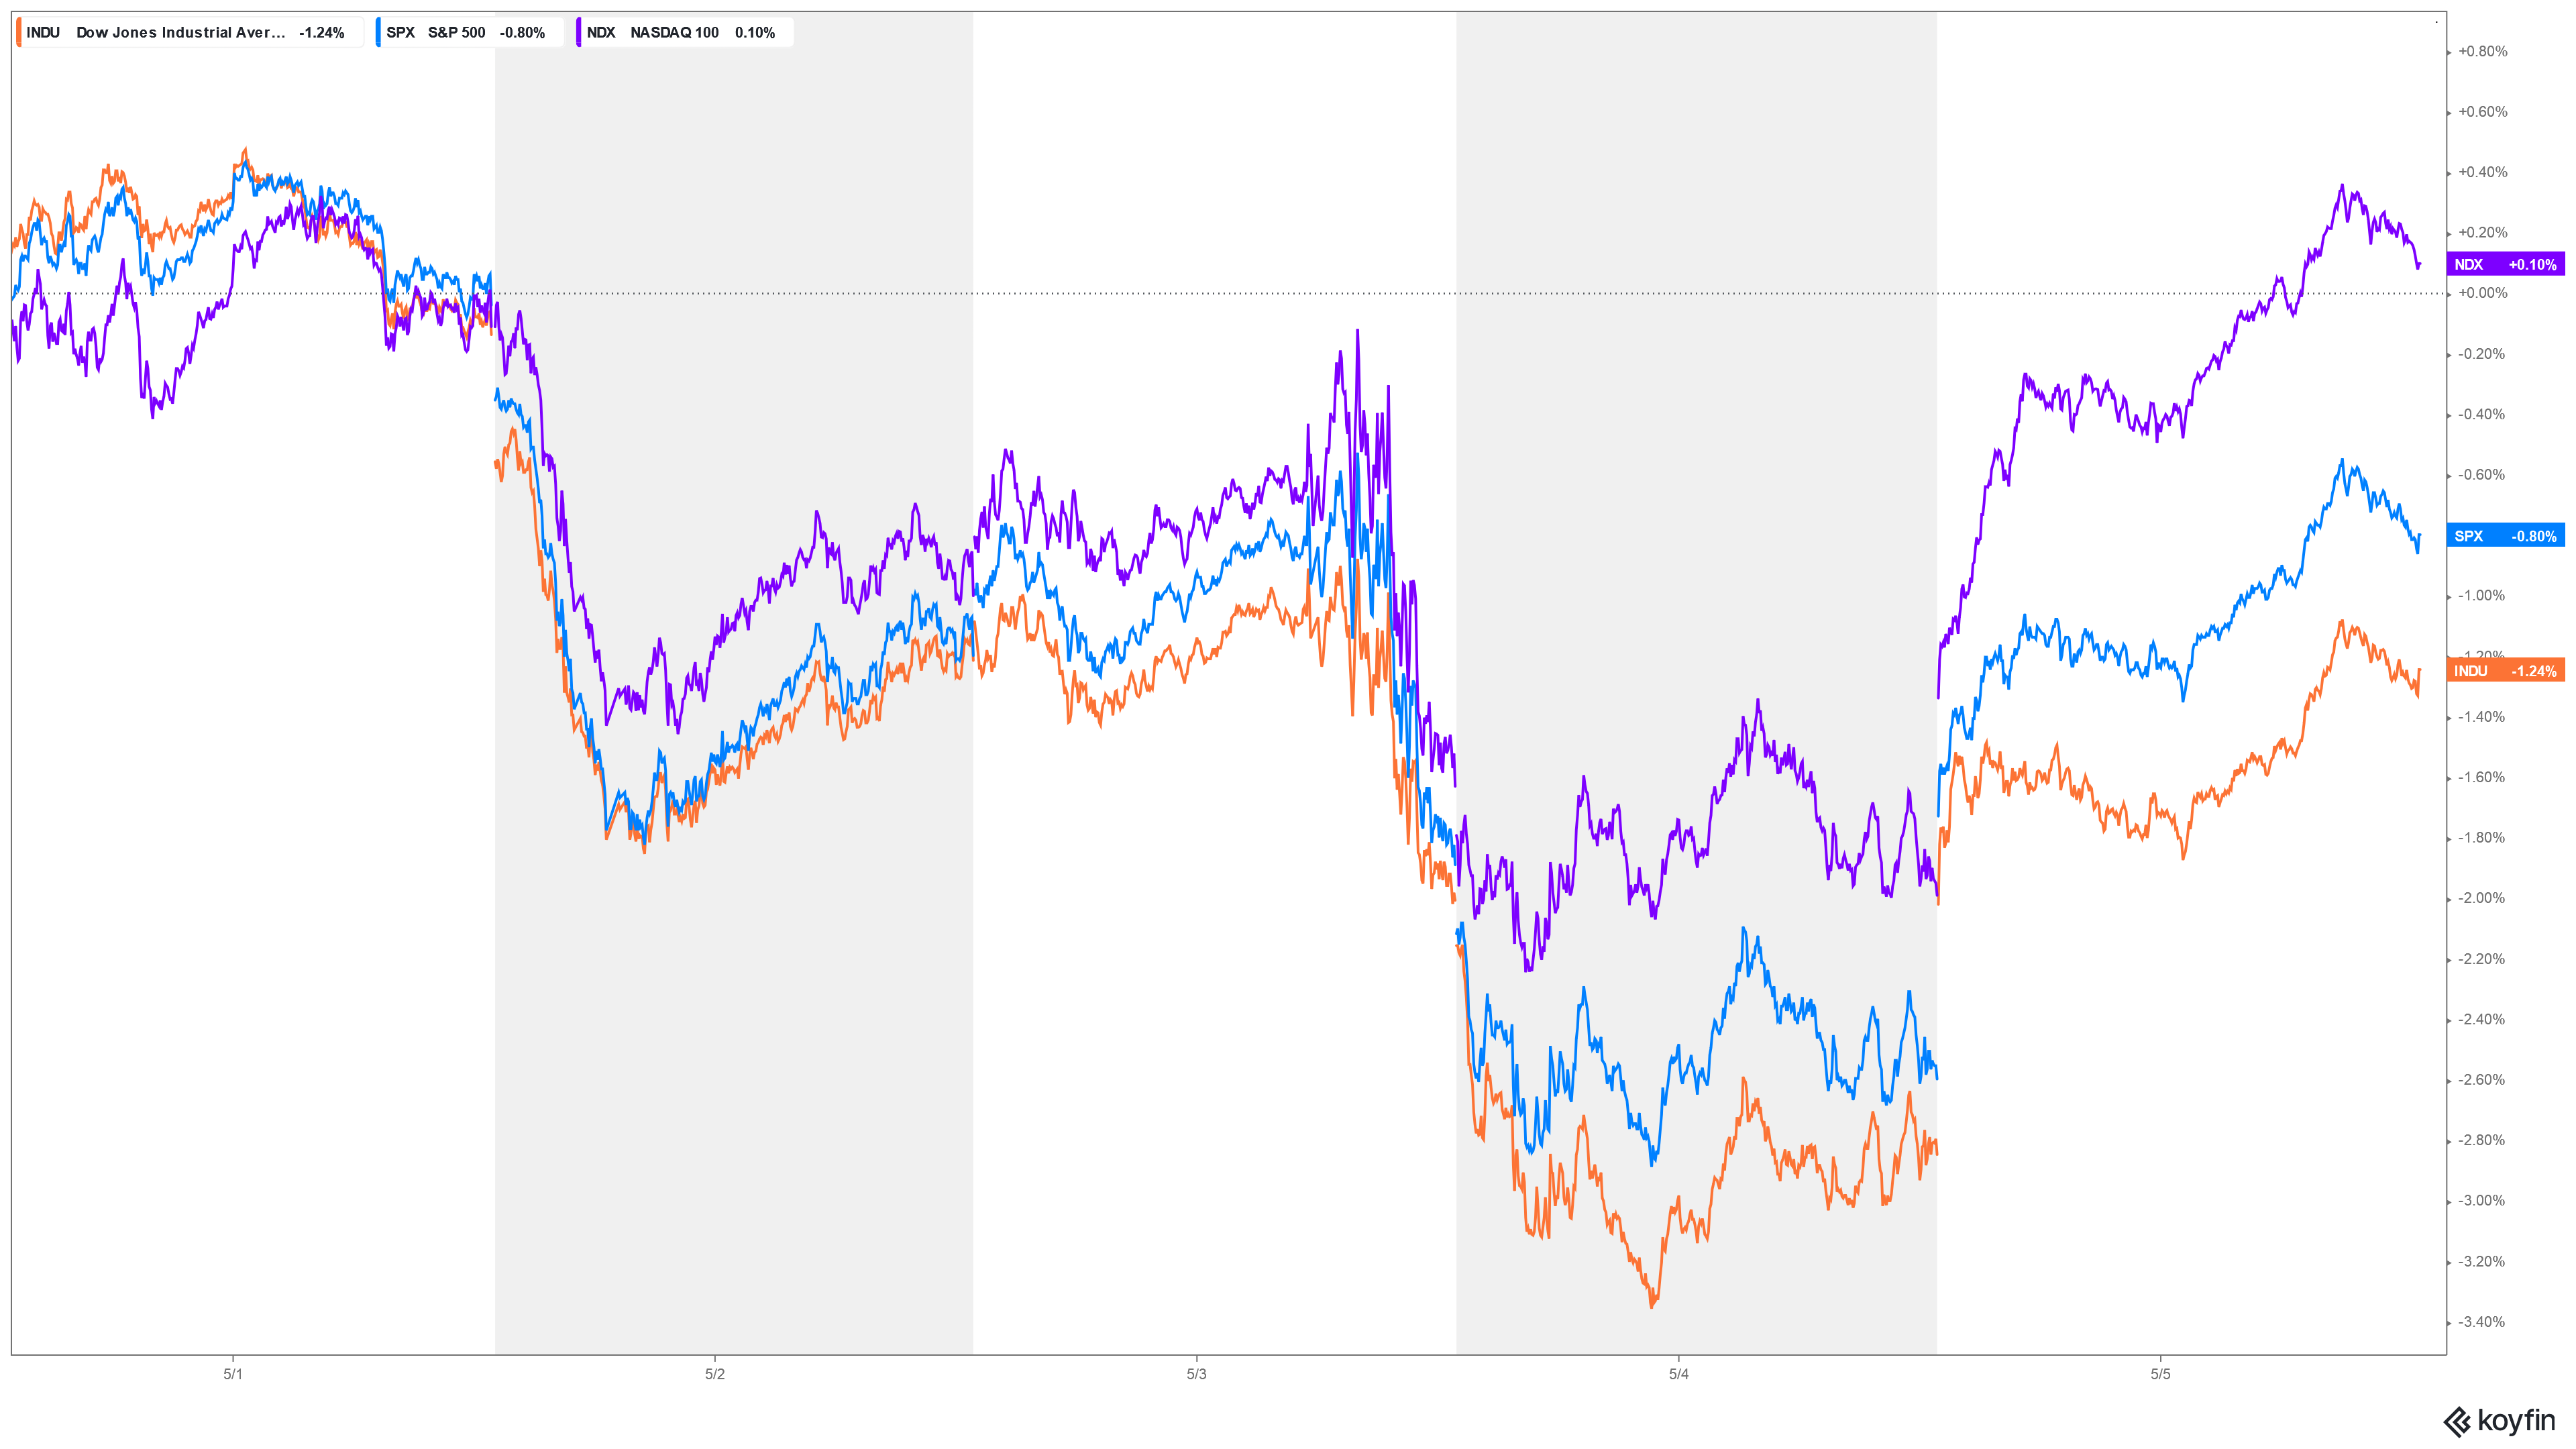 Note: For the latest update on the US Dollar, click here. Stocks set a swing high in Monday’s minor timing and then swooned sharply to four week lows (on Thursday’s key timing) before staging a sharp rally on Friday to erase much of the week’s losses…but saw most major indices close lower, toward the middle of the second outside week’s range in a row. The week’s trade registered as bearish candles for both the Dow and S&P. The Dow closed the week down -1.24%, the S&P was off -0.80% and the Nasdaq ended the week up fractionally, closing +0.07%. The volatile action leaves sentiment in a neutral to greedy posture. The weekly stochastics and moving averages remain in uptrends. The VIX remains frothy while the 52-week, A/D line moved lower again to a reading of -0.33%. The Commitment of Traders (CoT) data tends to disagree with the “Sell in May and go away” psychology…and an argument can be made that smart money is positioned for rallies, and a question can be raised; Would new 2023 trading highs in the S&P (above 4195) instead lead to FOMO by those on the sidelines? The short-term charts are only slightly overbought with Friday’s close and the Dow has bumped against minor but pivotal resistance at 33753/33760.
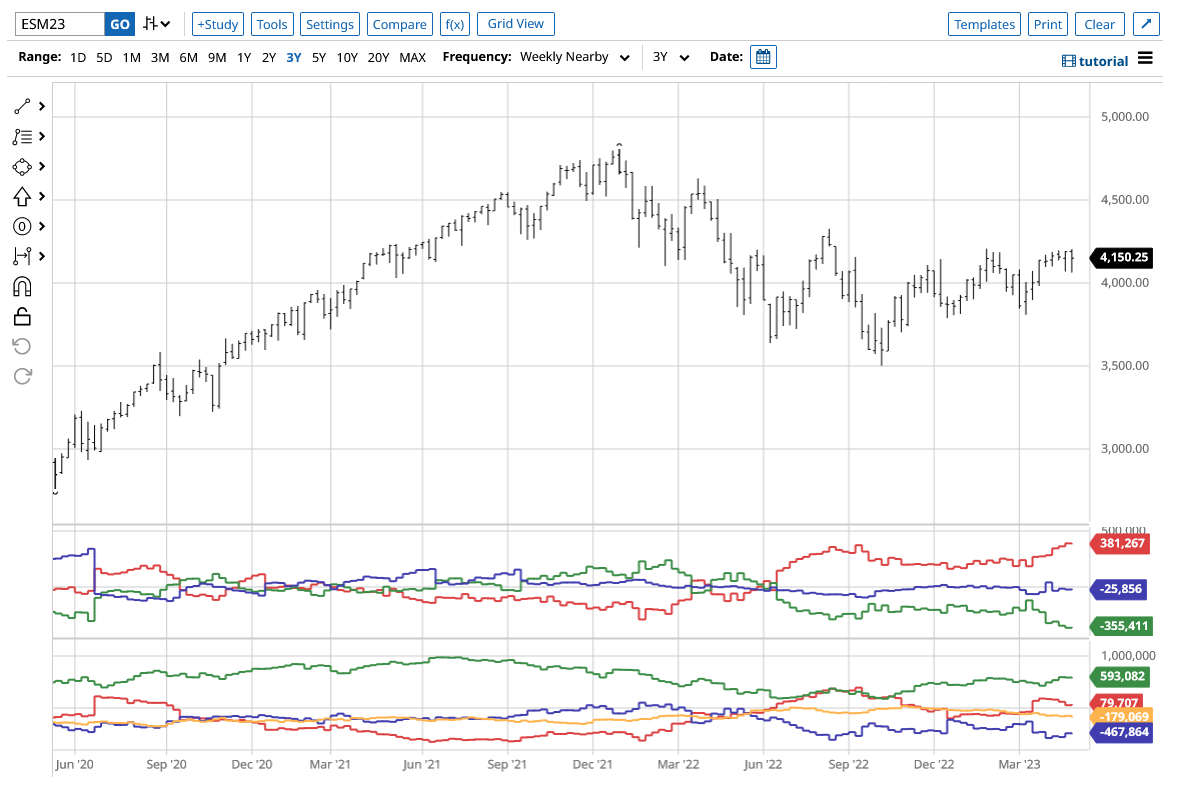
Commitment of Traders June S&P

Timing Points May 2023
- 05/09 ** minor
- 05-15/16 *** X Key week (Critical)
- 05/25 ** minor
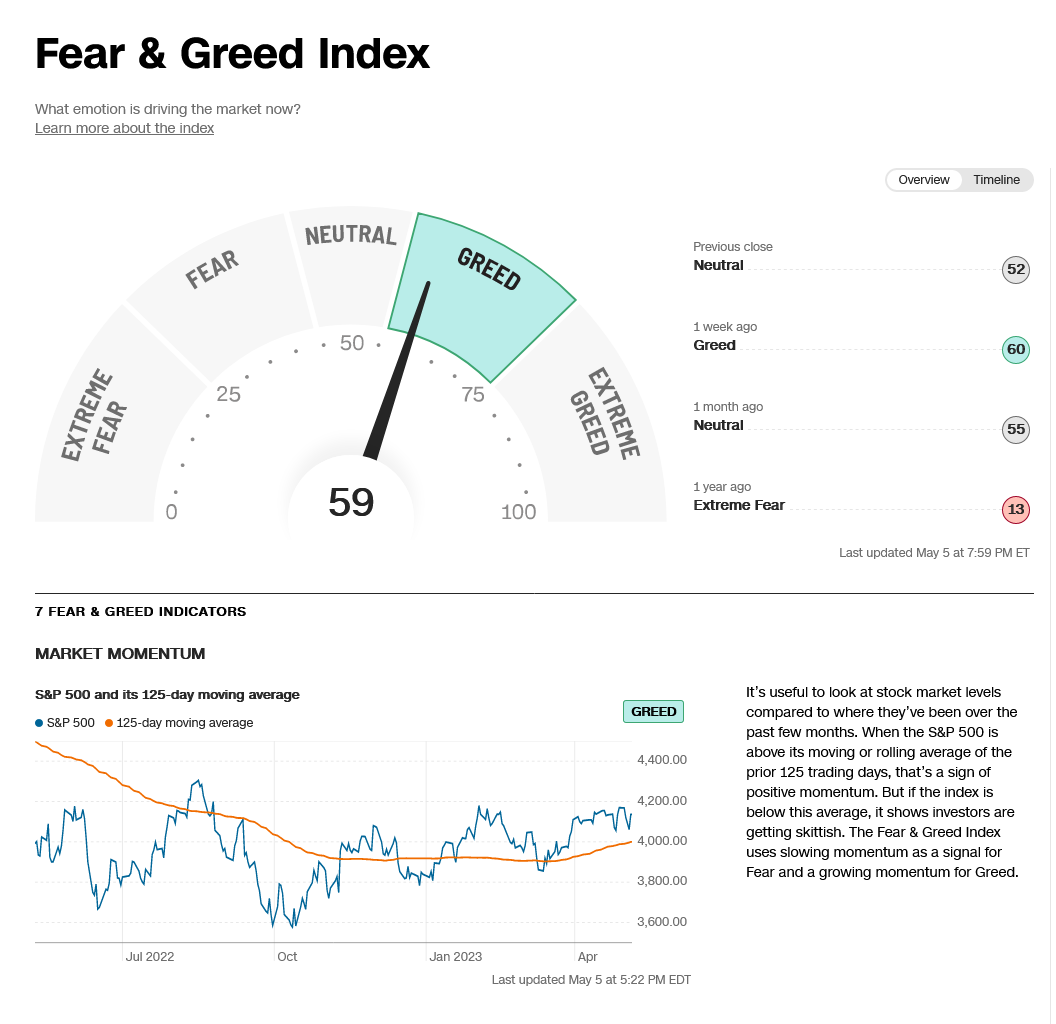
CNN Fear & Greed Index
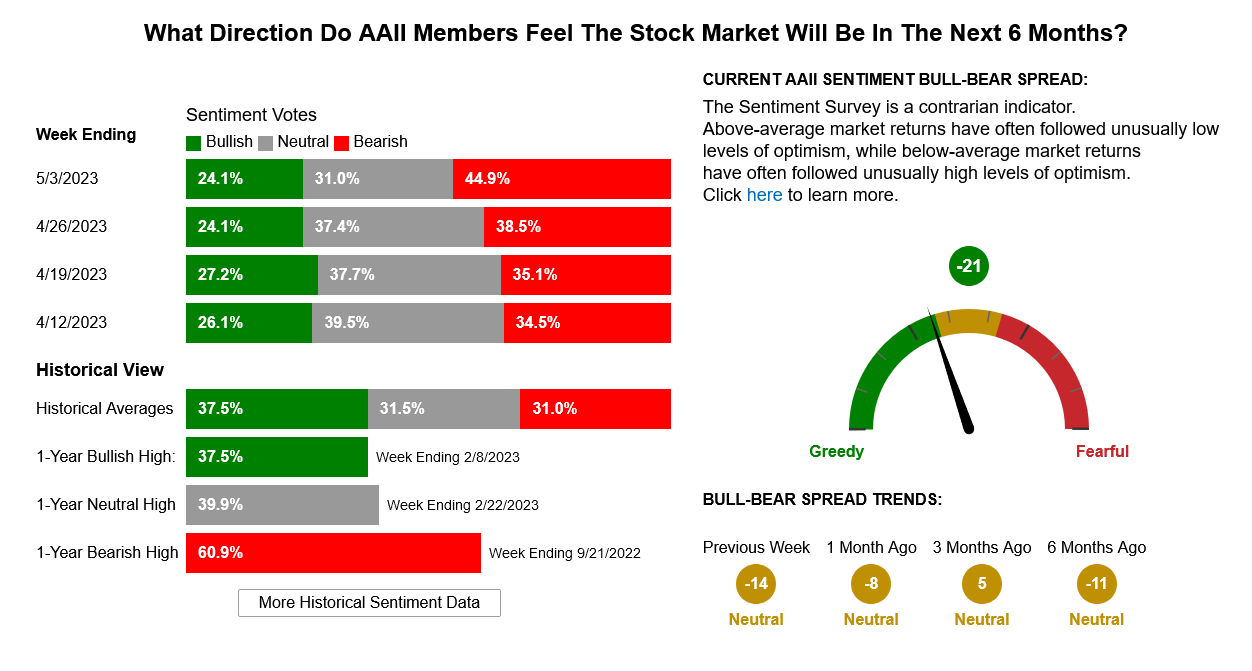
AAII Investor Sentiment Survey
VIX Daily
Dow Jones Industrial Average Weekly HLC
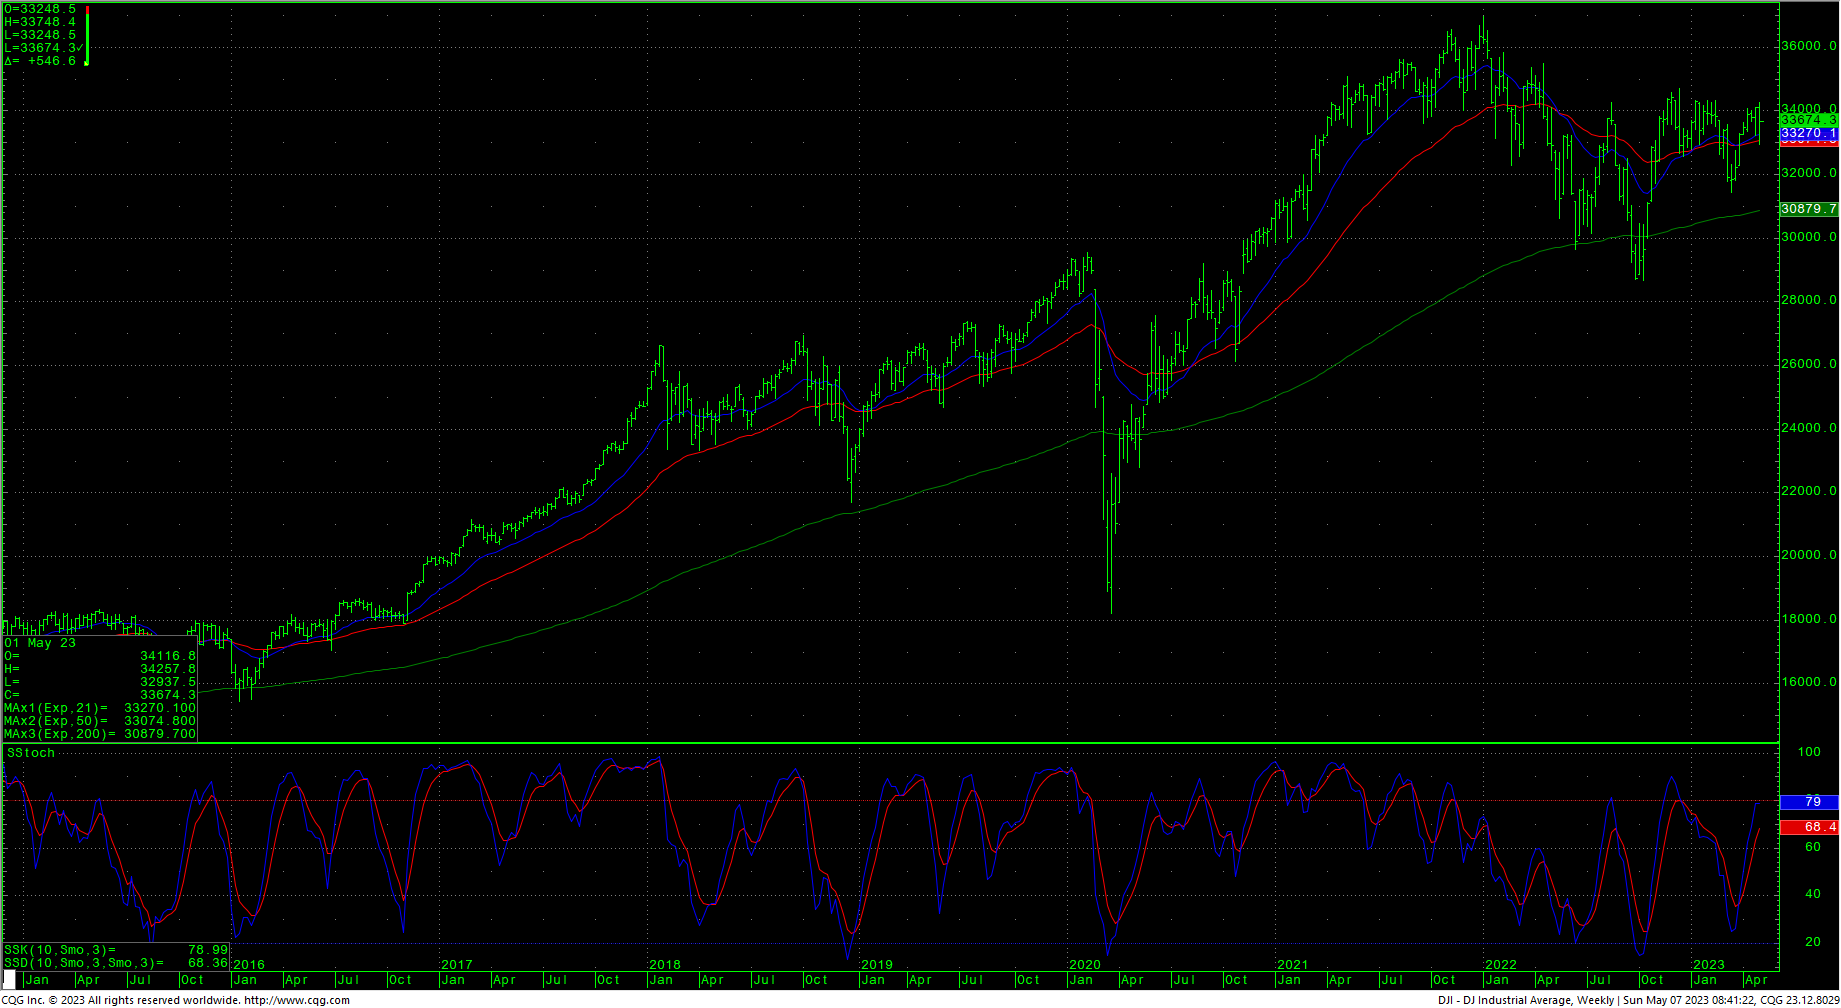
As mentioned above, the Dow is testing minor pivotal resistance at 33753/33760. A continued drive above 33760 should test 33927/33946 with a shot at last Monday’s high at 34257. Expect resistance to continue at 34222/34257 and 34334/34342. Closes over 34342 are friendly. A drive over 34712 can test significant long-term resistance at 34879 and 34995 and offers full counts back critical resistance at 35492. Closes over 35492 will open counts to 35824. Closes over 35492 should minimally test a gap area on the daily at 35996 to 36044.
Support for the Dow is at 33590/33557 and a breakdown under this area should see 33438, 33407, 33342 and possibly pivotal support of 33247 through 33177. A breakdown under 33177 sets up 32843 with counts to critical support of 32510/32500. Closes under 32500 set up a move to intermediate support in the 31727/31686 level. A breakdown with closes under 31686 will open counts into the 30972/30960 level with support of 31429/31423 and 31160. There is a gap on the daily chart that runs from 31160 to 31119.
Resistance
- 33753/33760 *** ↑
- 33927/33946 *** ↑
- 34092 **
- 34130 **
- 34222/34257 *** ↑
- 34334/34342 *** ↑
- 34395 **
- 34495 **
- 34595 **
- 34712 *** ↑
- 34879 ***
- 34995 *** ↑
- 35112 **
- 35225 **
- 35372 ***
- 35492 *** ↑
- 35800/35824 *** ↑
- 35996 ***
- 36044 **
- 36168 **
- 36513 *** ↑
- 36799/36952 *** ↑
Support
- 33590/33557 *** ↓
- 33348 **
- 33407 *** ↓
- 33342 *** ↓
- 33247 *** ↓ through
- 33177 *** ↓
- 33060 **
- 32937 *** ↓
- 32843 *** ↓
- 32683 *** ↓
- 32510/32500 *** ↓
- 32396 **
- 32295 ** ↓
- 32136/32097 *** ↓
- 31950 **
- 31828/31805 *** ↓
- 31727 ***
- 31686 *** ↓
- 31624 ***
- 31530 **
- 31429/31423 *** ↓
S&P 500 Cash Index
The S&P is slightly overbought on the hourly chart with Friday’s rally. Resistance is now 4147/4148, 4164 and 4186. Continued rallies with should test the overhead gap area at 4203 to 4218 and longer-term counts to critical resistance of 4311/4315. Daily closes over 4315 open counts to 4385 with full potential to long-term critical resistance of 4486/4505. Closes over 4505 can carry to 4593 with full potential toward 4637. A breakout above 4637 opens potential toward 4748 and ultimately 4818.
S&P 500 Index Weekly HLC
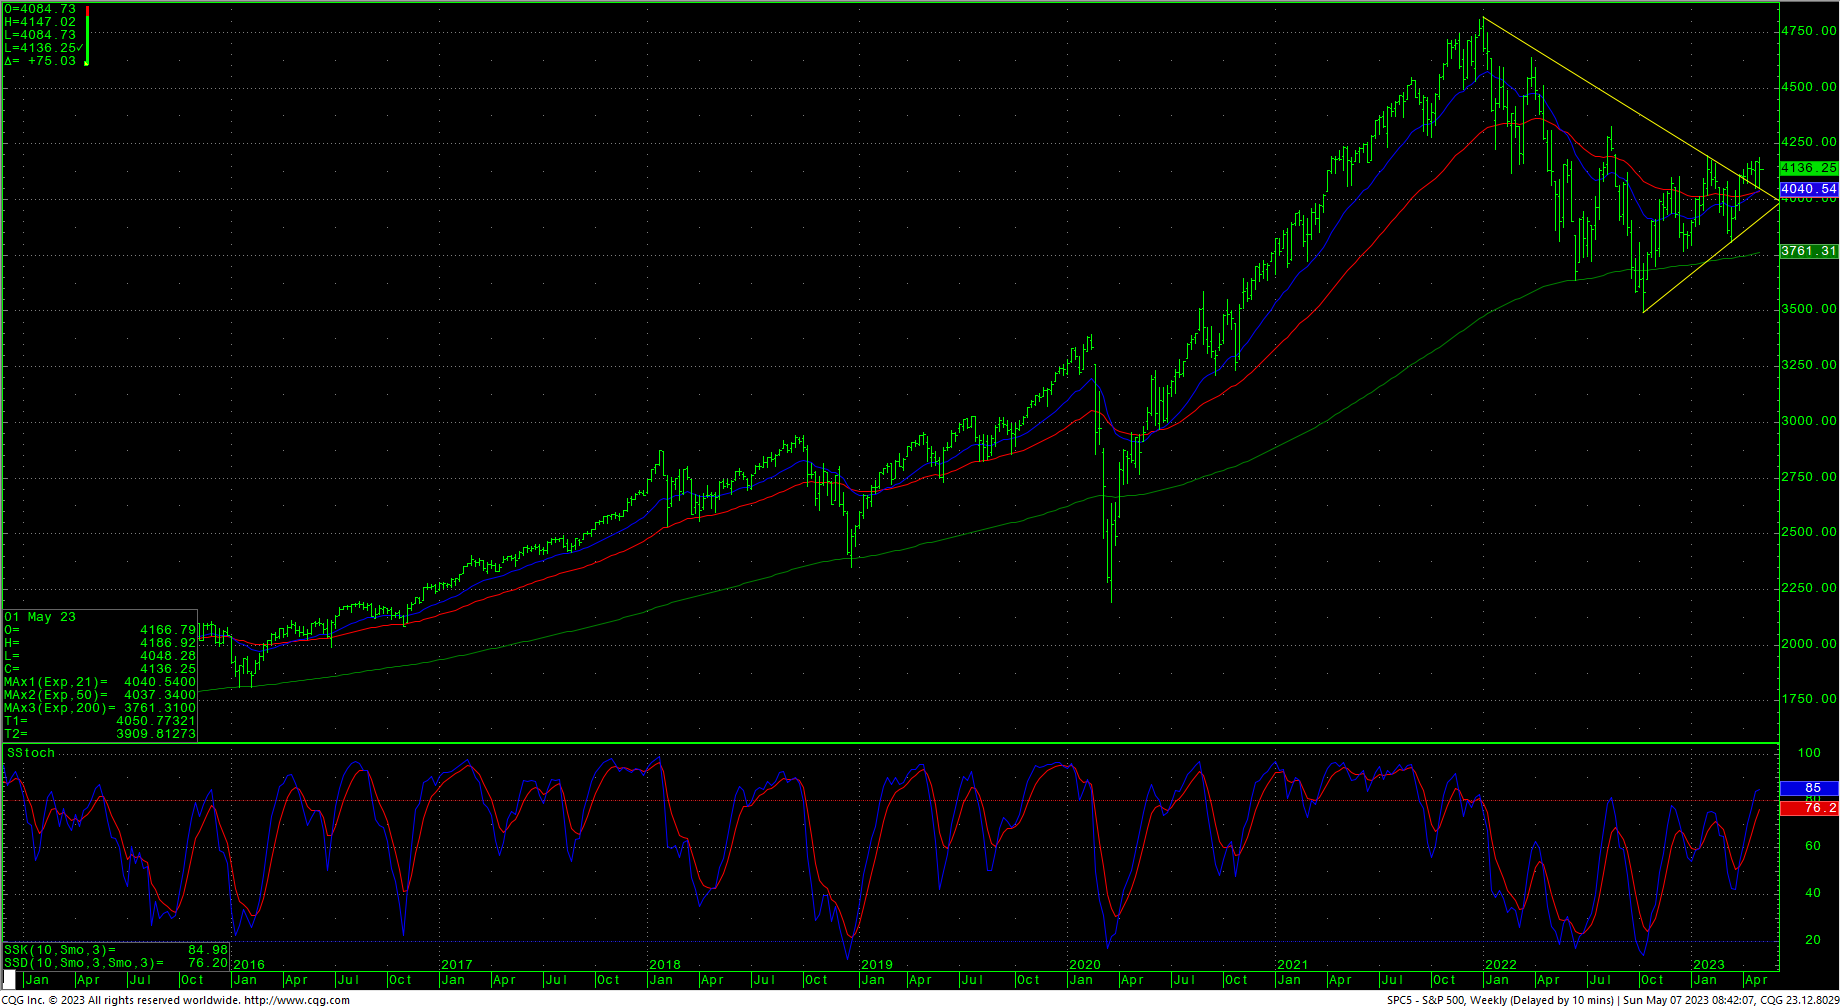
Support is 4123 and 4109. A breakdown under 4109 counts to 4097/4083. A breakdown under 4083 should retest 4058/4057 with counts to 4031/4028. Closes under the 4028 level should carry to 3989 with counts to pivotal near-term support of 3946/3940. Closes under 3940 setup a retest of 3868/3865. A breakdown under 3865 can test 3808 through 3797. A breakdown with closes under 3799/3797 opens counts to critical support against the 3760/3750 level. Under 3750 sets up a move to 3657 and full potential back to critical long-term support of 3505/3491.
Resistance
- 4147/4148 *** ↑
- 4164 **
- 4186 *** ↑
- 4203/4218 ***
- 4311/4315 *** ↑
- 4350 **
- 4385 *** ↑
- 4430 **
- 4486 *** ↑
- 4505 *** ↑
- 4593 **
- 4637 *** ↑
- 4665 **
- 4748 *** ↑
- 4818 *** ↑
Support
- 4123 *** ↓
- 4109 *** ↓
- 4097/4083 *** ↓
- 4058/4057 *** ↓
- 4031/4028 ***↓
- 4002 **
- 3965 **
- 3946/3940 *** ↓
- 3868/3865 *** ↓
- 3845 **
- 3808 *** ↓
- 3799/3797 *** ↓
- 3760/3750 *** ↓
- 3667/3657 *** ↓