
TECHNICAL ANALYSIS
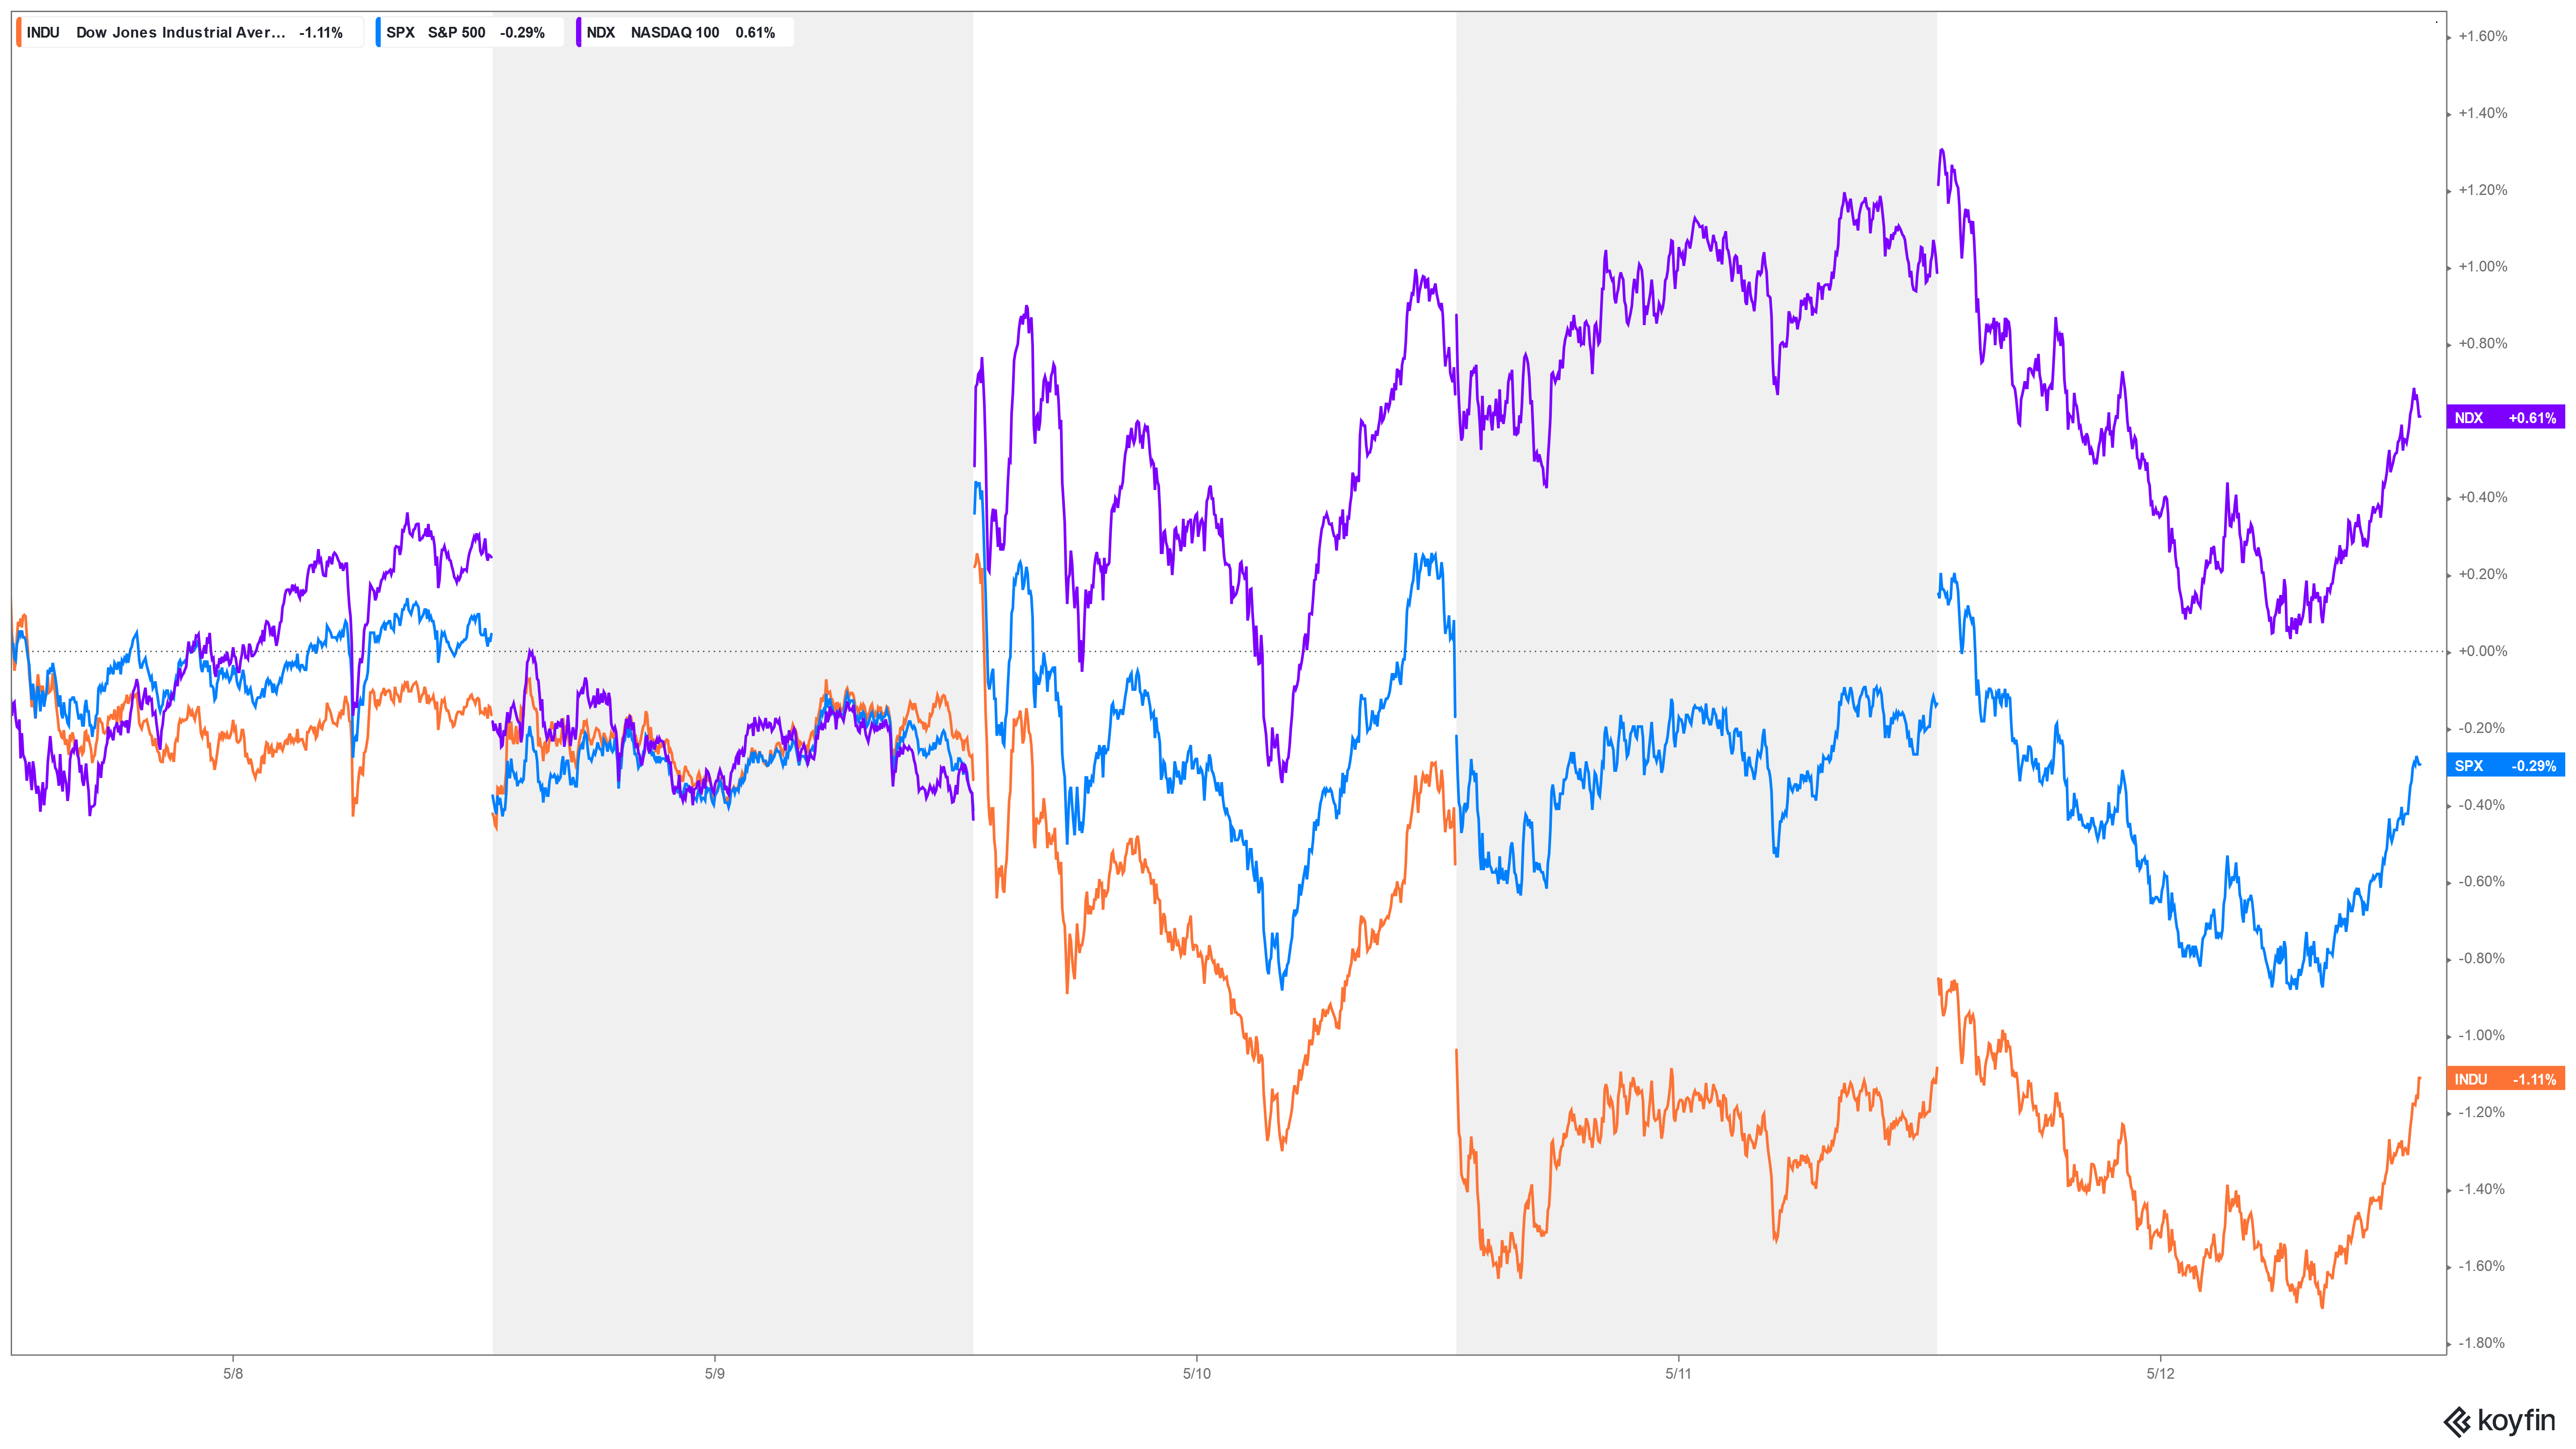
Major Indices Week of May 12, 2023
United States Michigan Consumer Sentiment
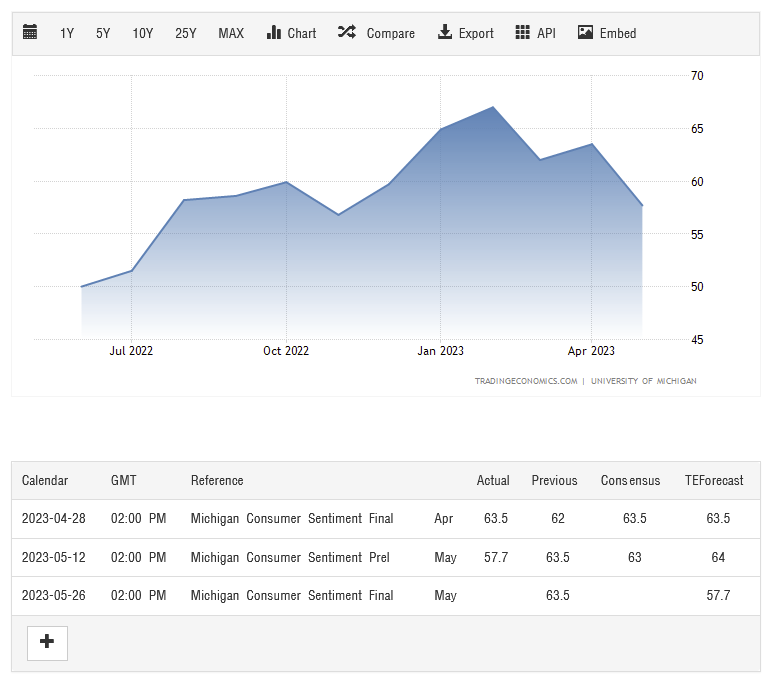
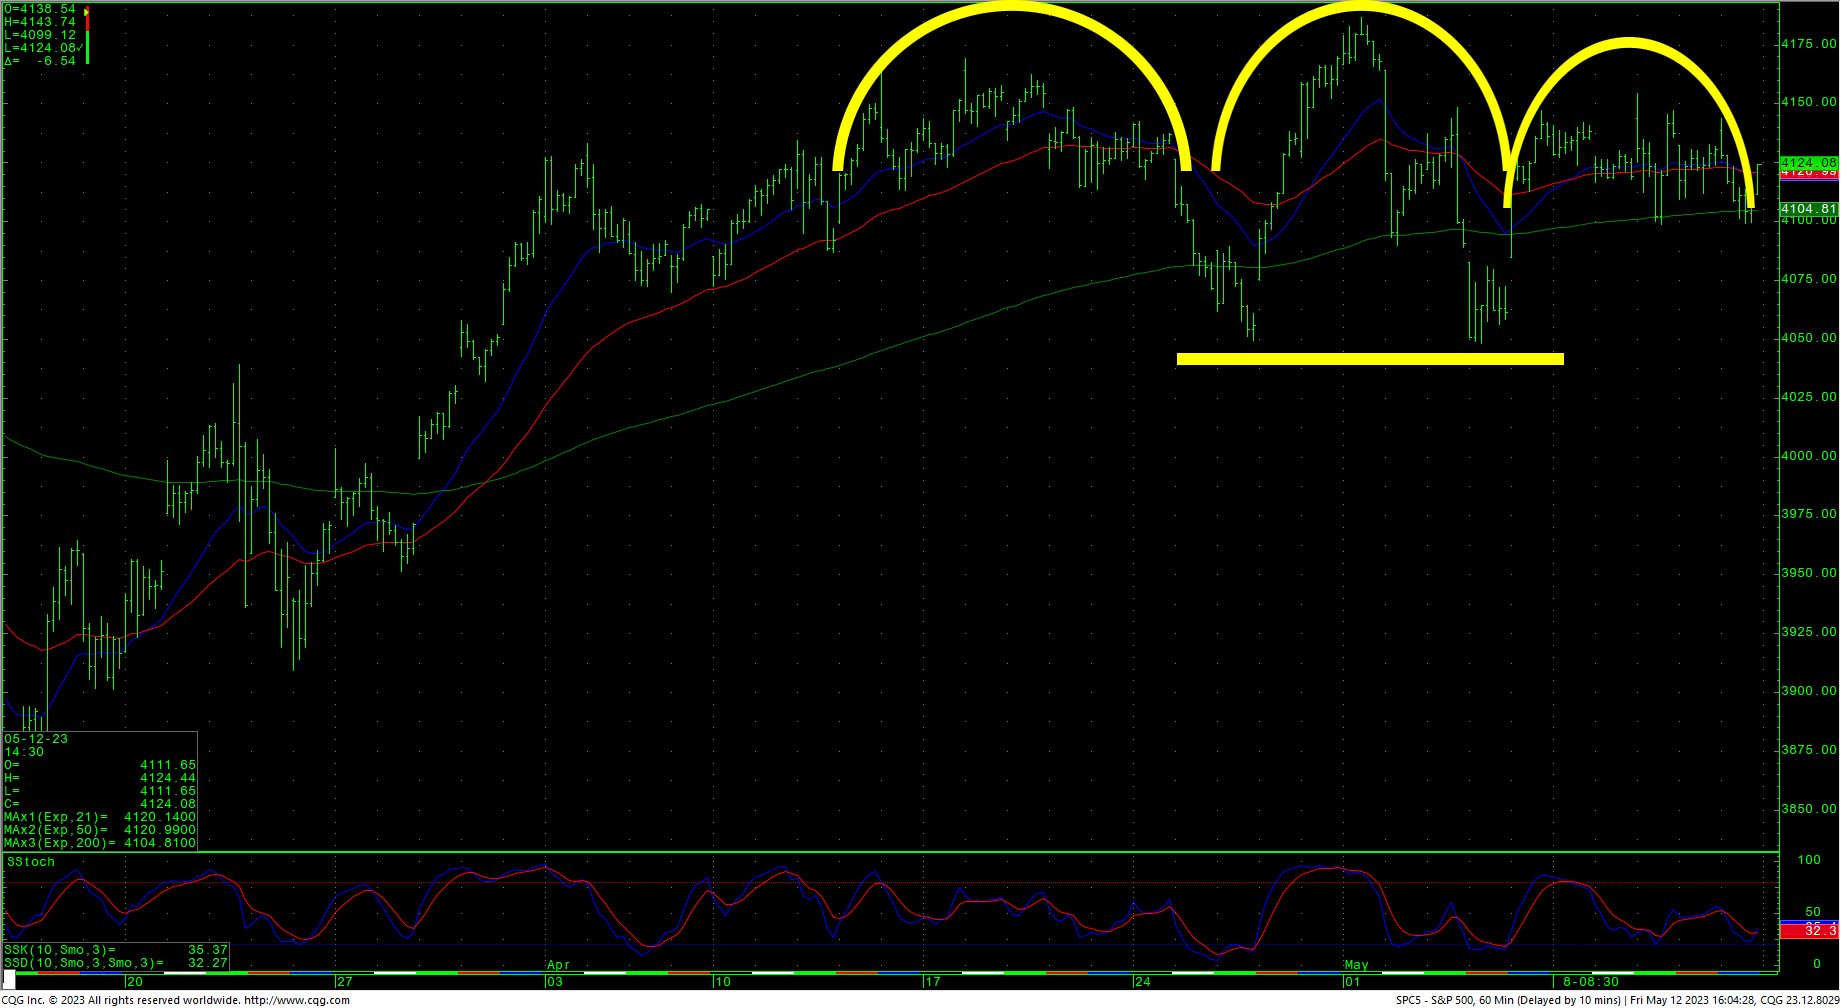
Stocks ended the week mostly lower for the blue chips and the S&P while tech continued to lead the overall market. Prices were actually in relatively tight weekly ranges with the Dow closing the week down -1.10%, S&P500 down -0.30%, the Nasdaq up +0.46% and the FANG up +3.20. Note that Monday and Tuesday, the 15th and 16th are CRITICAL cycle timing dates for the market with the potential for wide ranges and/or large net changes, and this entire week is outlined as a critical week. Also note that last Wednesday’s timing basically incorporated the entire week’s range. The hourly charts for both the Dow and S&P are slightly oversold and the S&P hourly has a distinct head and shoulders top formation and prices are sitting right in the middle of the range. The market staged a last minute comeback Friday after suffering a sharp decline midday after a bearishly construed Michigan Consumer Sentiment Index report.
S&P 500 Hourly H-L-C
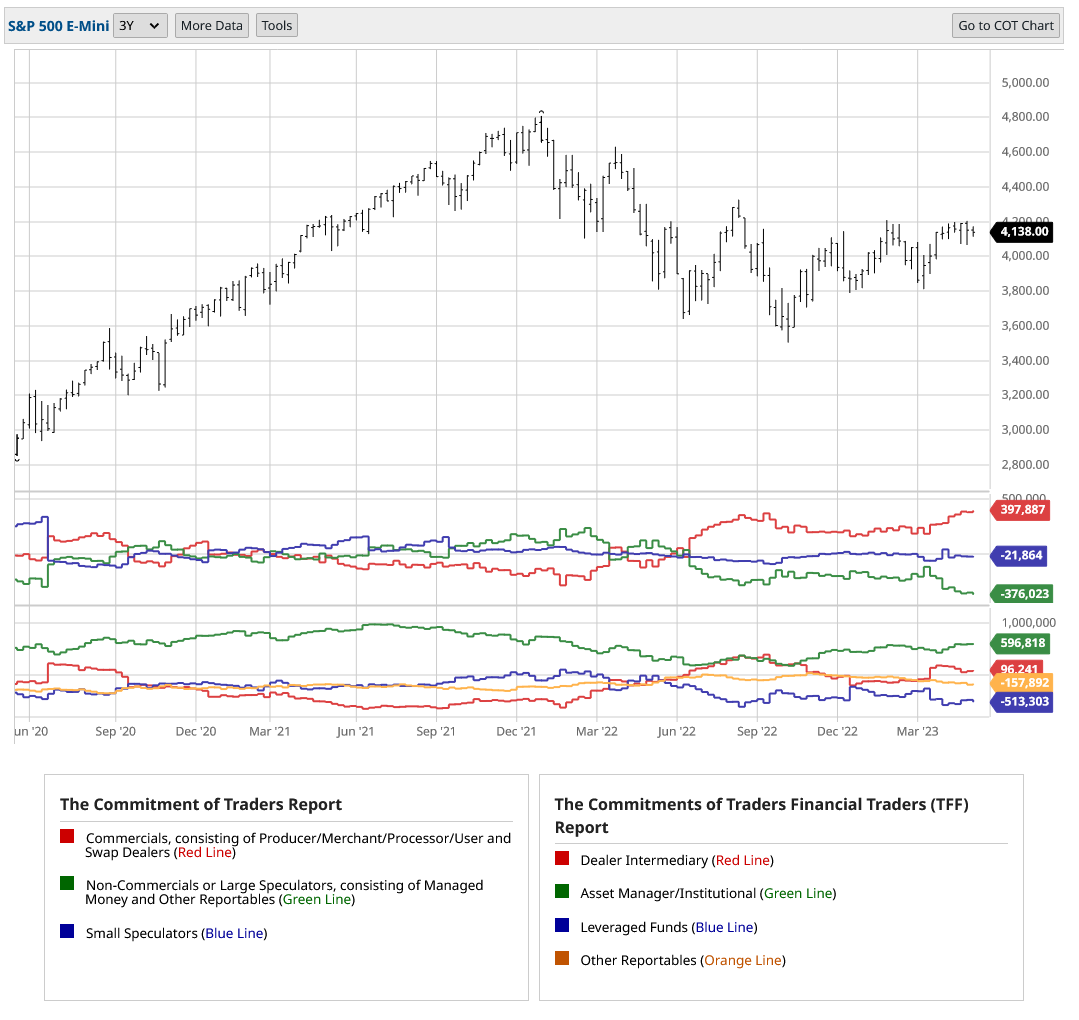
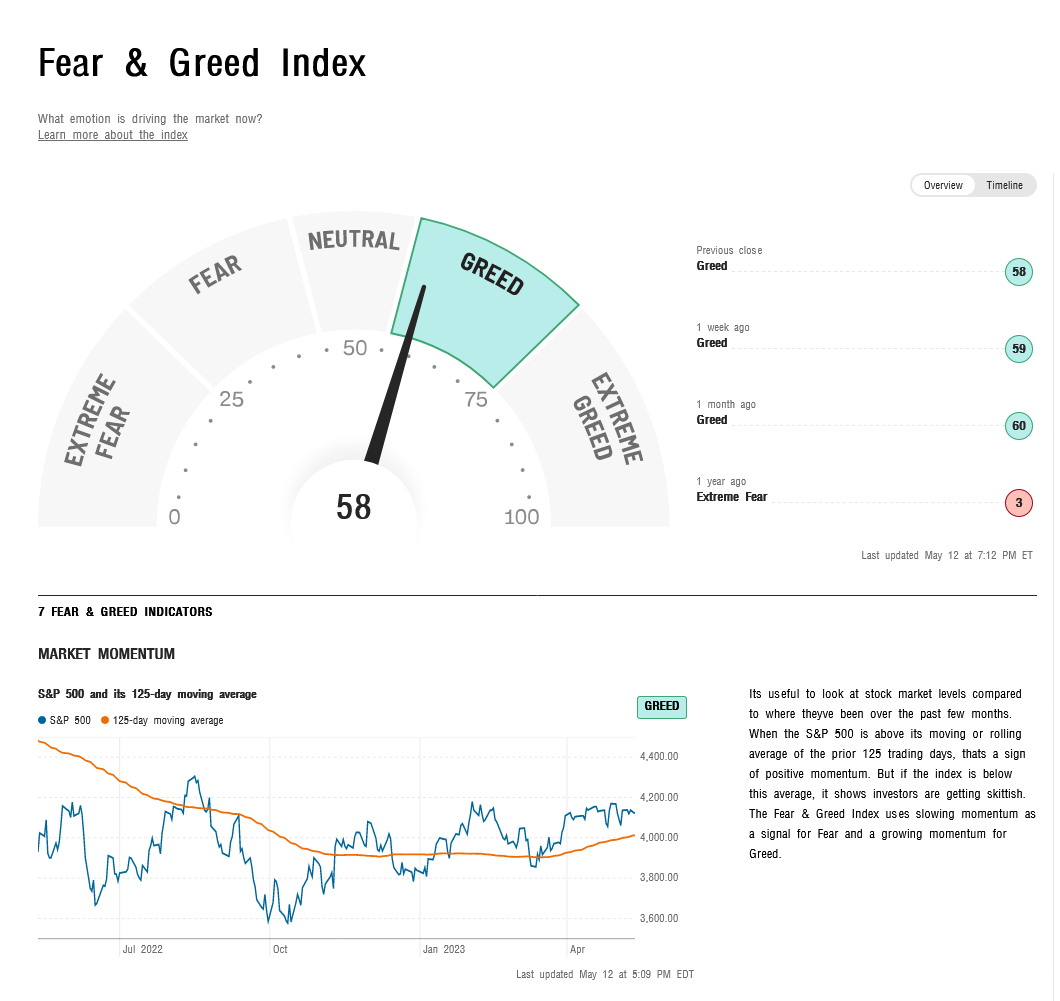
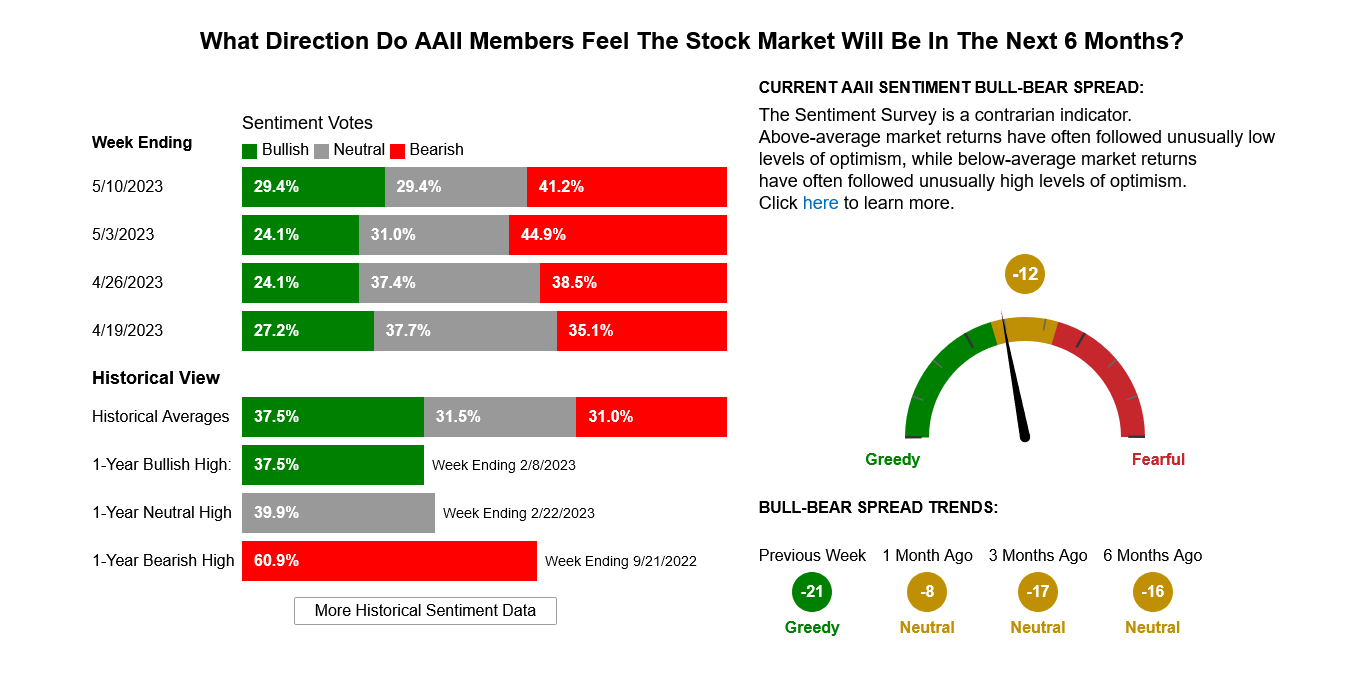
The action last week leaves sentiment in a neutral to greedy posture. The 52-week, A/D line closed -0.68%. The commitment of traders continues to show commercials are long and speculators are short. The weekly charts continue to build the large triangle patterns with moving averages and oscillators showing an uptrend. The VIX remains at a 16 month low.
Commitment of Traders (CoT) June S&P Futures
Timing Points May 2023
- 05-15/16 *** X Key week (Critical)
- 05/25 ** minor
CNN Fear & Greed Index
AAII Investor Sentiment Survey
Dow Jones Industrial Average Weekly HLC
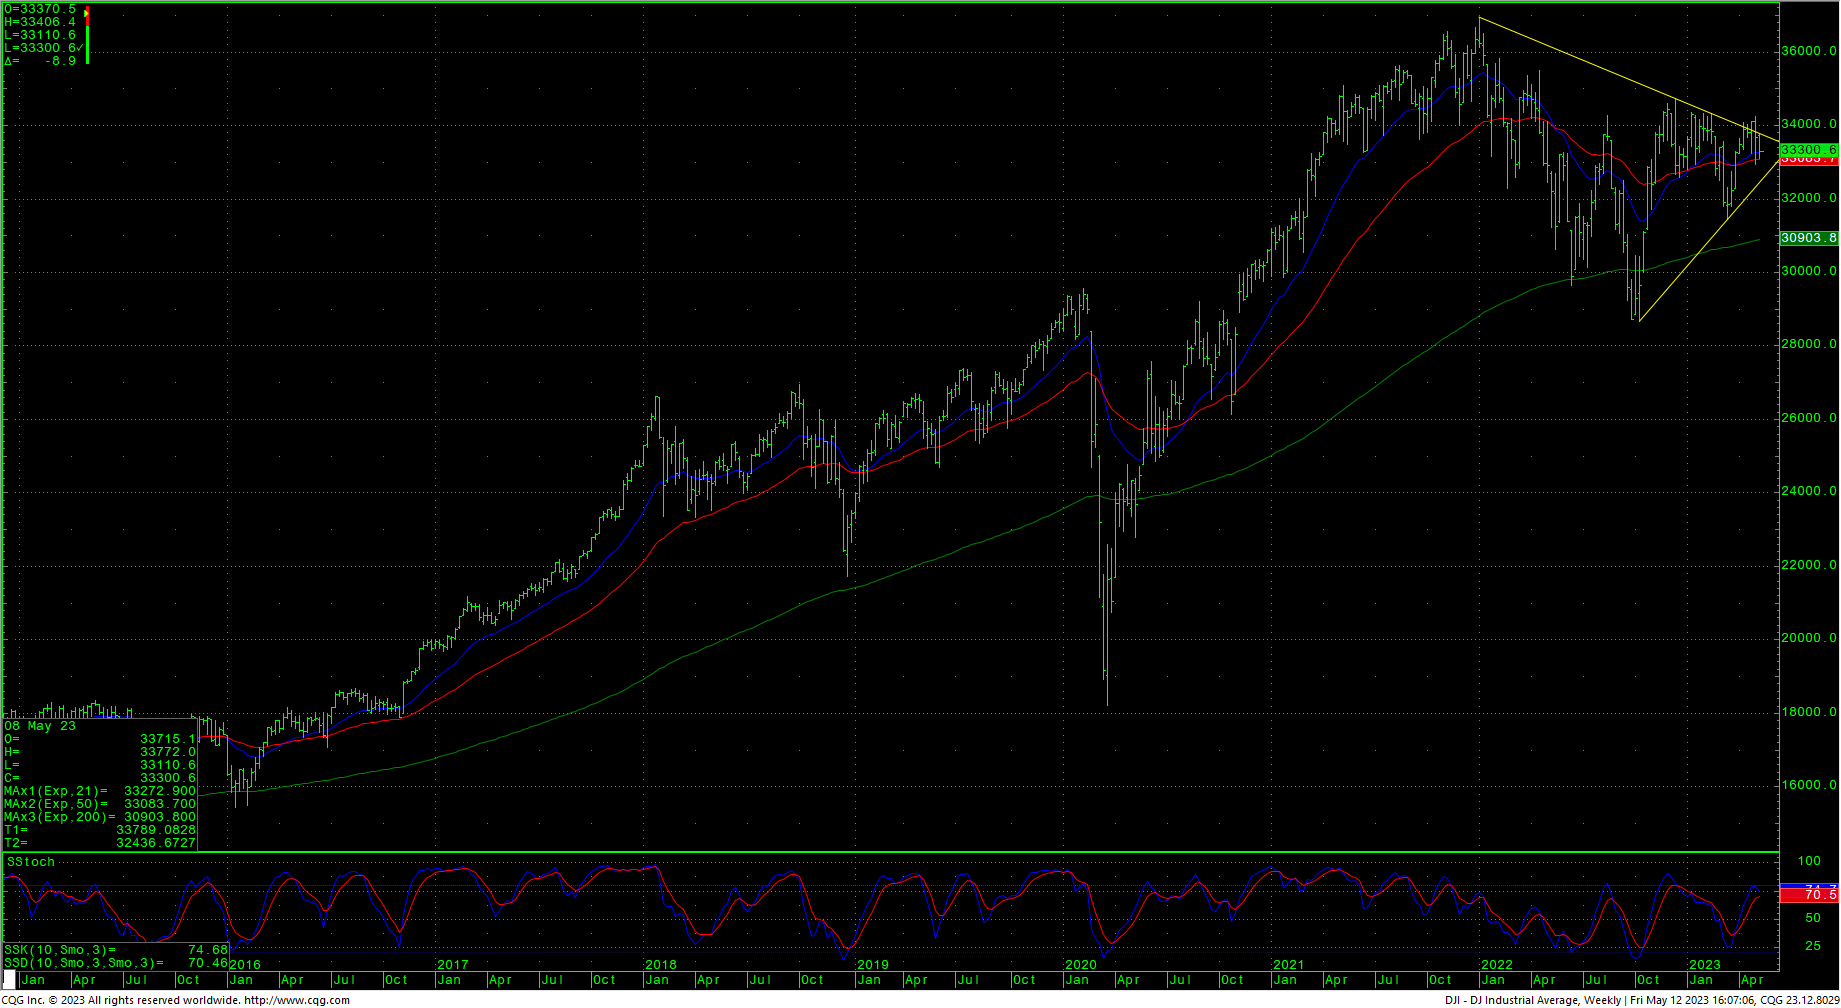
Resistance for the Dow remains at 33441, 33492 and pivotal at 33753/33772. A drive above 33772 should test 33927/33946 with a shot at 34257. Expect resistance to continue at 34222/34257 and 34334/34342. Closes over 34342 are friendly. A drive over 34712 can test significant long-term resistance at 34879 and 34995 and offers full counts back critical resistance at 35492. Closes over 35492 will open counts to 35824. Closes over 35492 should minimally test a gap area on the daily at 35996 to 36044.
Dow Jones Industrial Average Daily HLC
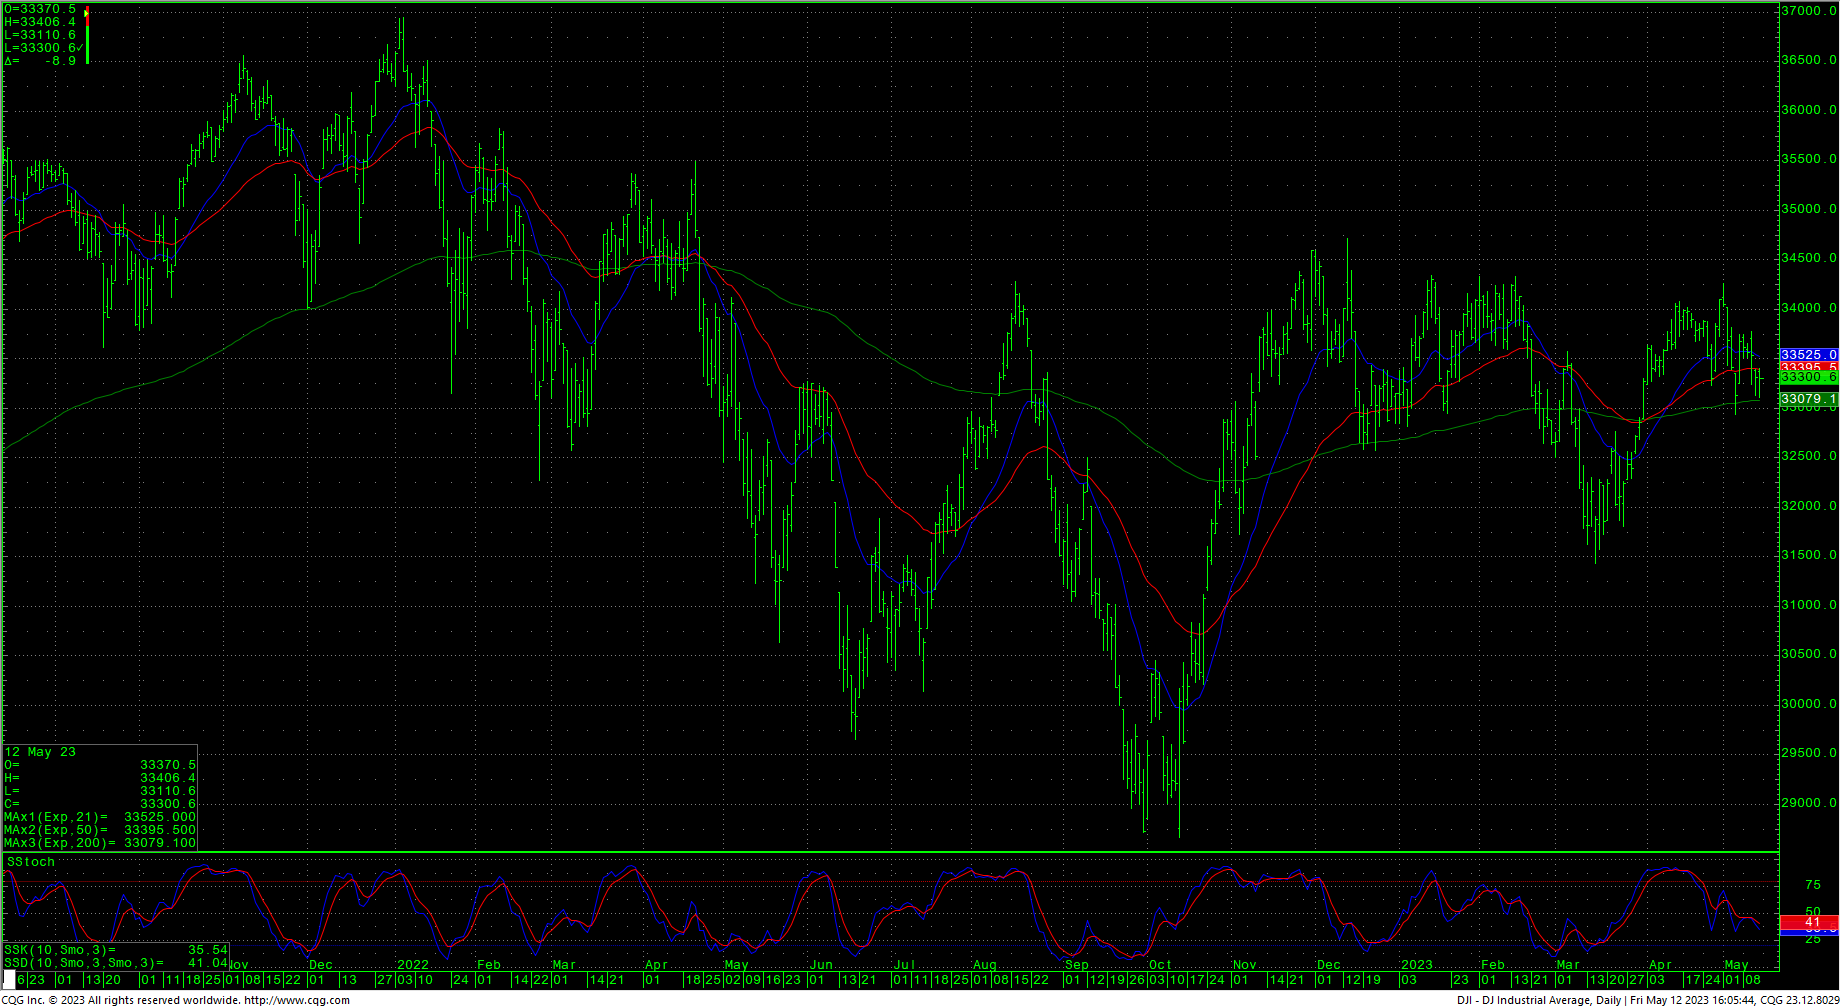
Support for the Dow is at 33110 and 33071. A breakdown under 33071 should retest 32937 with counts to 32683 with counts to critical support of 32510/32500. Closes under 32500 set up a move to intermediate support in the 31727/31686 level. A breakdown with closes under 31686 will open counts into the 30972/30960 level with support of 31429/31423 and 31160. There is a gap on the daily chart that runs from 31160 to 31119.
Resistance
- 33341 **
- 33492 ***
- 33753/33772 *** ↑
- 33927/33946 *** ↑
- 34092 **
- 34130 **
- 34222/34257 *** ↑
- 34334/34342 *** ↑
- 34395 **
- 34495 **
- 34595 **
- 34712 *** ↑
- 34879 ***
- 34995 *** ↑
- 35112 **
- 35225 **
- 35372 ***
- 35492 *** ↑
- 35800/35824 *** ↑
- 35996 ***
- 36044 **
- 36168 **
- 36513 *** ↑
- 36799/36952 *** ↑
Support
- 33110 ***
- 33071 ***
- 32937 *** ↓
- 32843 *** ↓
- 32683 *** ↓
- 32510/32500 *** ↓
- 32396 **
- 32295 ** ↓
- 32136/32097 *** ↓
- 31950 **
- 31828/31805 *** ↓
- 31727 ***
- 31686 *** ↓
- 31624 ***
- 31530 **
- 31429/31423 *** ↓
S&P 500 Cash Index
The S&P daily is trying to hook up in the stochastics. Resistance is now 4133/4135, 4154 and 4186. Rallies through the swing top at 4186 should test the overhead gap area at 4203 to 4218 and longer-term counts to critical resistance of 4311/4315. Daily closes over 4315 open counts to 4385 with full potential to long-term critical resistance of 4486/4505. Closes over 4505 can carry to 4593 with full potential toward 4637. A breakout above 4637 opens potential toward 4748 and ultimately 4818.
S&P 500 Index Weekly HLC
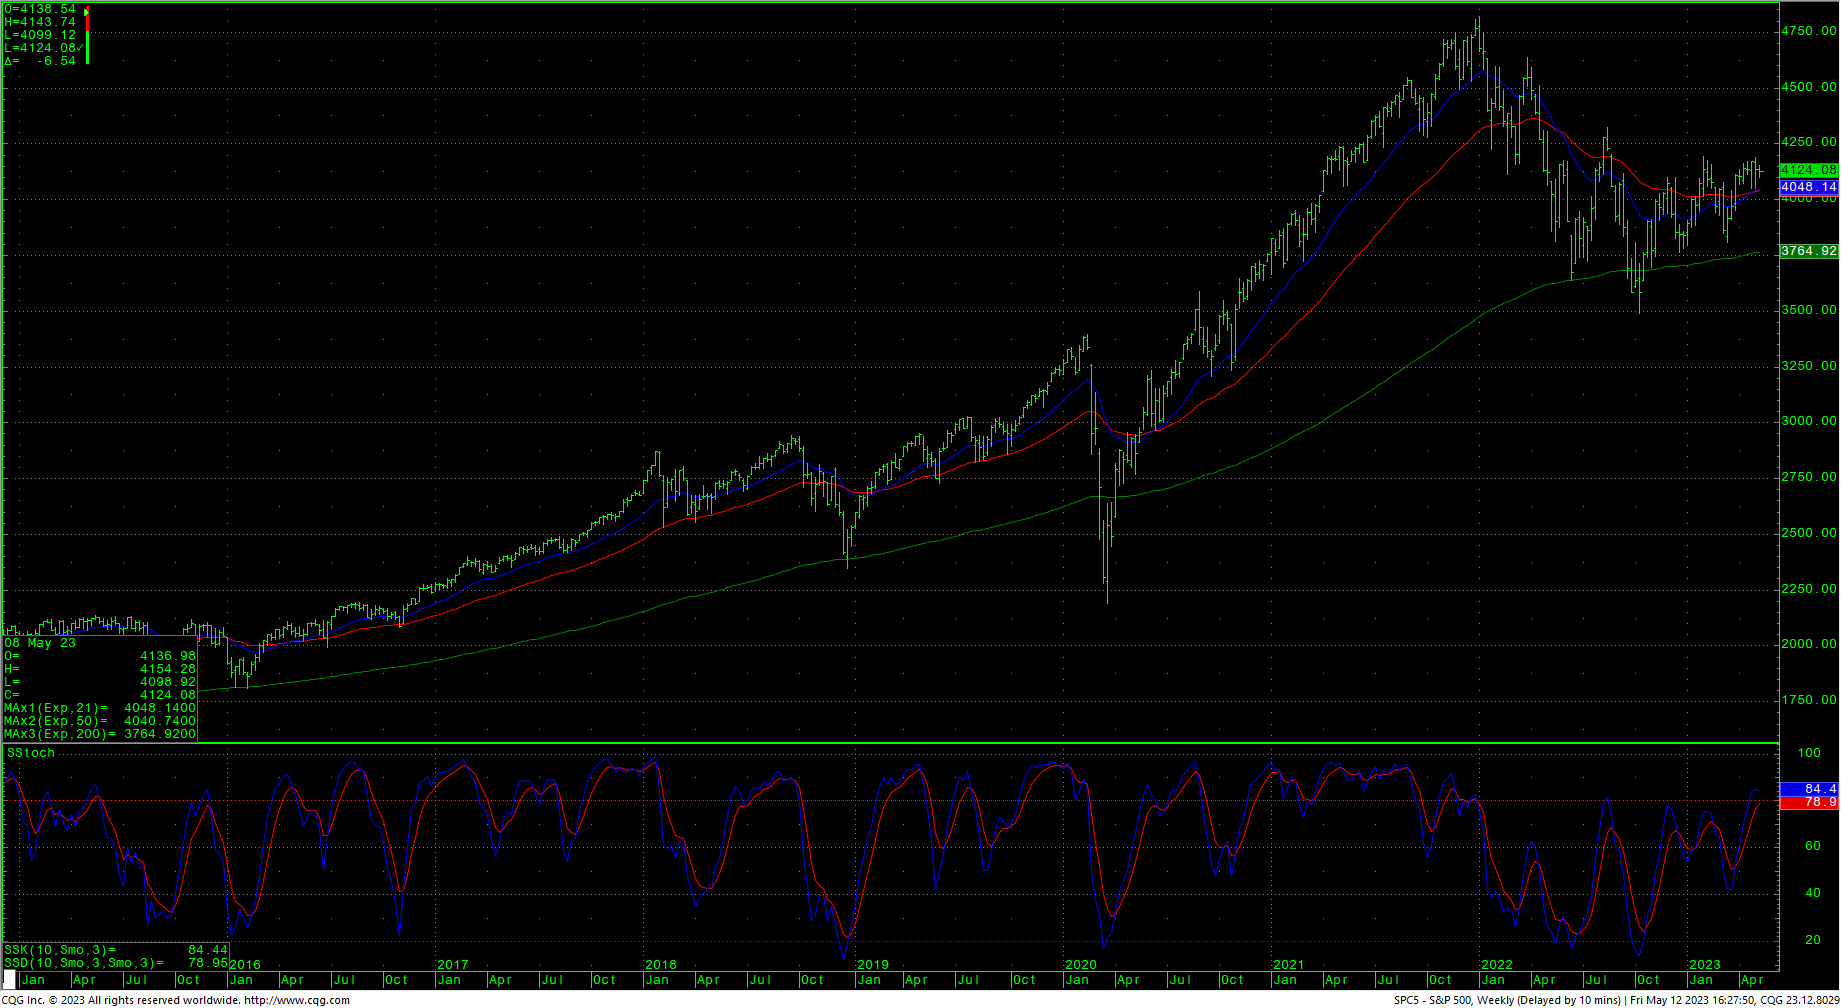
Support is 4113, 4101 and 4088/4085. A breakdown under 4085 should retest 4058/4057 with counts to 4031/4028. Closes under the 4028 level should carry to 3989 with counts to pivotal near-term support of 3946/3940. Closes under 3940 setup a retest of 3868/3865. A breakdown under 3865 can test 3808 through 3797. A breakdown with closes under 3799/3797 opens counts to critical support against the 3760/3750 level. Under 3750 sets up a move to 3657 and full potential back to critical long-term support of 3505/3491.
Resistance
- 4133/4135 *** ↑
- 4156/4157 *** ↑
- 4186 *** ↑
- 4203/4218 ***
- 4311/4315 *** ↑
- 4350 **
- 4385 *** ↑
- 4430 **
- 4486 *** ↑
- 4505 *** ↑
- 4593 **
- 4637 *** ↑
- 4665 **
- 4748 *** ↑
- 4818 *** ↑
Support
- 4113 *** ↓
- 4101/4099 *** ↓
- 4087/40853 *** ↓
- 4058/4057 *** ↓
- 4031/4028 ***↓
- 4002 **
- 3965 **
- 3946/3940 *** ↓
- 3868/3865 *** ↓
- 3845 **
- 3808 *** ↓
- 3799/3797 *** ↓
- 3760/3750 *** ↓
- 3667/3657 *** ↓
Charts courtesy of CQG, Inc., CNN, Koyfin, Tradingeconomics and AAII