
TECHNICAL ANALYSIS
Major Indices Week of May 19, 2023
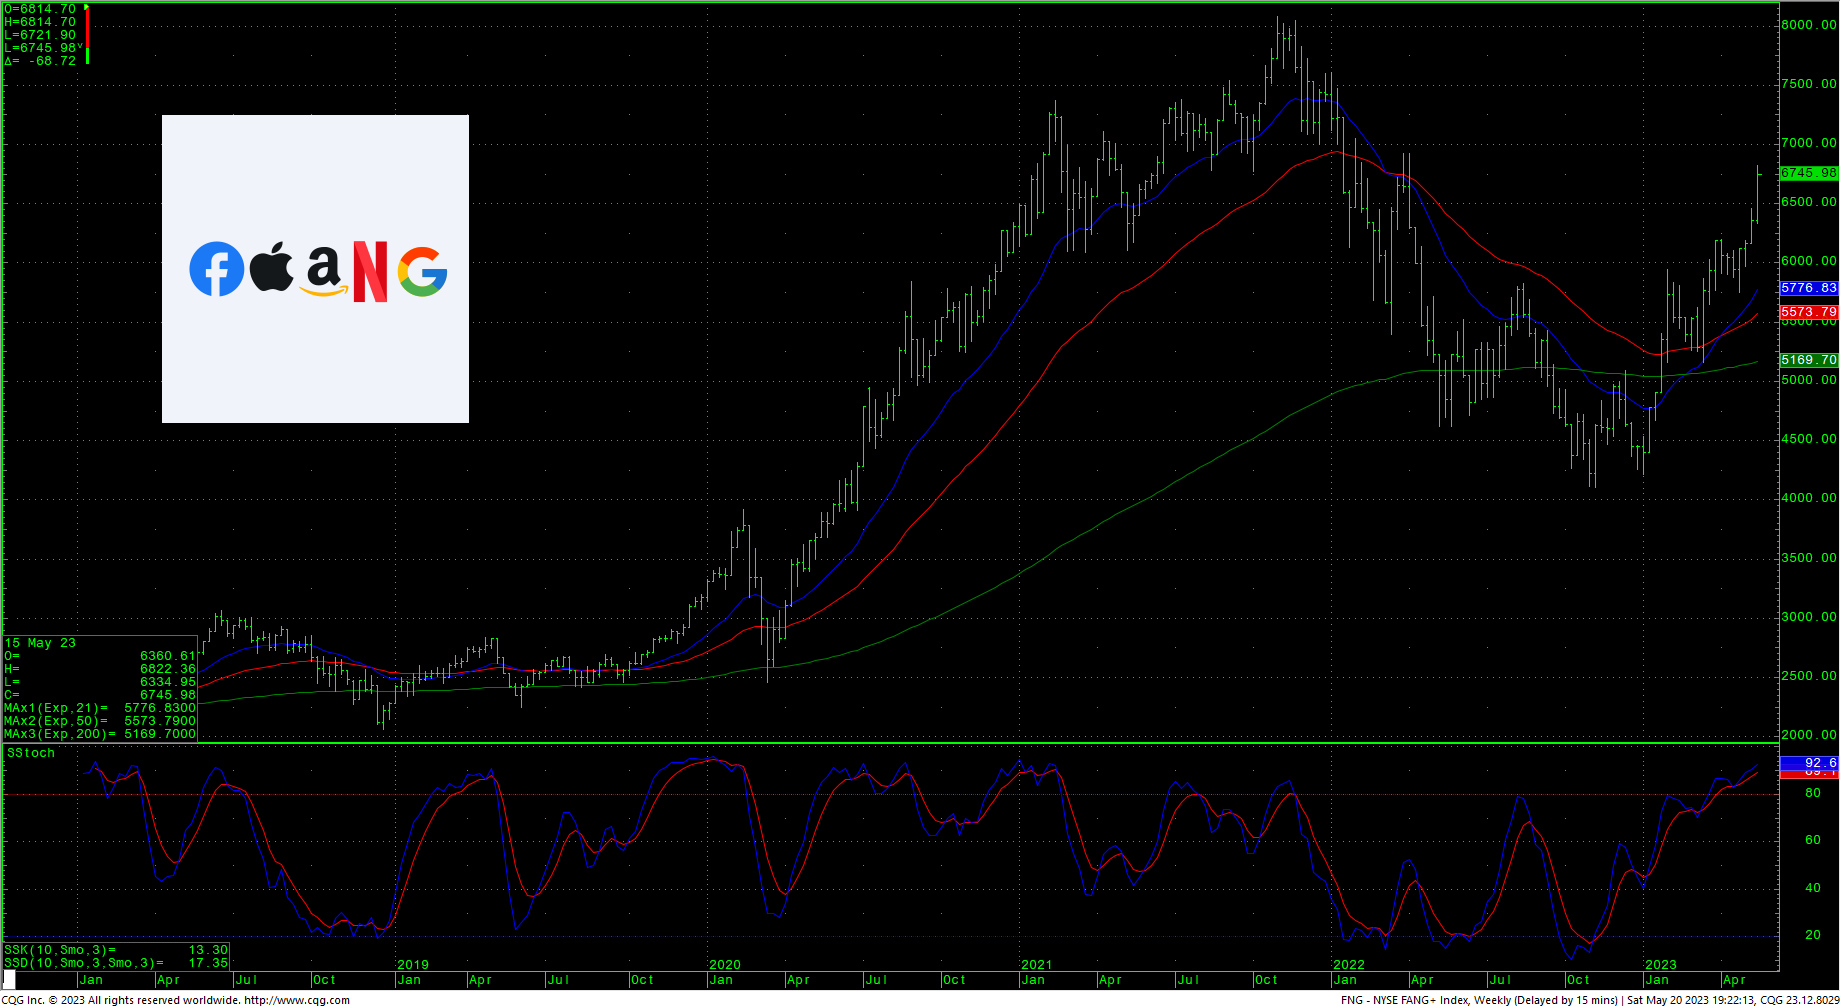
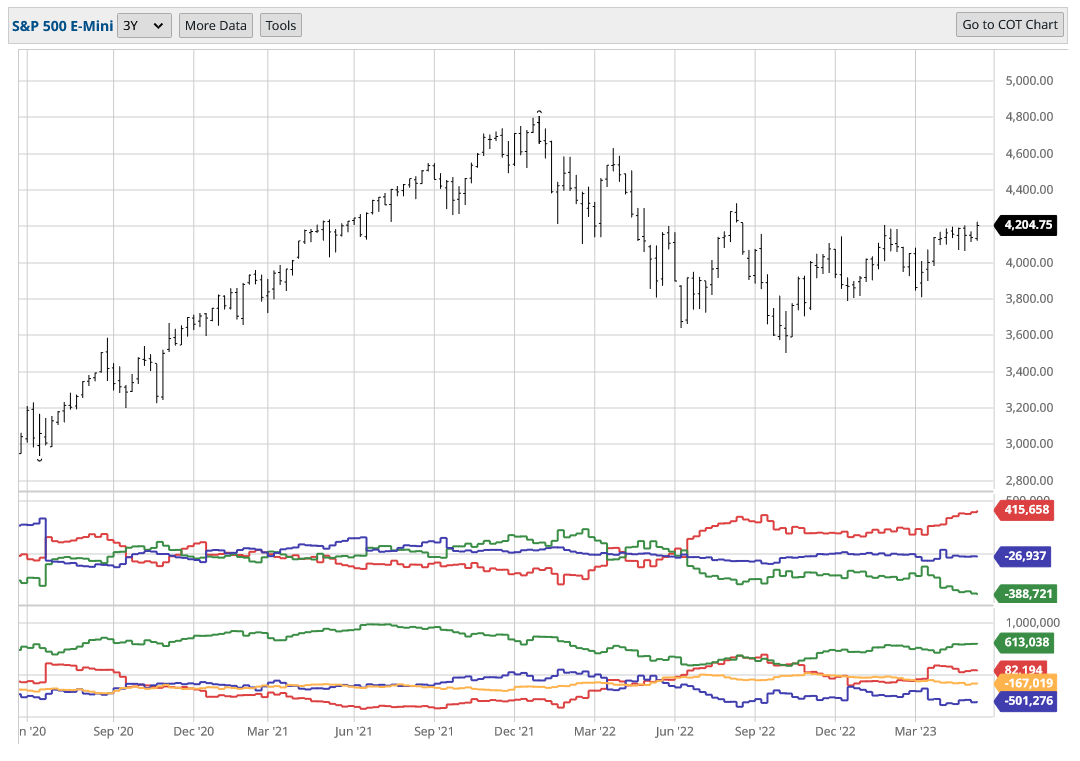
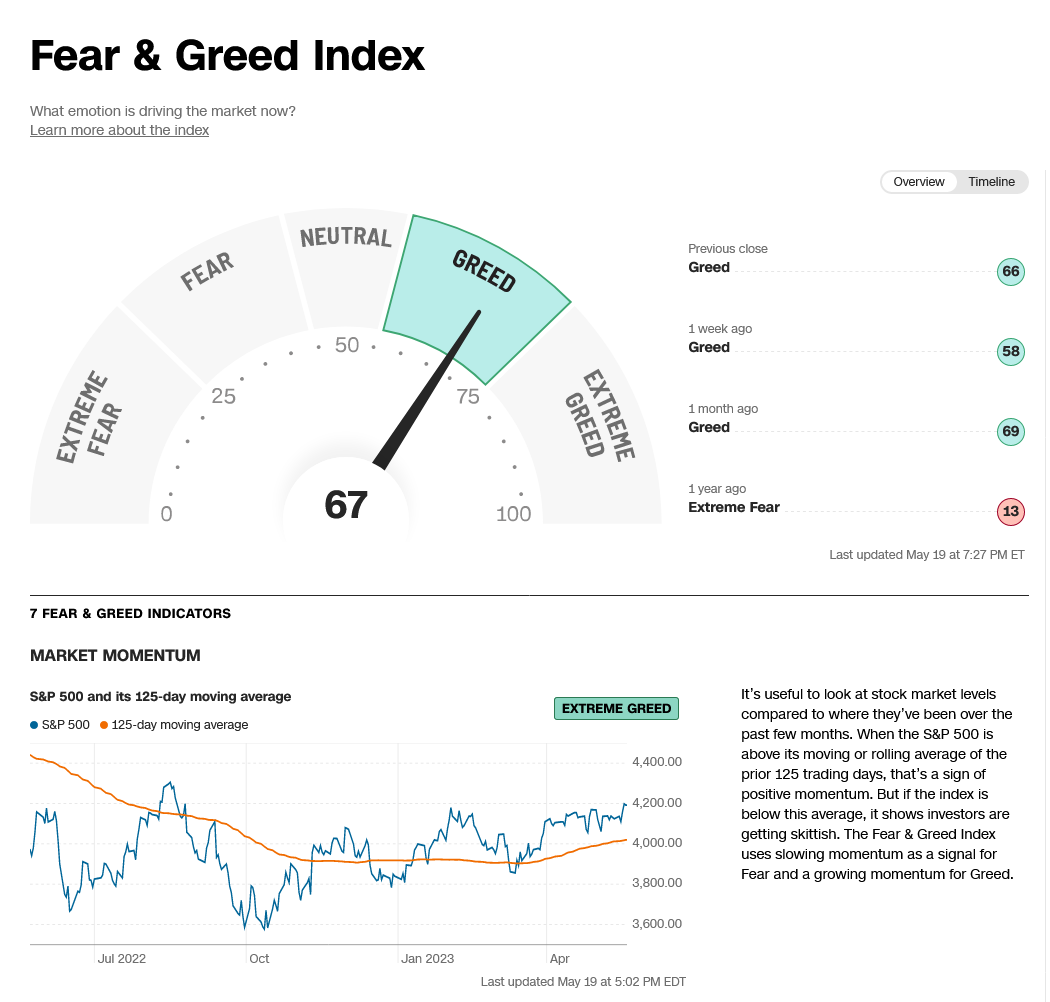
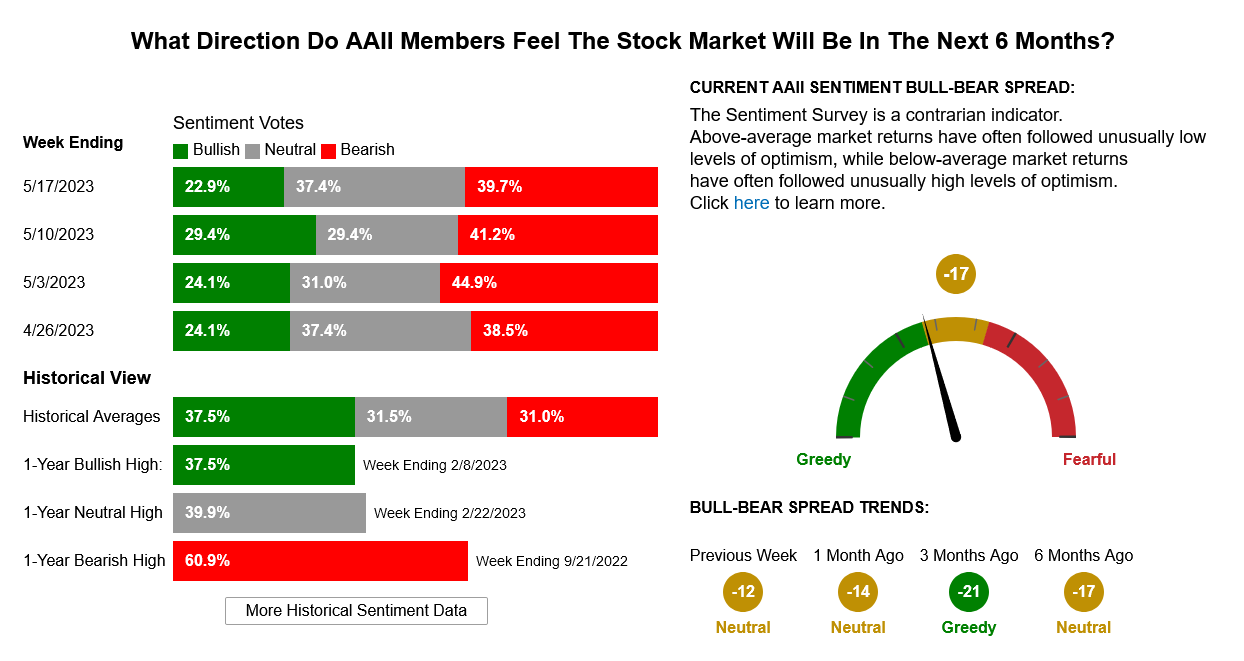
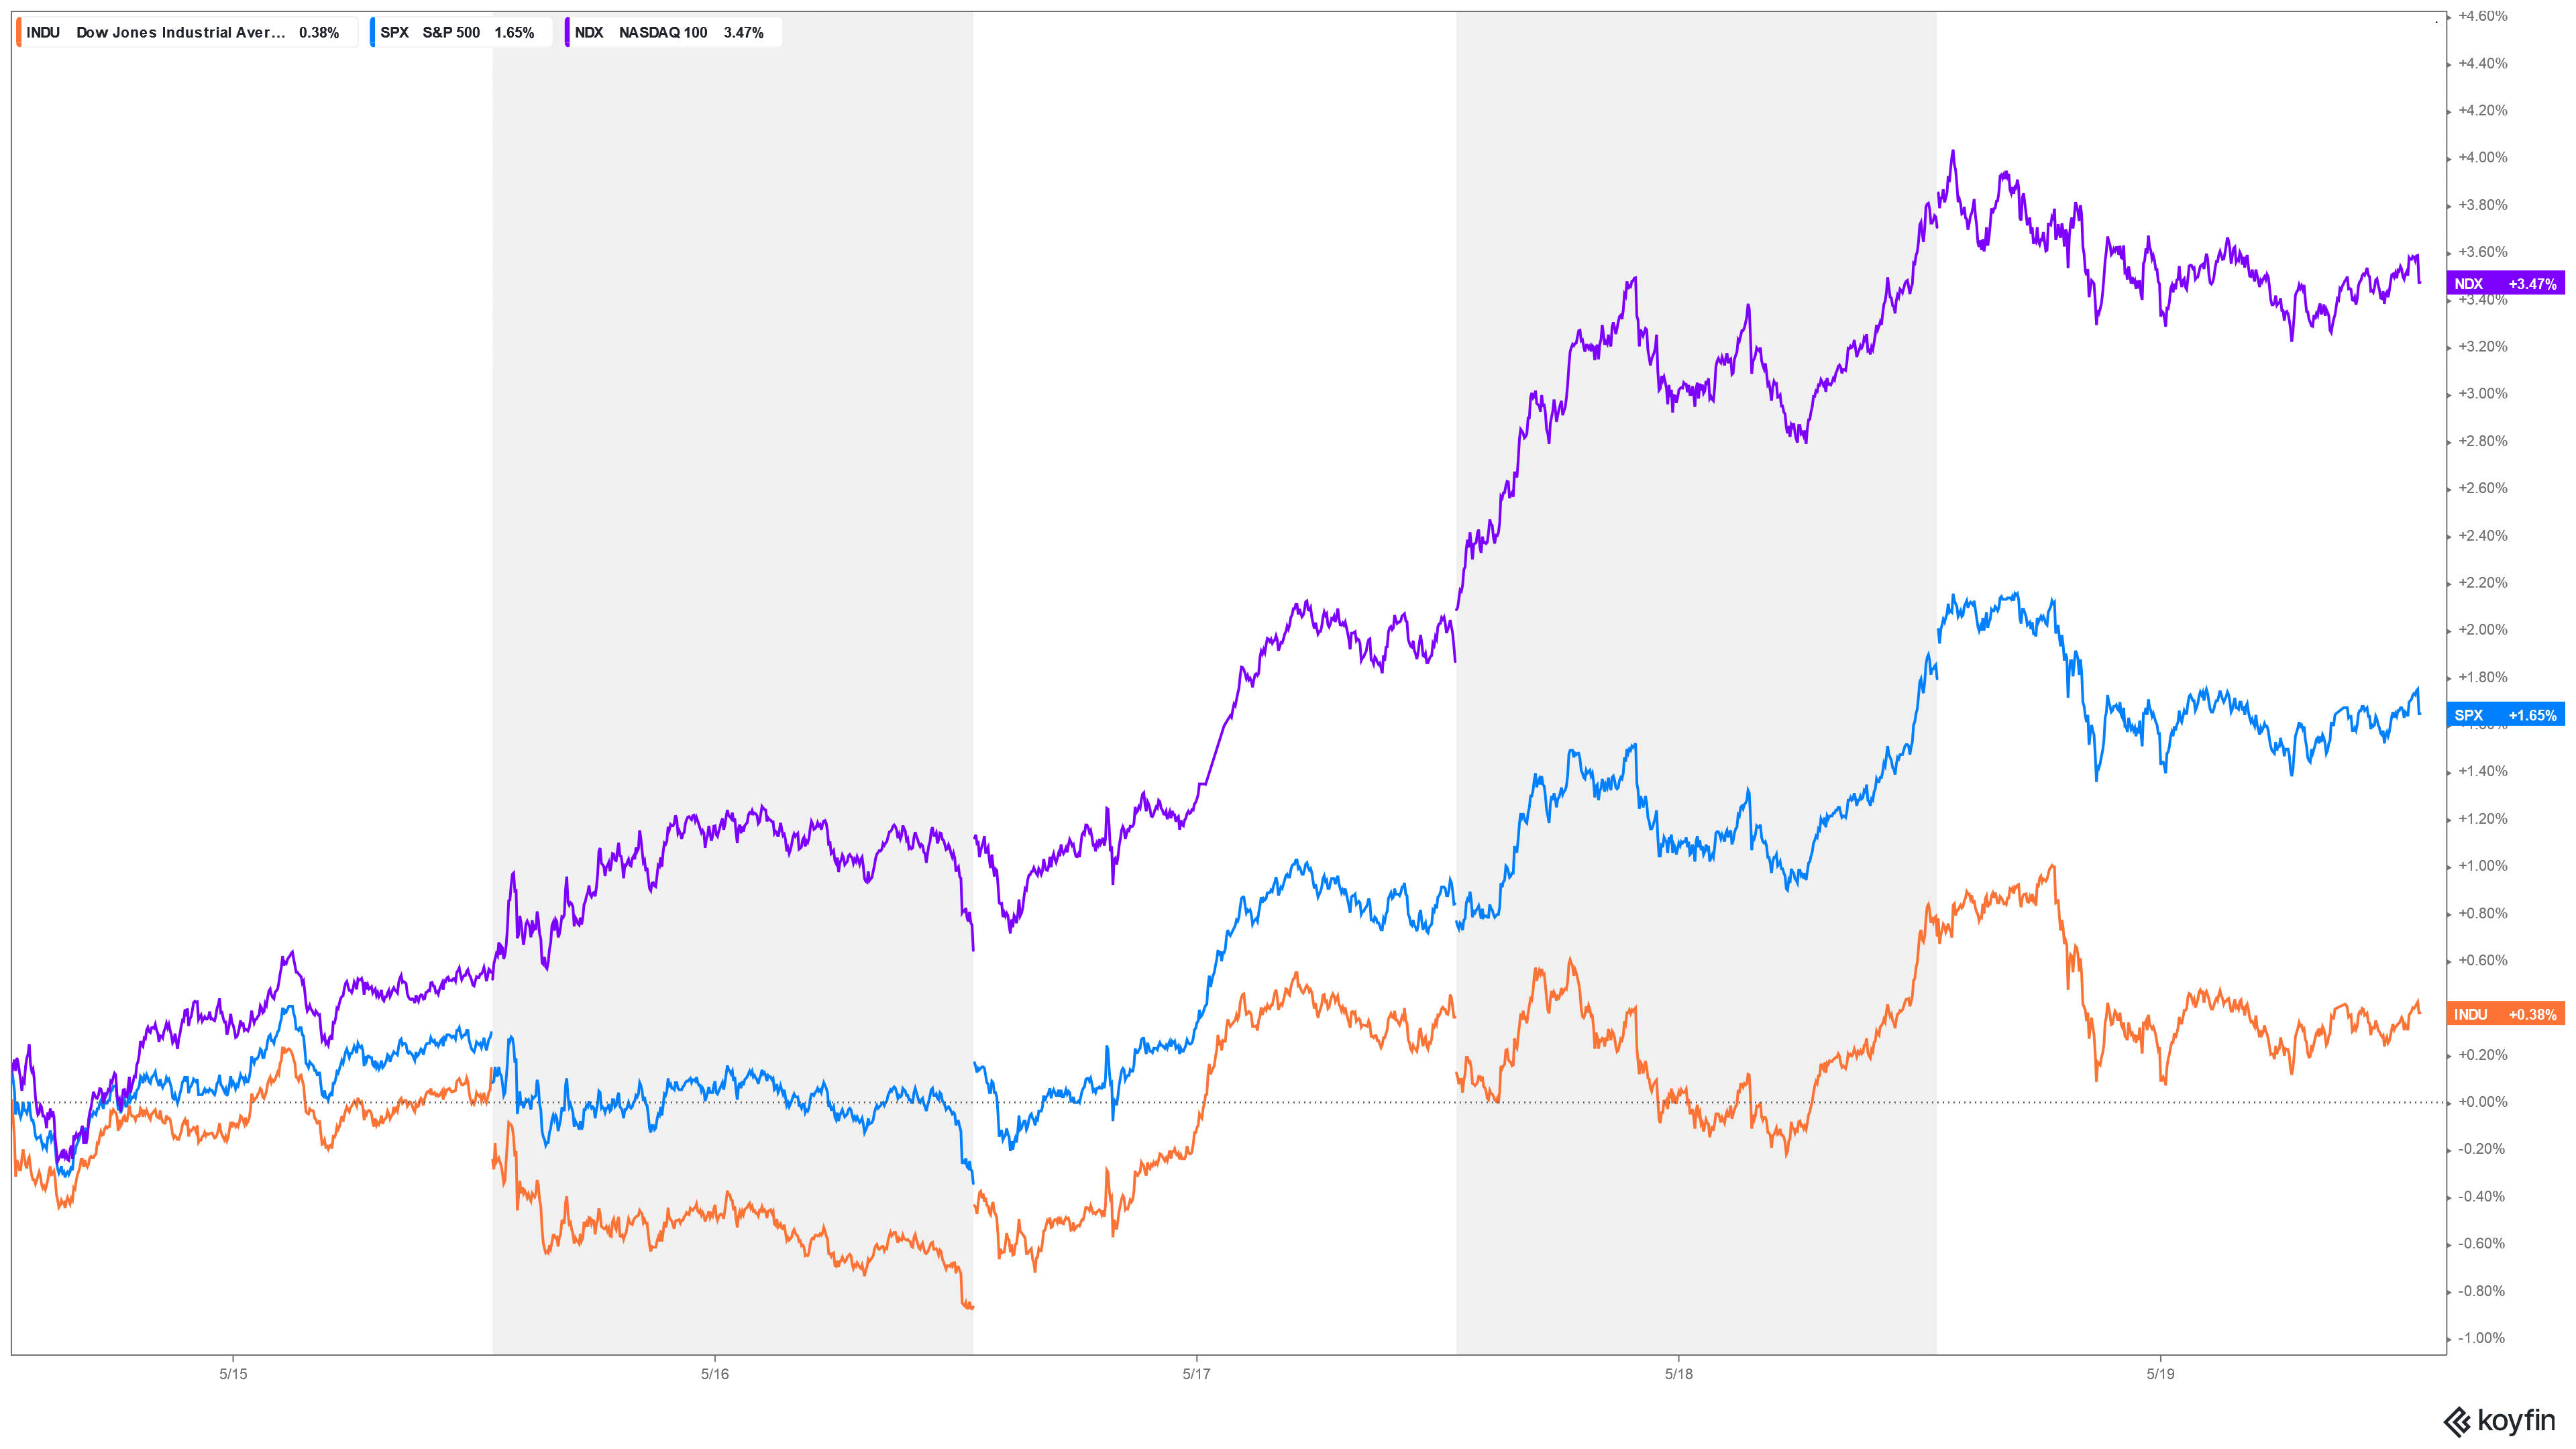 Stocks traded another volatile week with prices setting a key low in the CRITICAL cycle timing dates of Monday-Tuesday and then rallied sharply to carry the S&P500 into a new yearly high and the Nasdaq to the highest levels since April 2022. The selloff on Friday relieved some of the overbought conditions on the hourly charts for both the Dow and S&P. Sentiment remains neutral to greedy, and the Commitment of Traders (CoT) still appears to favor the commercial longs. The FANG closed up sharply, ending the week +6.05% and that market has now advanced +59.7% off its bottom, retracing over 70% of the entire decline from the all-time highs.
Commitment of Traders (CoT) June S&P Futures
 The 52-week, A/D line closed -0.98%. The weekly charts are now testing the upper end of large triangle patterns and moving averages and oscillators remain in an uptrend. Thursday is now a minor timing point for stocks. Note: June 5th stands out as an area where there may be large moves and a possible extreme.
Timing Points
- 05/25 **
- 05/30 **
- 06/05 *** X important
- 06/16 **
- 06/21 **
- 06/30 *** fast moves
CNN Fear & Greed Index
AAII Investor Sentiment Survey
Dow Jones Industrial Average Weekly HLC
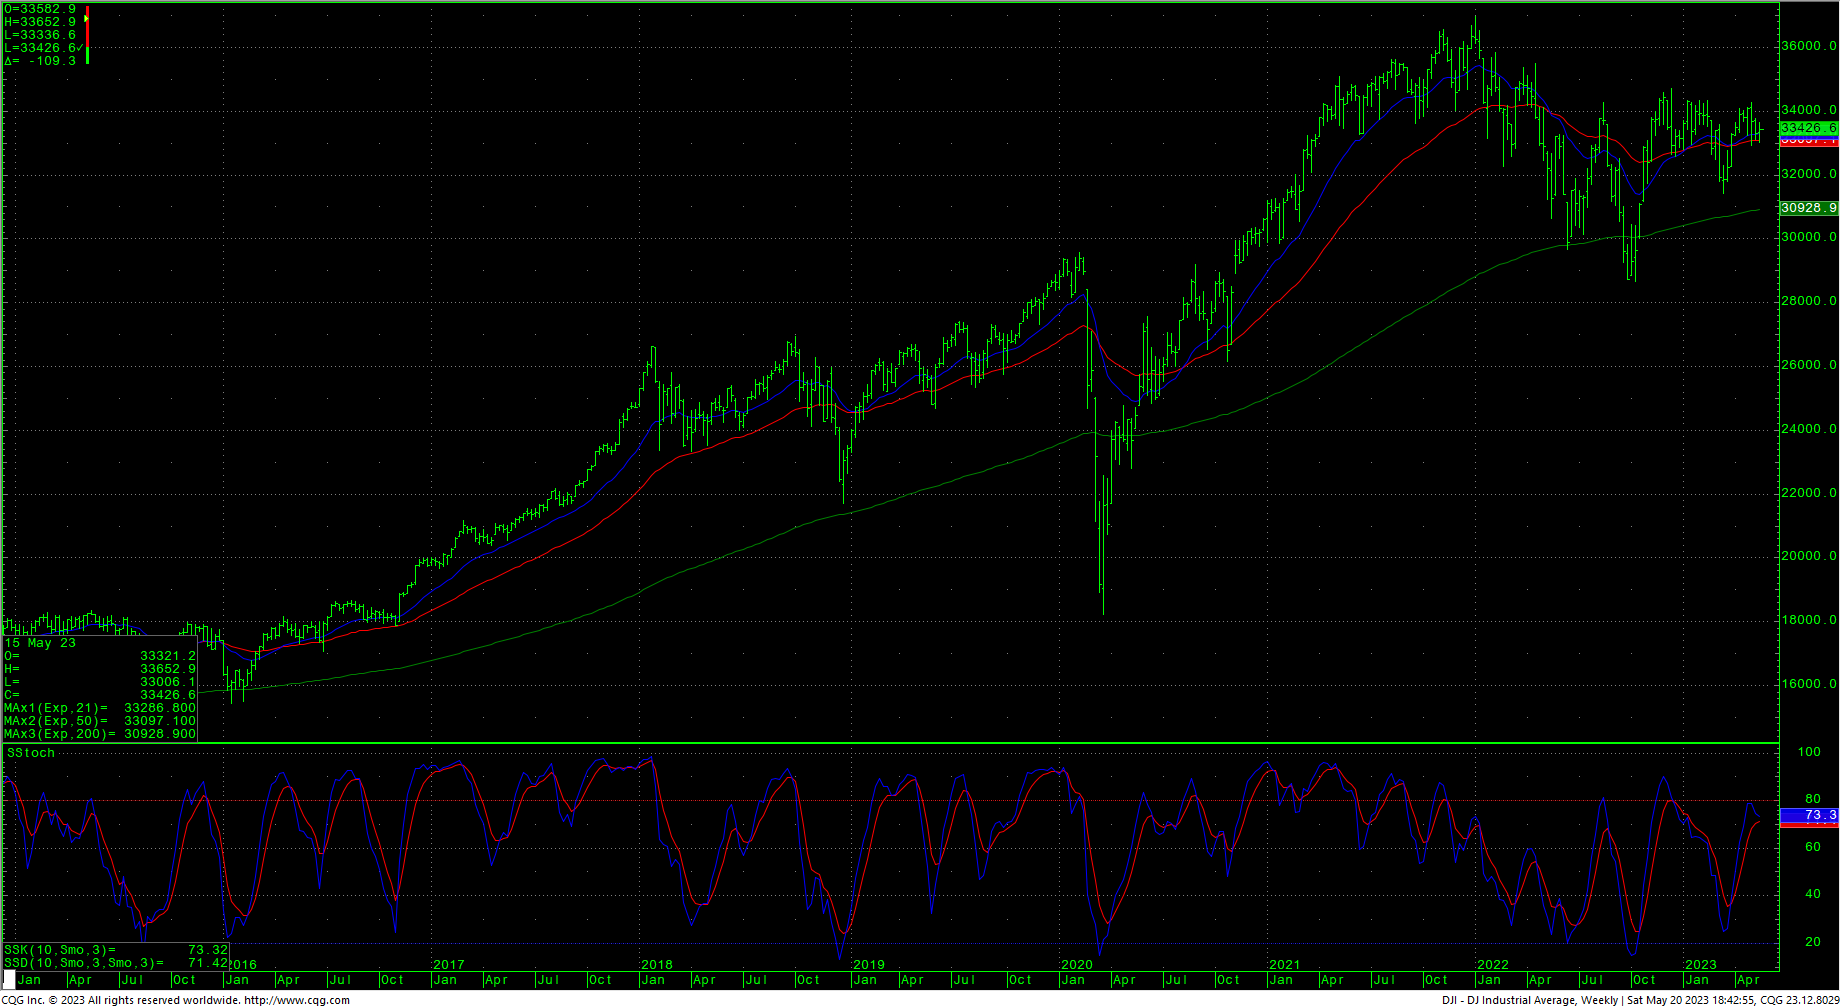
Resistance for the Dow is 33597, 33652 and pivotal at 33753/33772. There is wave resistance at 33811 and a drive above that level is friendly and should test 33927/33946 with a shot at 34257. Expect resistance to continue at 34222/34257 and 34334/34342. Closes over 34342 are friendly. A drive over 34712 can test significant long-term resistance at 34879 and 34995 and offers full counts back critical resistance at 35492. Closes over 35492 will open counts to 35824. Closes over 35492 should minimally test a gap area on the daily at 35996 to 36044.
Dow Jones Industrial Average Hourly HLC
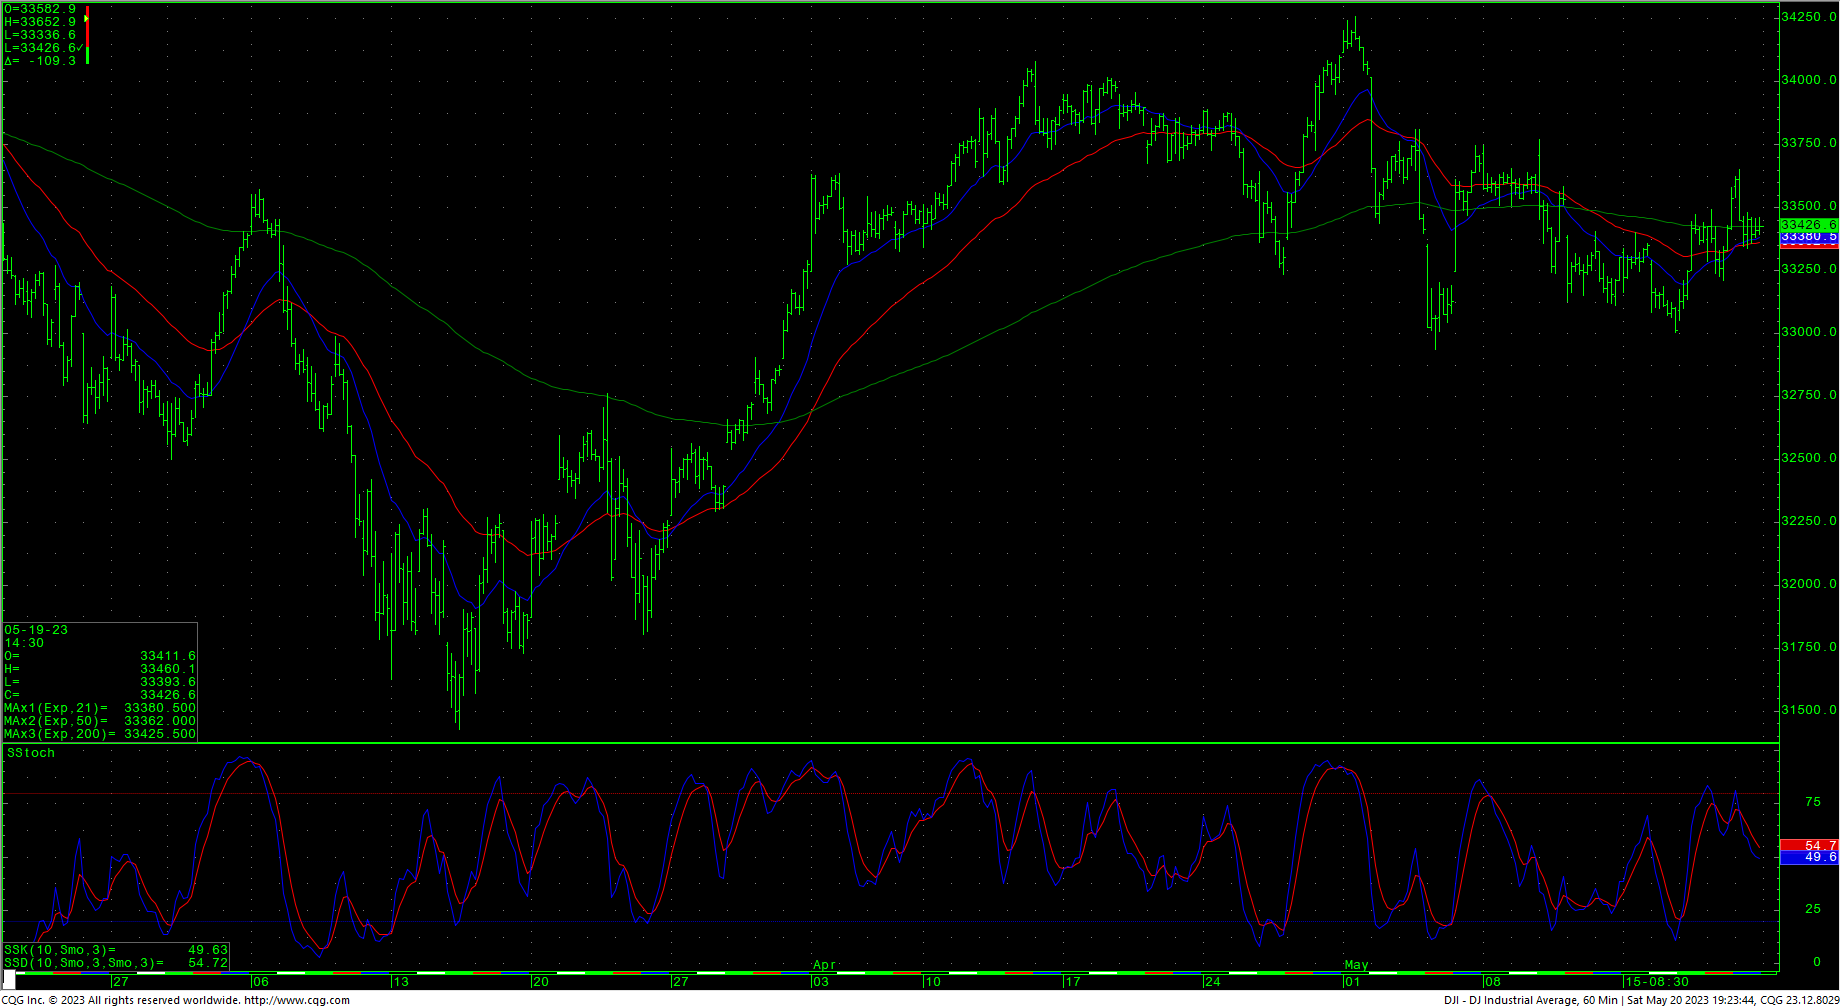
Support for the Dow is at 33329 and 33253/33245 and 33177. A breakdown under 33177 should retest 32937 with support at 32843. A breakdown below 32843 sets up a test of critical support of 32510/32500. Closes under 32500 set up a move to intermediate support in the 31727/31686 level. A breakdown with closes under 31686 will open counts into the 30972/30960 level with support of 31429/31423 and 31160. There is a gap on the daily chart that runs from 31160 to 31119.
Resistance
- 33597 **
- 33652 ***
- 33753/33772 *** ↑
- 33811 ** ↑
- 33927/33946 *** ↑
- 34092 **
- 34130 **
- 34222/34257 *** ↑
- 34334/34342 *** ↑
- 34395 **
- 34495 **
- 34595 **
- 34712 *** ↑
- 34879 ***
- 34995 *** ↑
- 35112 **
- 35225 **
- 35372 ***
- 35492 *** ↑
- 35800/35824 *** ↑
- 35996 ***
- 36044 **
- 36168 **
- 36513 *** ↑
- 36799/36952 *** ↑
Support
- 33371 **
- 33329 ***
- 33253/33245 *** ↓
- 33177 *** ↓
- 33006 *** ↓
- 32843 *** ↓
- 32683 *** ↓
- 32510/32500 *** ↓
- 32396 **
- 32295 ** ↓
- 32136/32097 *** ↓
- 31950 **
- 31828/31805 *** ↓
- 31727 ***
- 31686 *** ↓
- 31624 ***
- 31530 **
- 31429/31423 *** ↓
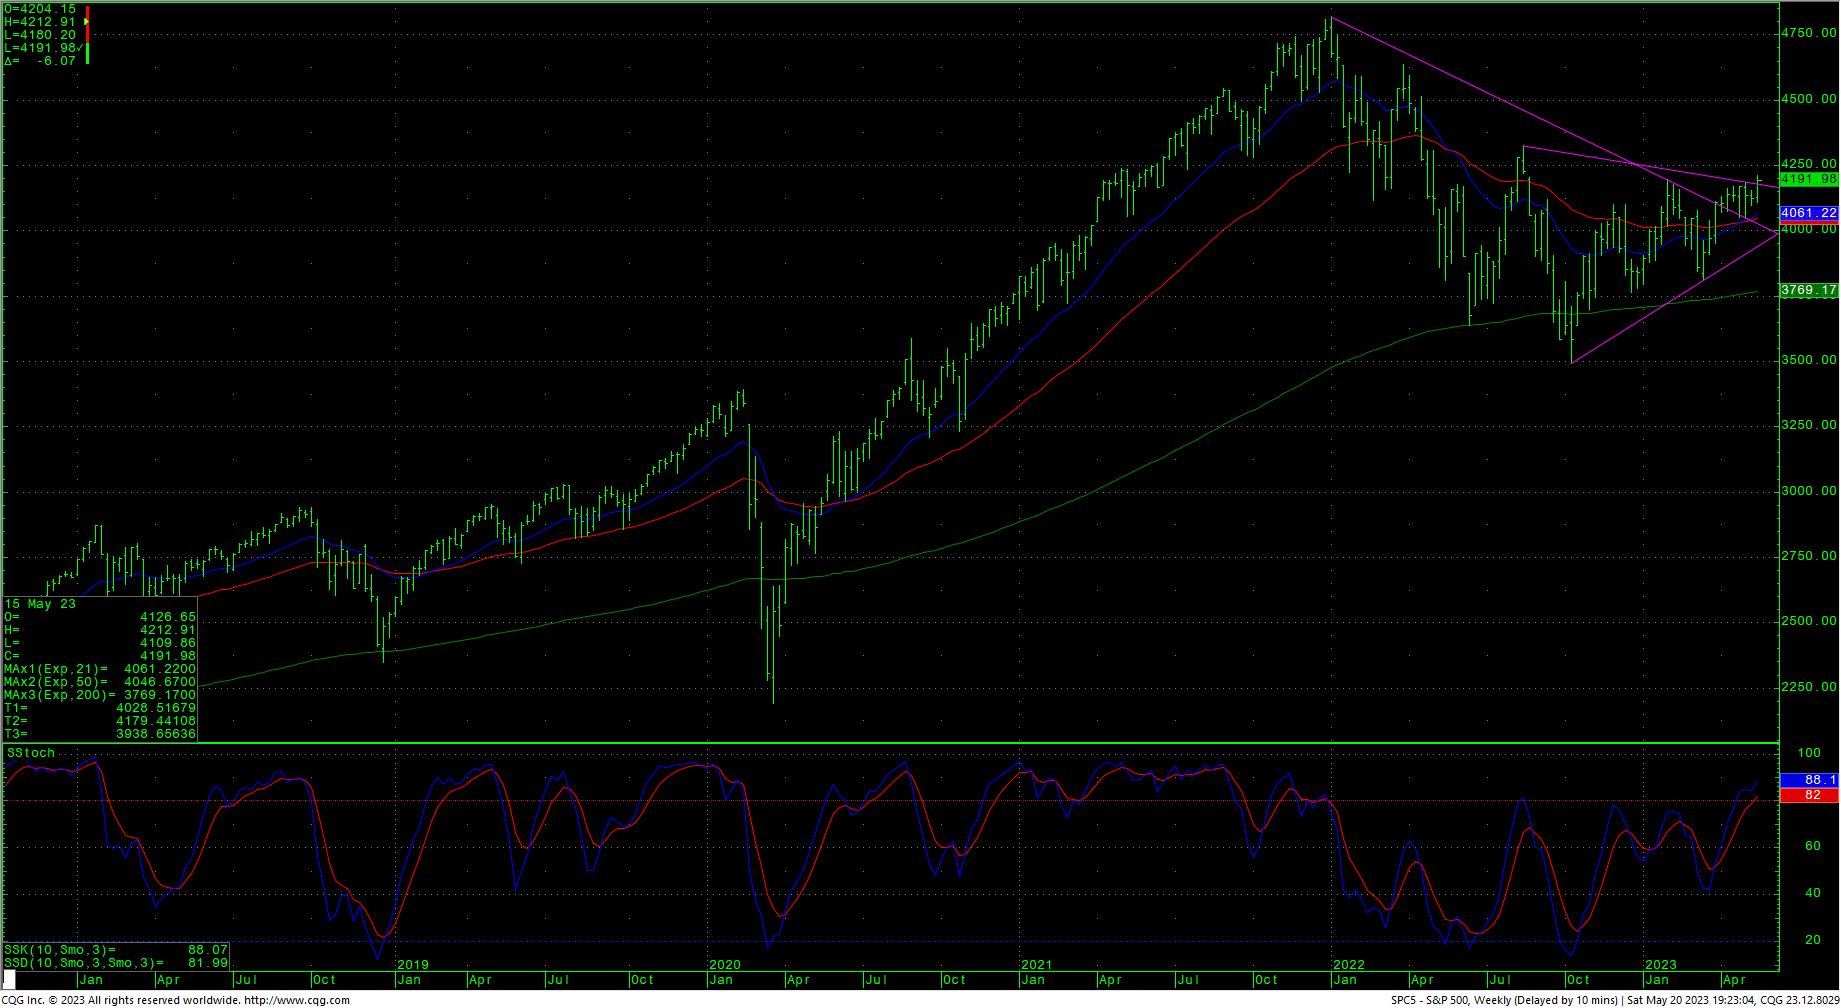
S&P 500 Cash Index
The S&P broke into new highs for 2023 and entered the long-term gap area on the daily that runs from 4203/4218 before reversing in Friday’s trade, falling just shy of filling in the gap completely. The daily is hooking up in the stochastics with prices on the edge of a breakout from a large triangle pattern. Resistance is now pivotal at 4212/4218 and further rallies through this area should carry to critical resistance of 4311/4315. Daily closes over 4315 open counts to 4385 with full potential to long-term critical resistance of 4486/4505. Closes over 4505 can carry to 4593 with full potential toward 4637. A breakout above 4637 opens potential toward 4748 and ultimately 4818.
S&P 500 Index Weekly HLC
Support is 4174, 4150, 4130 and short-term pivotal at 4111/4108. A breakdown under 4108 should retest 4058/4057. Closes below 4057 open counts to 4010 with potential toward critical support of 3963/3958. Closes under 3958 setup a retest of 3868/3865. A breakdown under 3865 can test 3808 through 3797. A breakdown with closes under 3799/3797 opens counts to critical support against the 3760/3750 level. Under 3750 sets up a move to 3657 and full potential back to critical long-term support of 3505/3491.
Resistance
- 4212/4218 ***
- 4311/4315 *** ↑
- 4350 **
- 4385 *** ↑
- 4430 **
- 4486 *** ↑
- 4505 *** ↑
- 4593 **
- 4637 *** ↑
- 4665 **
- 4748 *** ↑
- 4818 *** ↑
Support
- 4174 **
- 4150 **
- 4130 *** ↓
- 4111/4108 *** ↓
- 4099 **
- 4058/4057 *** ↓
- 4010 *** ↓
- 3965 **
- 3963/3958 *** ↓
- 3901 **
- 3868/3865 *** ↓
- 3845 **
- 3808 *** ↓
- 3799/3797 *** ↓
- 3760/3750 *** ↓
- 3667/3657 *** ↓