
TECHNICAL ANALYSIS
Major Indices Week of June 16, 2023
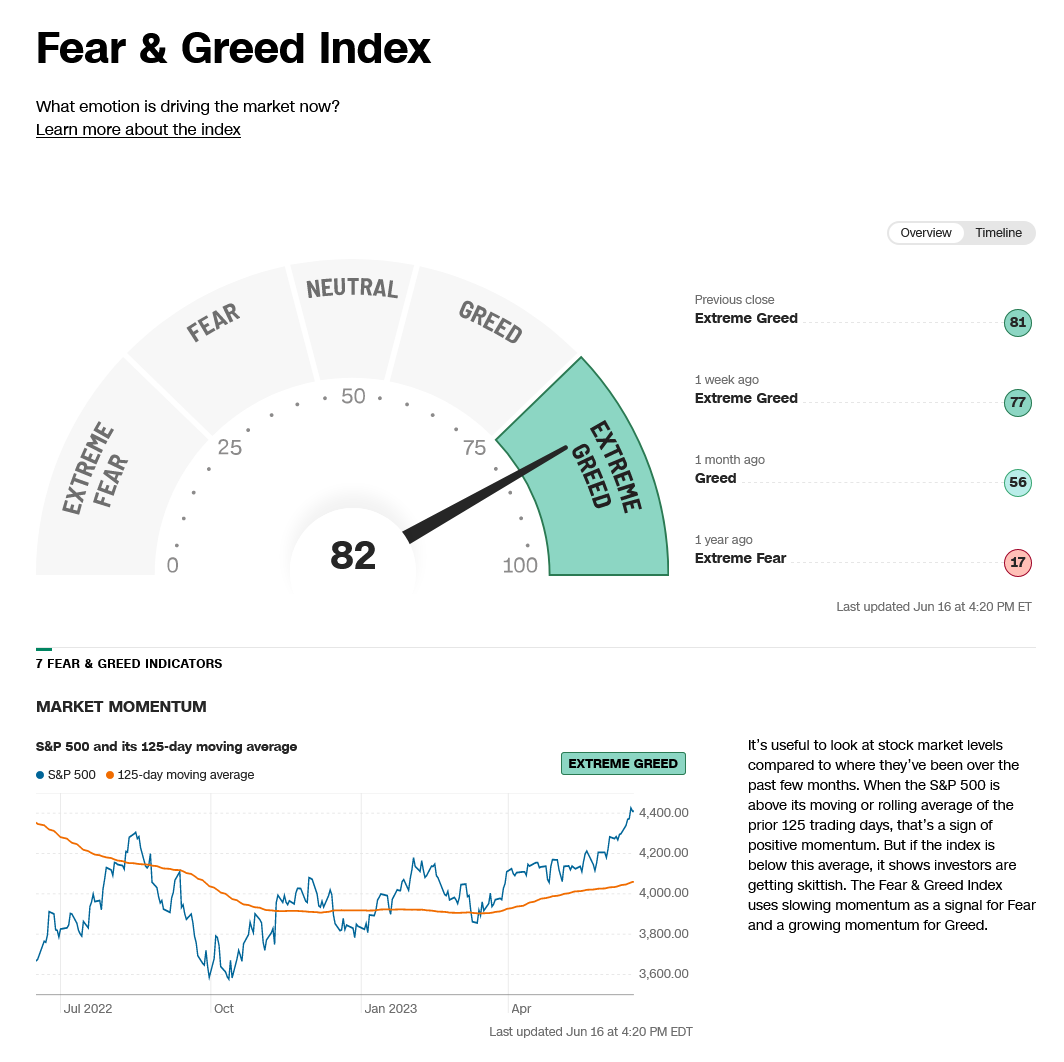
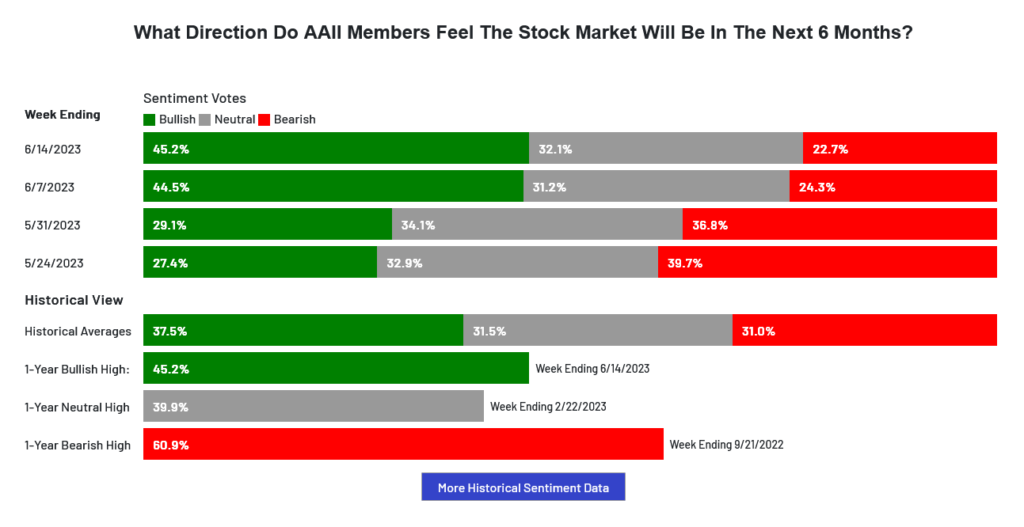
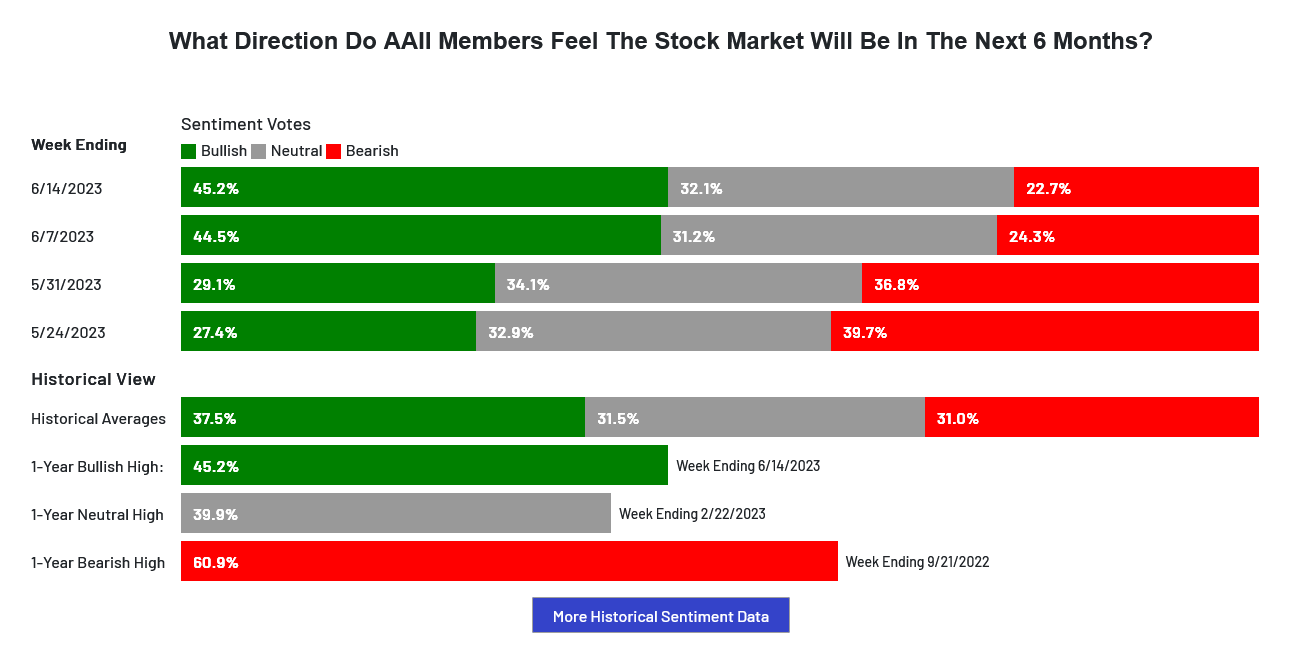
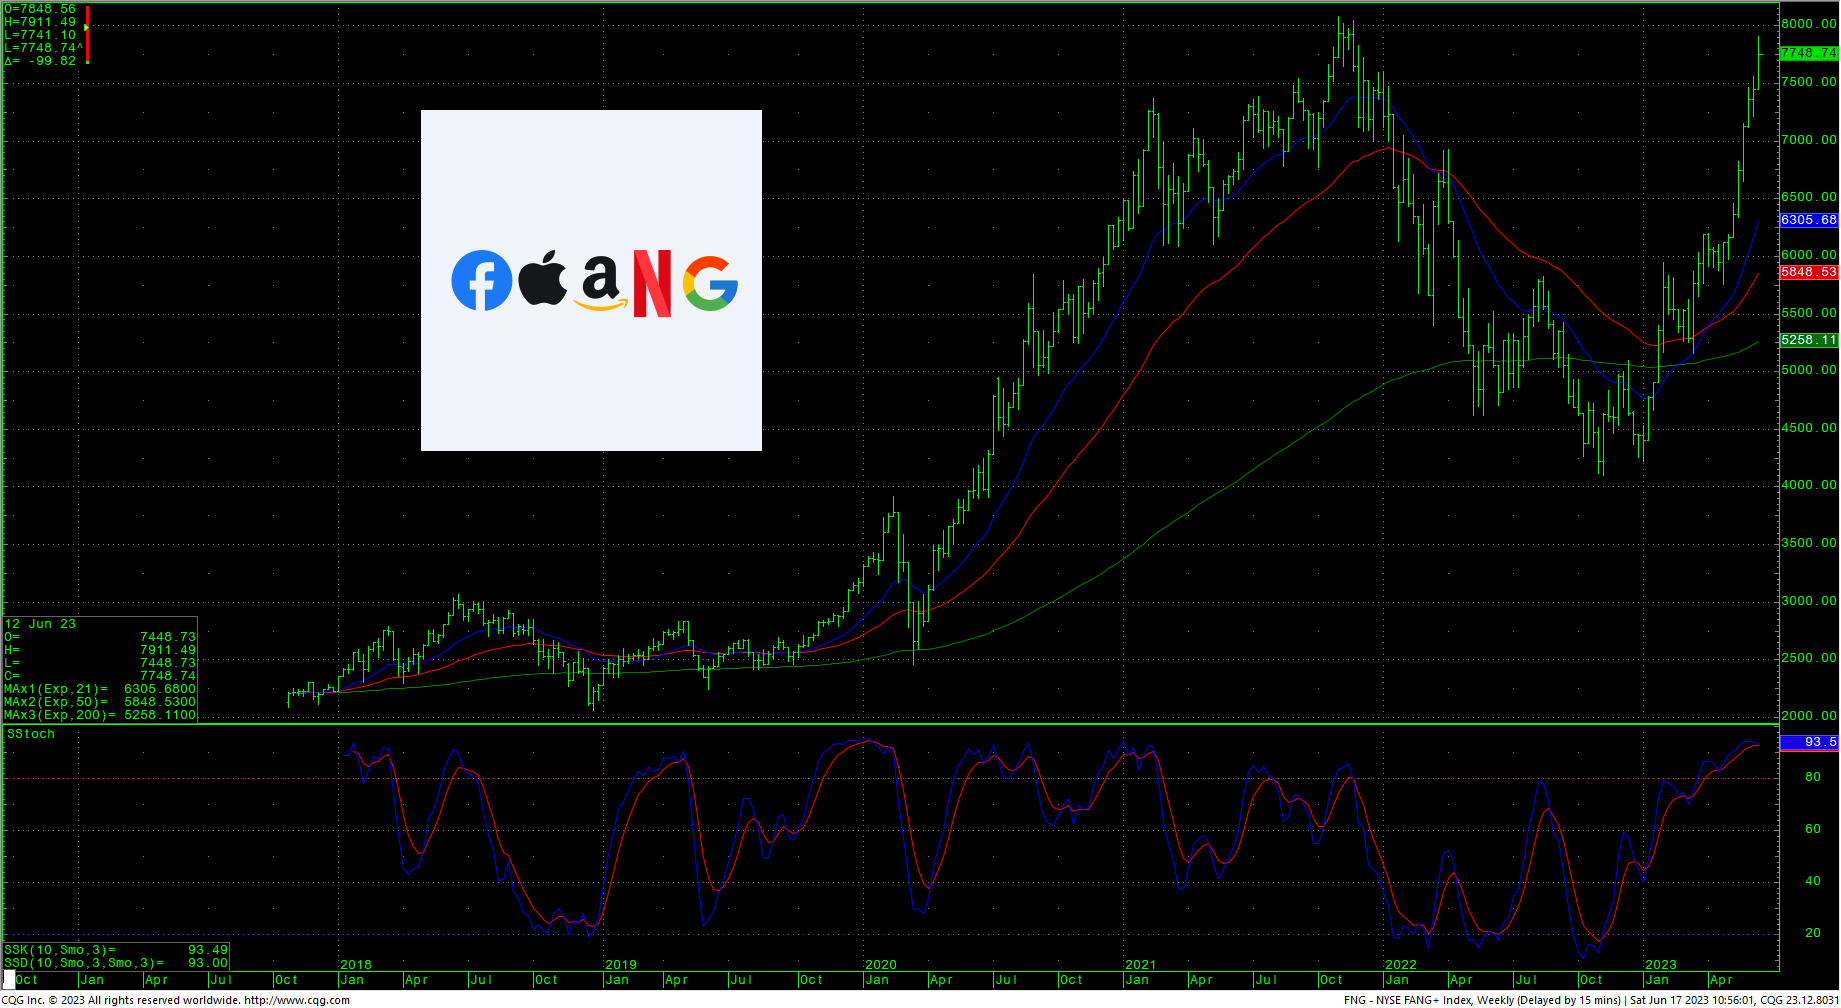
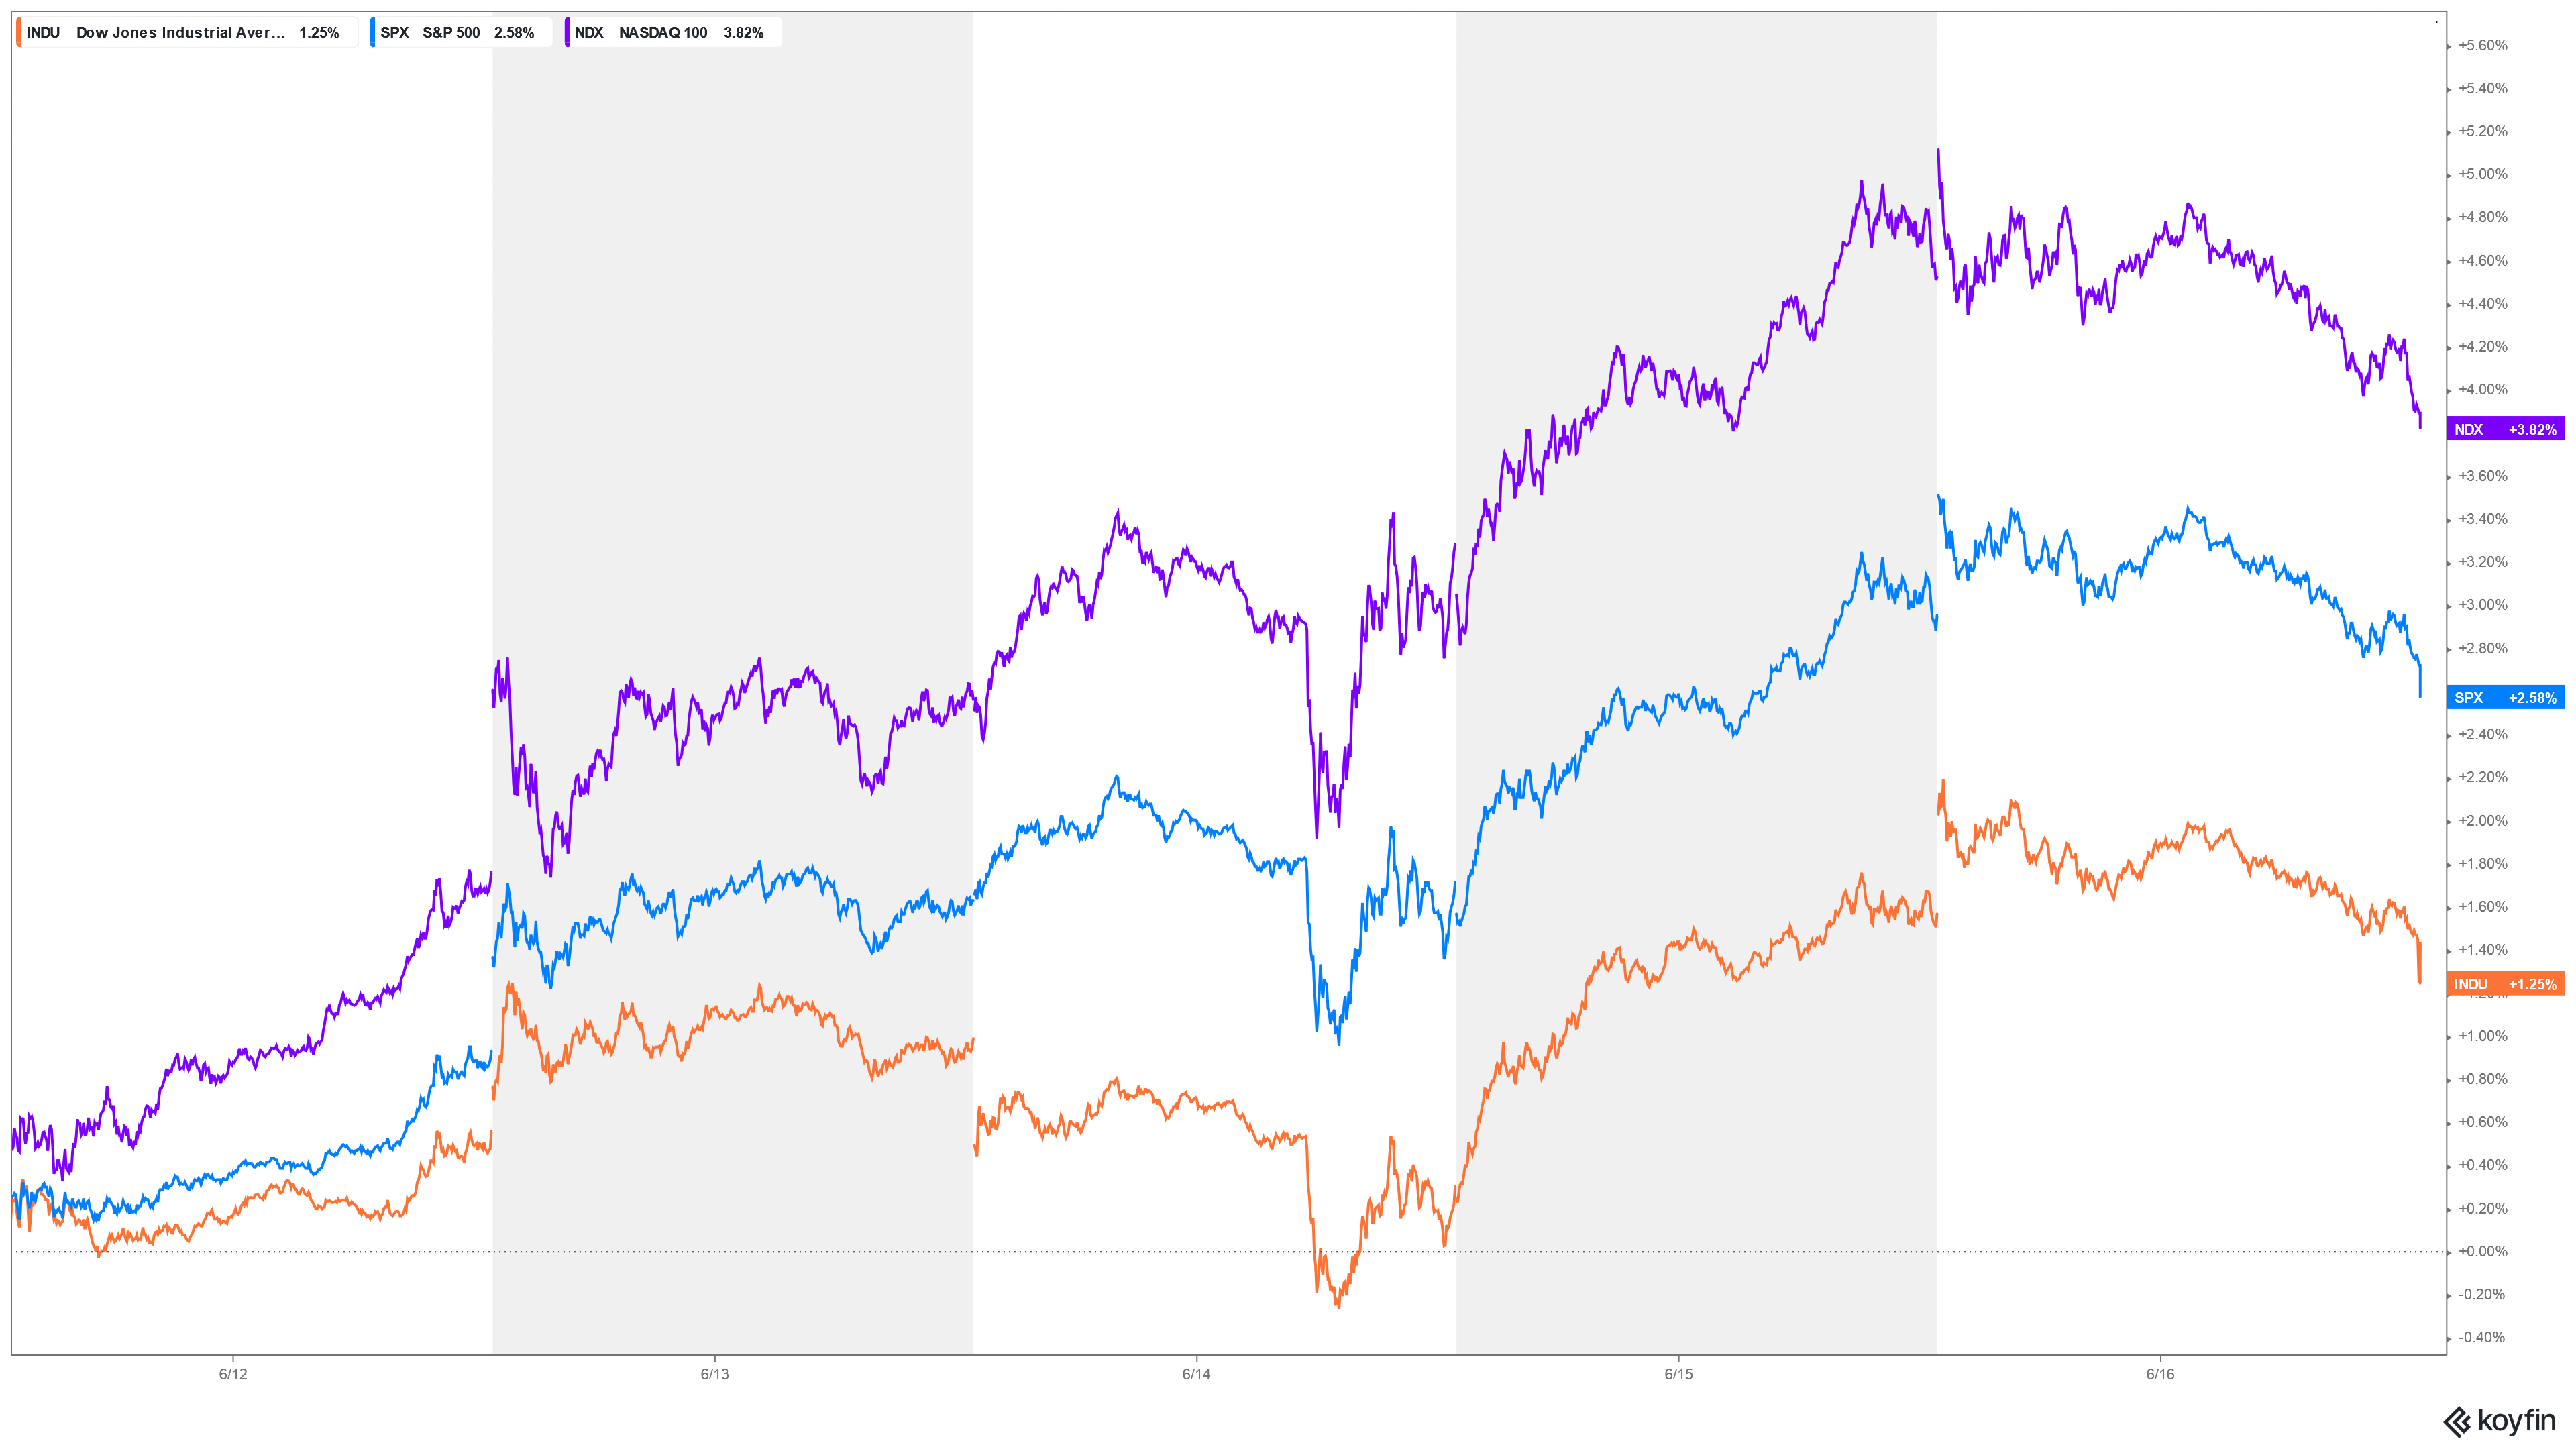 Stocks continued their press higher last week with the Dow setting a new trading high for 2023 and closing just shy of the weekly high close of 9 January 2023. The S&P 500 has moved into the highest daily close since 21 April 2022 and the highest weekly close since 4 April 2022. The Nasdaq and the FANG continued to outperform the overall market and the blistering Russell cooled the jets a bit this past week. Friday’s selloff relieved some of the severely overbought conditions on the hourly charts. The past two weeks trade has changed market sentiment to decidedly bullish/greedy and the CoT shows that commercial longs have done some liquidation whilst the speculative shorts were forced to cover. It looks like new highs for 2023 were met with both profit taking and FOMO. The AAII survey moved from a clearly pessimistic outlook to two weeks of straight optimism. The VIX Index set the lowest weekly close since 13 January 2020. Another frothy indicator was the 52-week A/D line which settled at +1.52%. Friday marked minor cycle timing for the reversals and the next key timing point is June 30th, where there is potential for increased volatility and fast moves. The Dow closed the week up +1.25%, The S&P was up +2.58% . The Nasdaq ended the week up +3.25%, setting the highest close since 9 January 2022. The FANG settled up +4.03% and it is the highest weekly close since 15 November 2021 as that index now closes in on the all-time record highs of late 2021. The FANG is now up +88.6% from it’s low in November of 2022 as prices have nearly DOUBLED in that time frame.
Timing Points
- 06/21 **
- 06/30 *** fast moves
- 07/10 **
CNN Fear & Greed Index
AAII Investor Sentiment Survey
 Dow Jones Industrial Average Hourly HLC
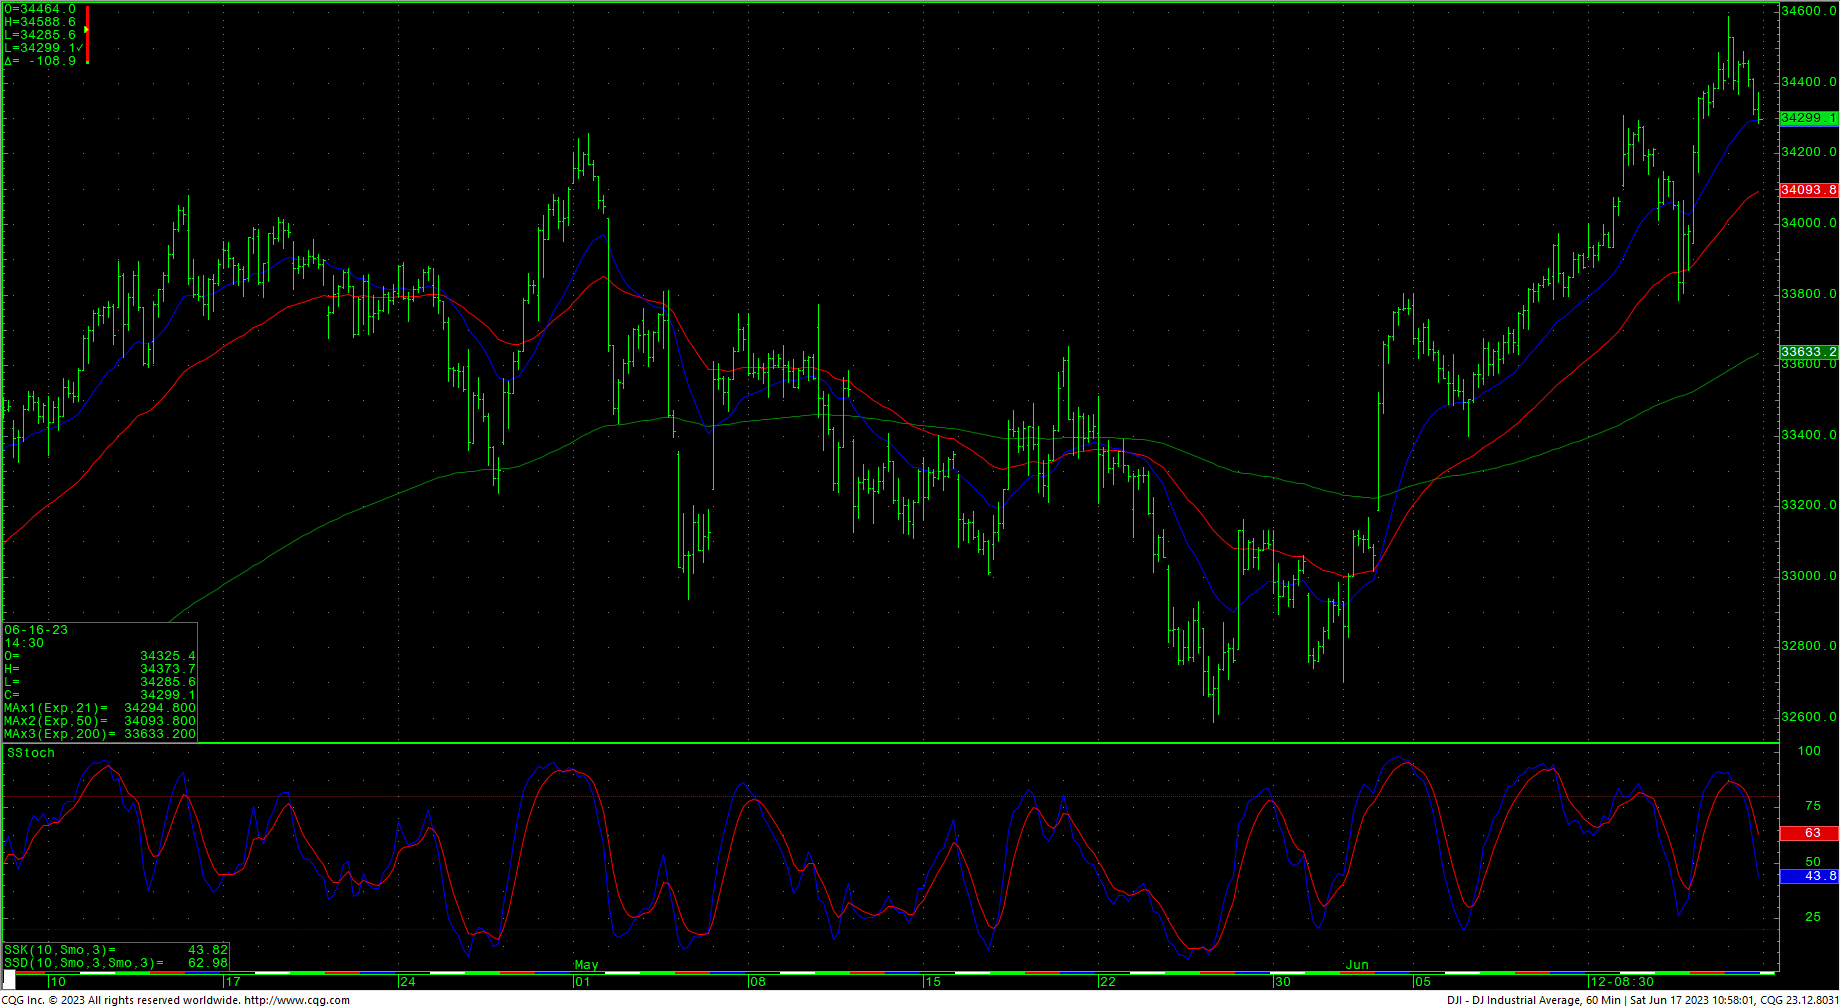 The Dow hourly is relieving extremely overbought conditions with Friday’s minor timing reversal. close. Once again, a case can be built for the Dow to be in a sloping, inverted head & shoulders pattern. The breakout through the neckline of this H&S pattern gives long-term counts to 37095. Continued rallies with closes over 34342 are friendly for a test of the late 2022 highs at 34712. A drive over 34712 can test significant long-term resistance at 34879 and 34995 and offers full counts back critical resistance at 35492. Closes over 35492 will open counts to 35824. Closes over 35492 should minimally test a gap area on the daily at 35996 to 36044. The H&S pattern counts to long-term targets at 37095.
Dow Jones Industrial Average Weekly HLC
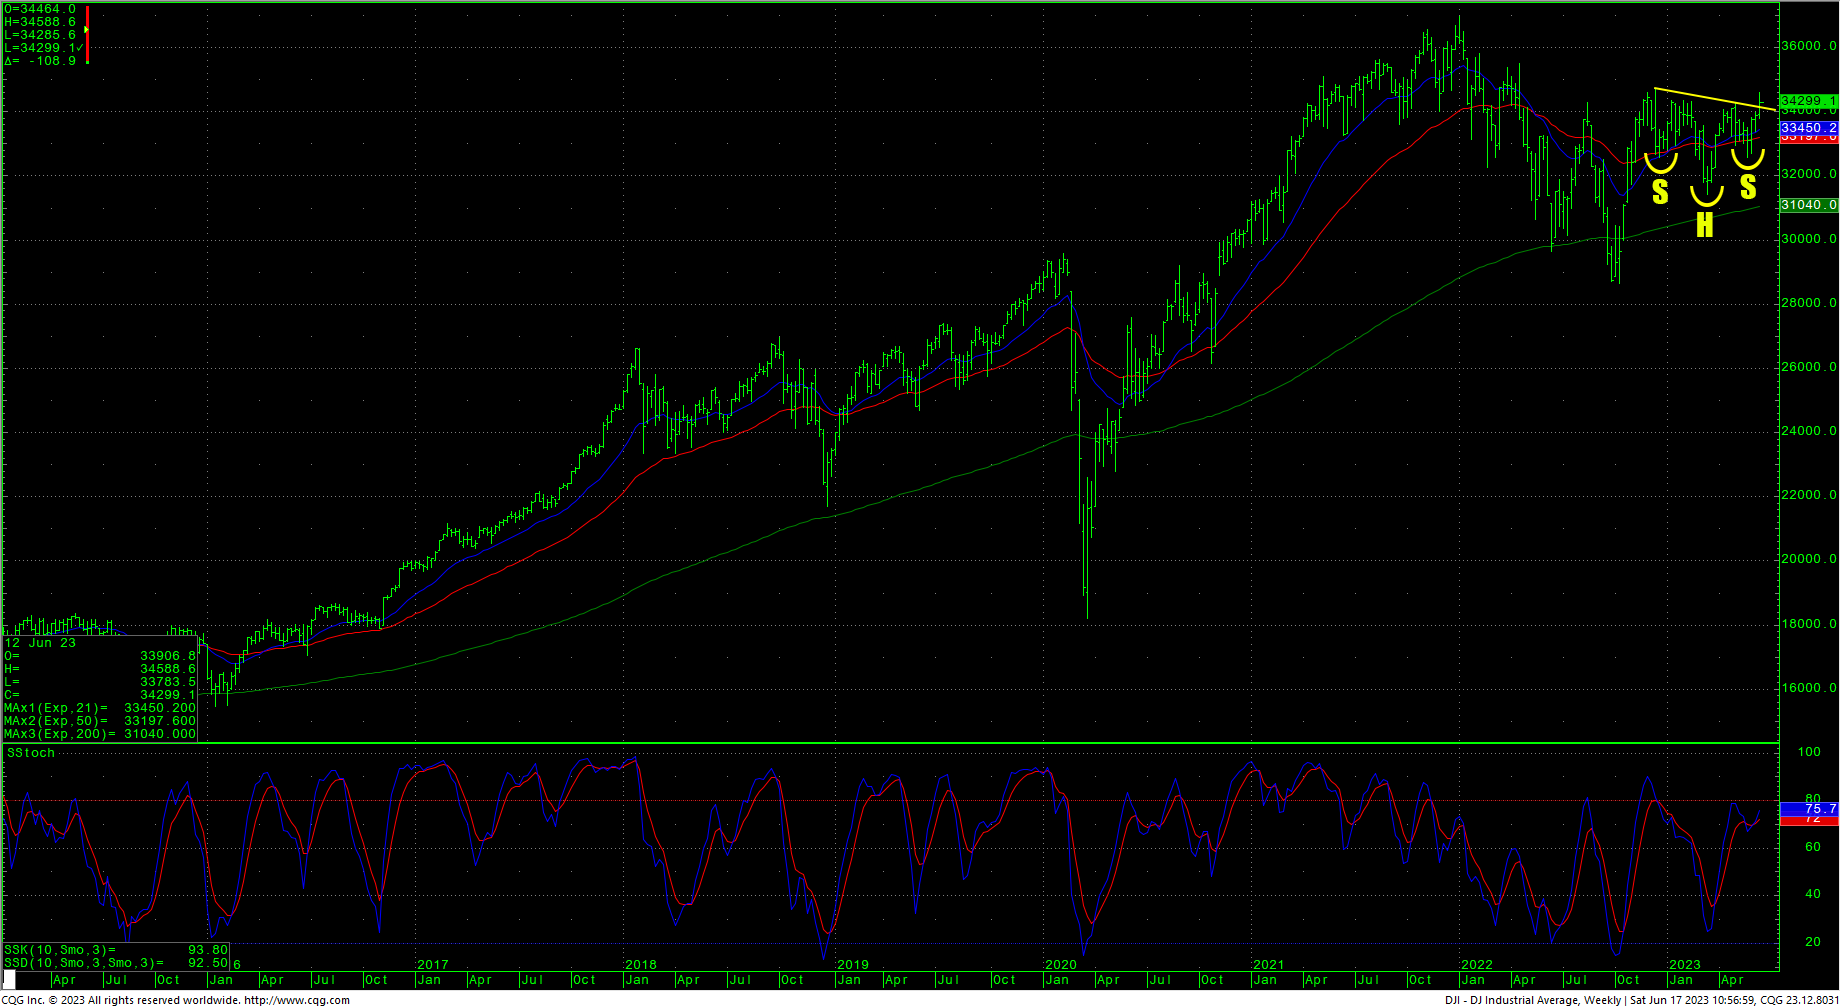 Support for the Dow is at 34116 and 33843/33824. A breakdown under 33824 can test 33567 with potential to pivotal short-term support of 33351/33340. Daily closes under 33340 open counts to 33009 with potential to critical near-term support of 32636/32620. Closes under 32620 will count to 32219/32175. A breakdown under 32175 sets up a test of intermediate support in the 31727/31686 level. A breakdown with closes under 31686 will open counts into the 30972/30960 level with support of 31429/31423 and 31160. There is a gap on the daily chart that runs from 31160 to 31119.
Resistance
- 34334/34342 *** ↑
- 34395 **
- 34495 **
- 34595 **
- 34712 *** ↑
- 34879 ***
- 34995 *** ↑
- 35112 **
- 35225 **
- 35372 ***
- 35492 *** ↑
- 35800/35824 *** ↑
- 35996 ***
- 36044 *** ↑
Support
- 34416 **
- 33843/33824 *** ↓
- 33747 **
- 33587 *** ↓
- 33381 **
- 33251/33340 *** ↓
- 33261 **
- 33195 **
- 330009/33000 *** ↓
- 32843 ***
- 32636/33620 ***
- 32500 **
- 32396 **
- 32319/32175 *** ↓
- 31950 **
- 31828/31805 *** ↓
S&P 500 Cash Index
The S&P hourly is working off extremely overbought conditions on the short-term charts. The market is trading into new yearly highs and as noted above, the action has seen some profit taking from the commercial longs. With Thursday’s close, the S&P500 scored a +23.7% advance, and with all the frothy sentiment, market commentaries have turned to predictable ‘bull market’ diatribe. Prices have cleared some big overhead resistance at 4311/4315 and continued rallies should carry the cash index toward long-term critical resistance of 4486/4505. Closes over 4505 can carry to 4593 with full potential toward 4637. A breakout above 4637 opens potential toward 4748 and ultimately 4818. Above the record highs opens counts to 4952/5000.
S&P 500 Index Weekly HLC
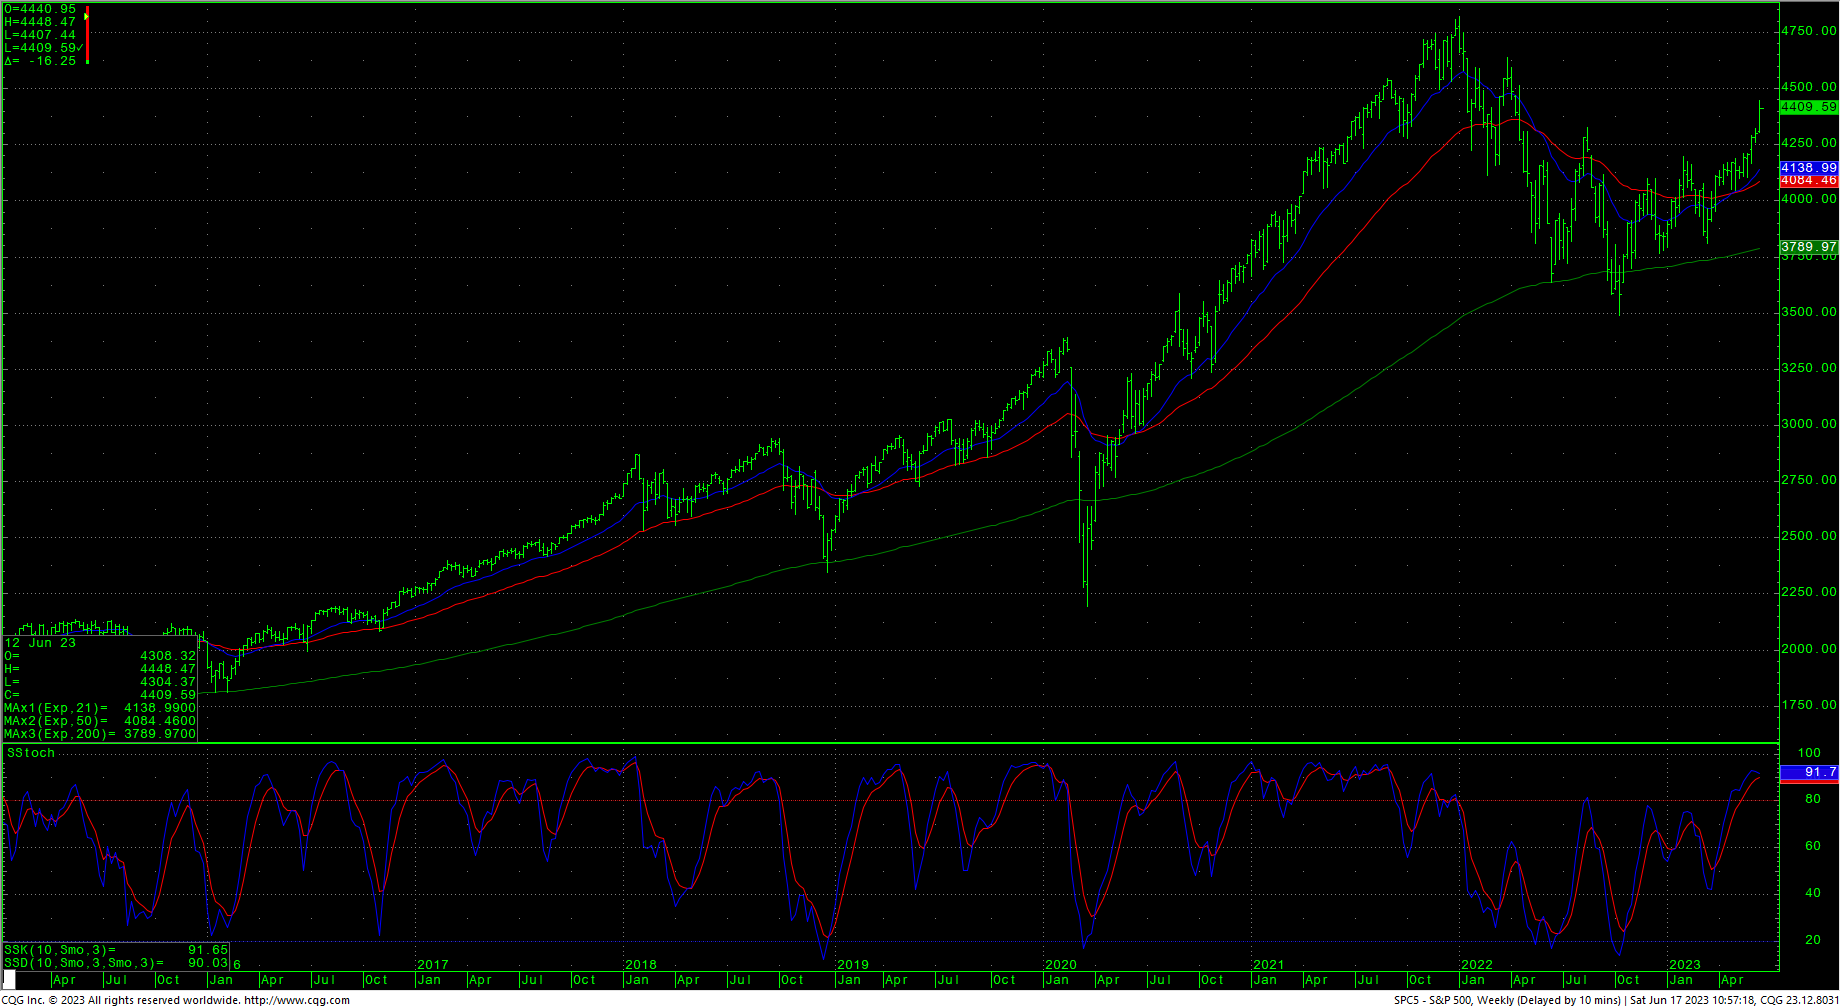 Support is 4354 and 4295/4290. A breakdown under 4290 opens counts to 4248 with potential to pivotal short-term support of 4204/4200. Daily closes below 4200 open counts to 4128 with potential to critical near-term support at 4053/4050. Under 4050 sets up a move to 3970 with a shot at critical daily support of 3857/3850. A breakdown with closes under 3850 opens counts to support against the 3691/3680 level. Under 3680 sets up a move to 3657 and full potential back to critical long-term support of 3505/3491.
Resistance
- 4290 **
- 4311/4315 *** ↑
- 4350 **
- 4385 *** ↑
- 4430 **
- 4486 *** ↑
- 4505 *** ↑
- 4593 **
- 4637 *** ↑
- 4665 **
- 4748 *** ↑
- 4818 *** ↑
- 4952 ***↑
- 5000 *** ↑
Support
- 4391 **
- 4354 ***
- 4295/4290 *** ↓
- 4248 *** ↓
- 4204/4200 *** ↓
- 4169 **
- 4128 *** ↓
- 4053/4050 *** ↓
- 3970 **
- 3857/3850 *** ↓
- 3765 **
- 3691/3680 *** ↓
- 3657 *** ↓
- 3503/3491 *** ↓