
TECHNICAL ANALYSIS
Major Indices Week of August 11, 2023
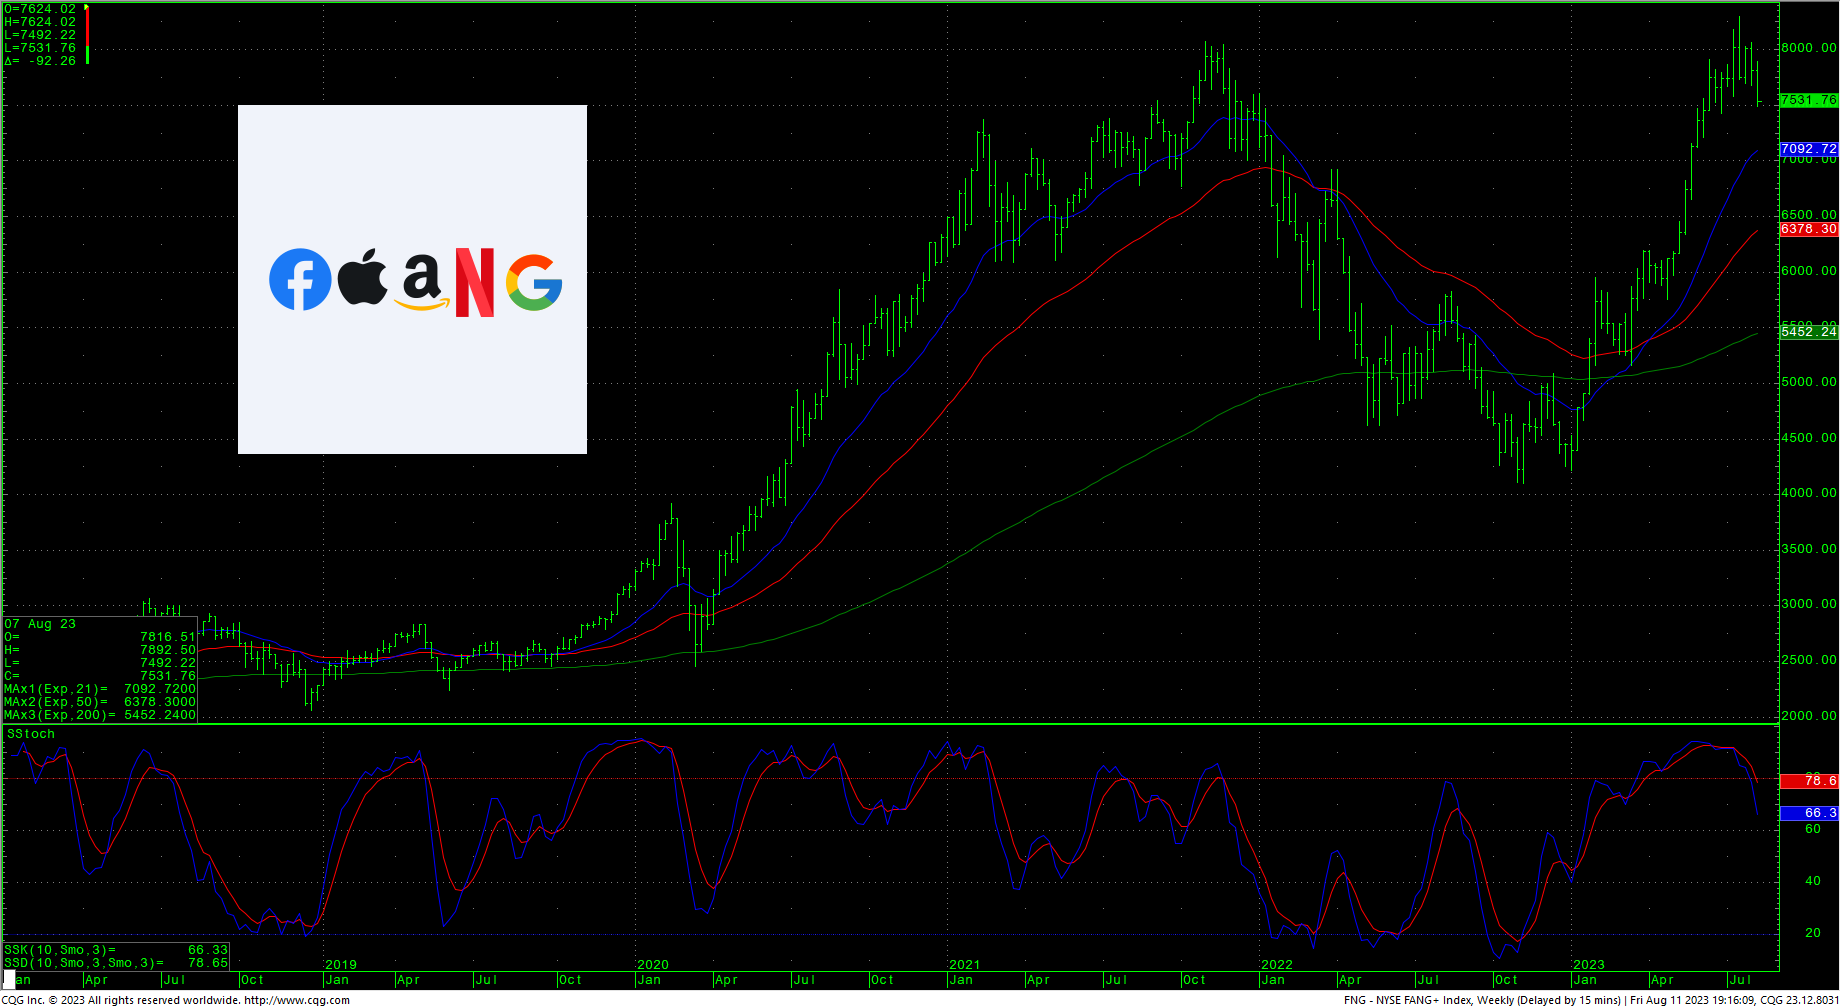
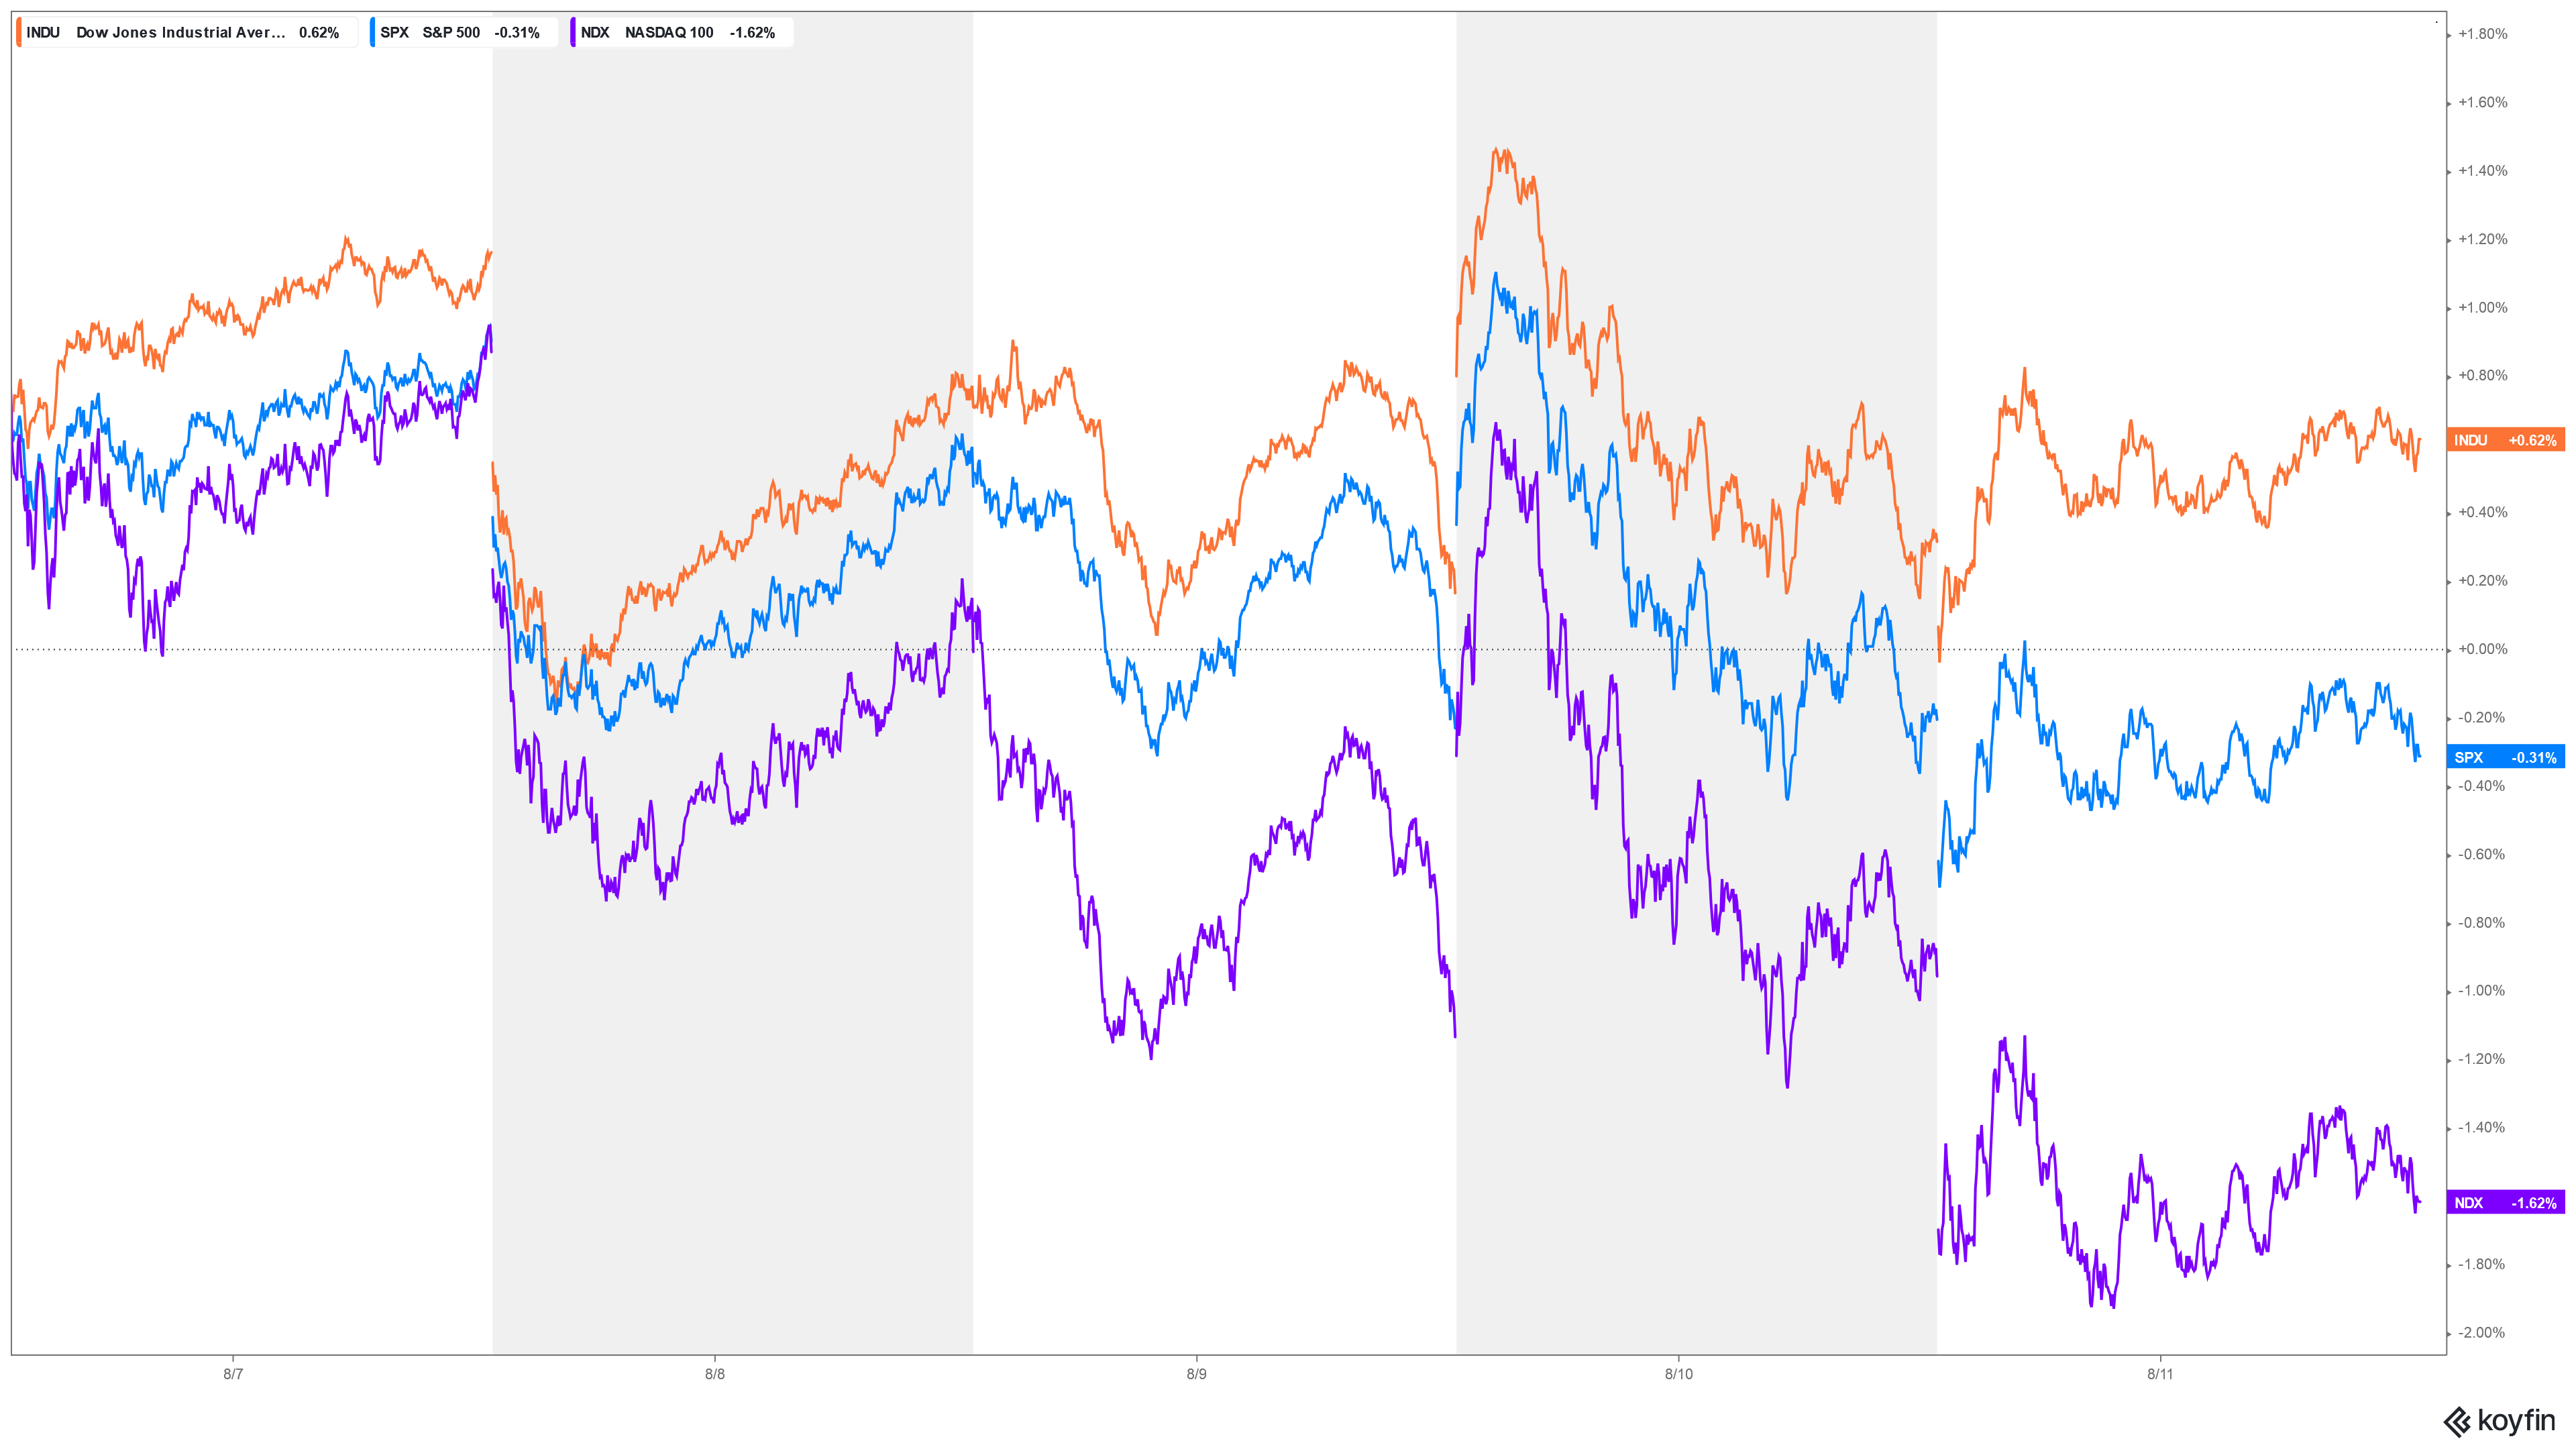 Stocks had a decidedly mixed trade the past week with the blue chips leading the way while the tech sector continues its selloff from the CRITICAL timing of July 20/21, which thus far marks the tops in both the FAANG and the Nasdaq indices. S&Ps traded a very tight weekly range and settled in the upper half of the week’s range, registering the second bearish candle in a row on that chart…which is working off some overbought conditions. The S&P daily is now reaching into slightly oversold territory and the Dow daily is building what looks like a flagging pattern as that chart holds the breakout area above 35000. Wednesday’s minor timing caught the low close for the Dow and the next timing point is this Tuesday, which should be a bit stronger for the cycles. Both hourly charts for the Dow and the S&P are basically neutral right now as prices have created some extremely manic swings the past week. The next critical timing point is August 22/23. This Tuesday marks minor timing.
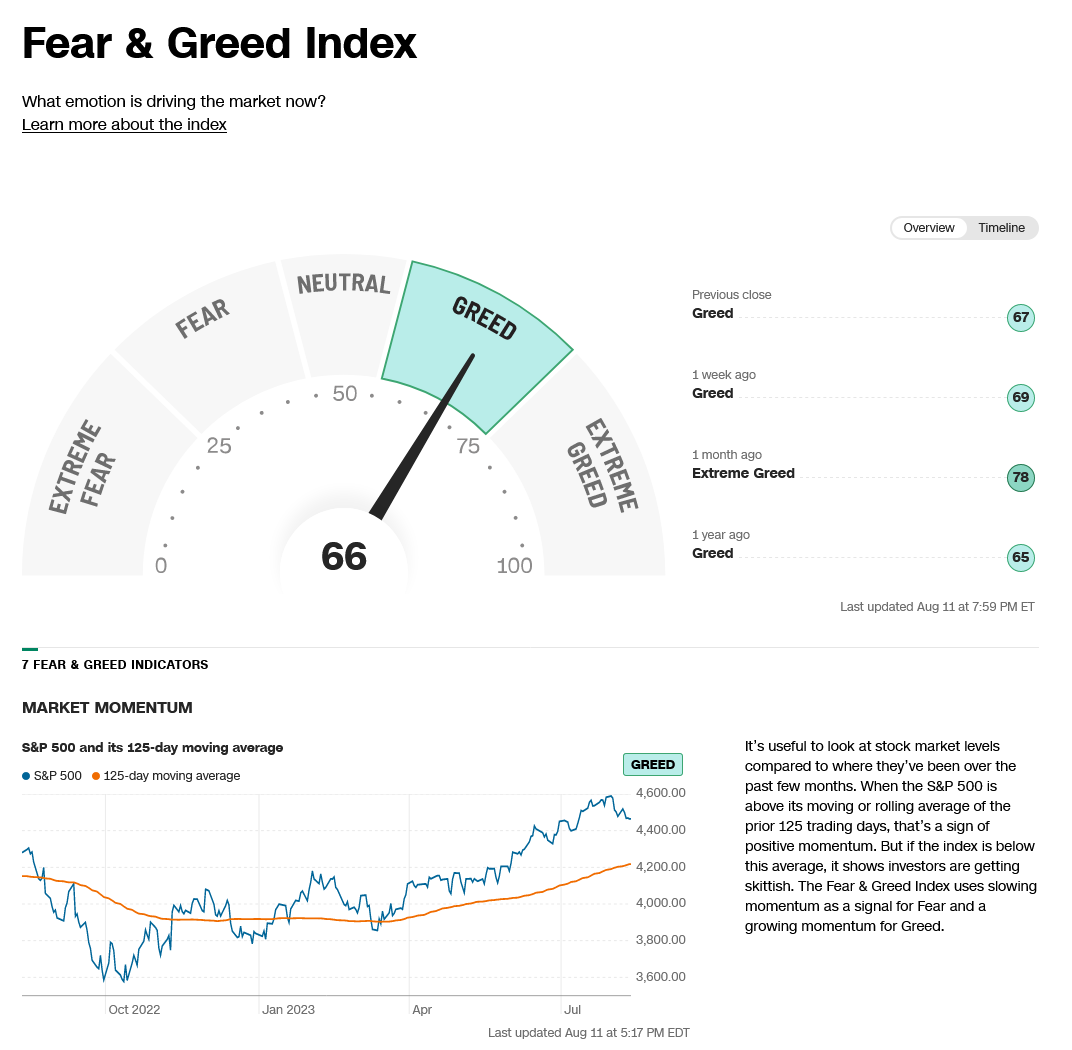
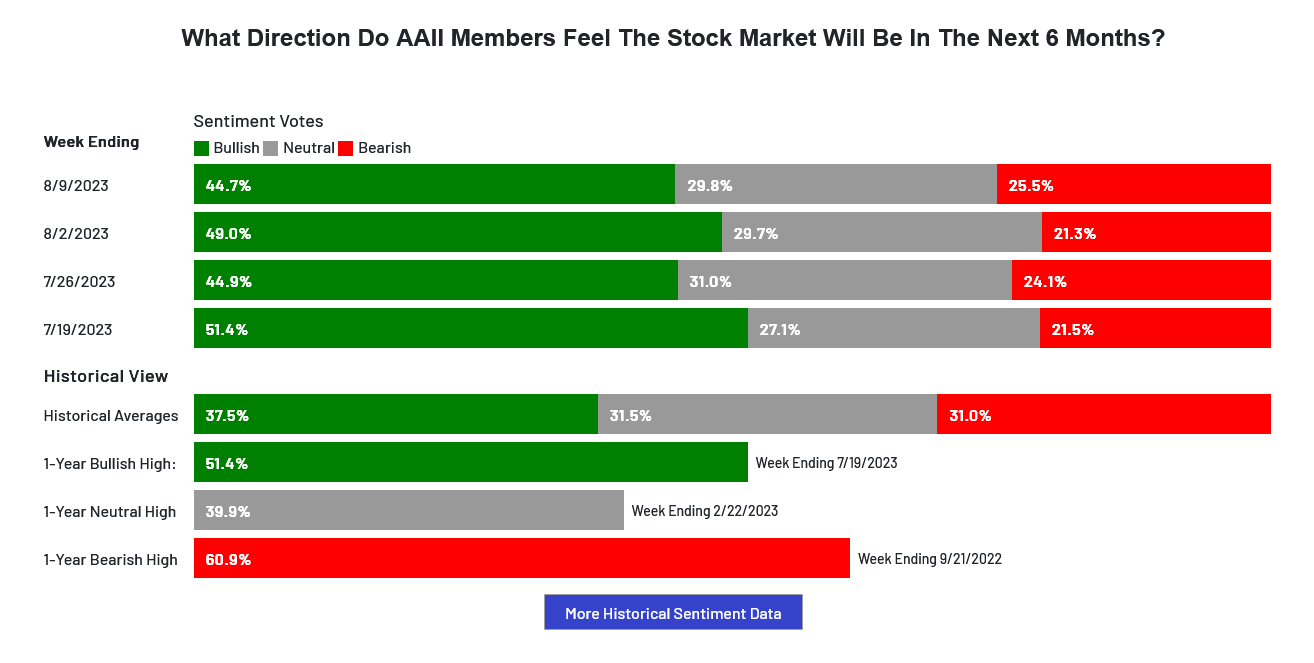
Sentiment has tempered with the manic sideways trade although most near-term surveys remain at frothy/greedy levels. The AAII Sentiment Index has hit optimism above average for the 10th week in a row. The VIX staged a downside reversal on the weekly after reaching a two month high intra-week. The 52-week, A/D line remains greedy at +3.09%. The Put/Call ratio has cooled dramatically, moving back to 0.88, a level last seen 24 May 2023—when the Dow was at 32800. The Dow closed the week up +0.61%. The S&P was down -0.31%. The Nasdaq ended the week down -1.90%, the FANG closed down -3.64% with the Russell off -1.64%. Safe-haven sentiment is showing a FEAR reading as the bond markets are testing the late 2022 bottoms. Commodities hit a new 2023 high last week, led by crude oil as that market traded to the highest levels since late 2022. The Commitment of Traders CoT sees alightly more unwinding of commercial positions at the expense of the speculators. Asset managers are adding to their positions and the past couple weeks some funds have started to move back into the market. Remember that funds have been absent or outright short for the majority of 2023 and are sitting on large cash positions…perhaps one reason why BRKA set record highs last week? Note that usually, as goes Berkshire, so goes the overall market.
Timing Points
- 08/15 ***
- 08-22/23 *** X Key-Critical
CNN Fear & Greed Index
AAII Investor Sentiment Survey
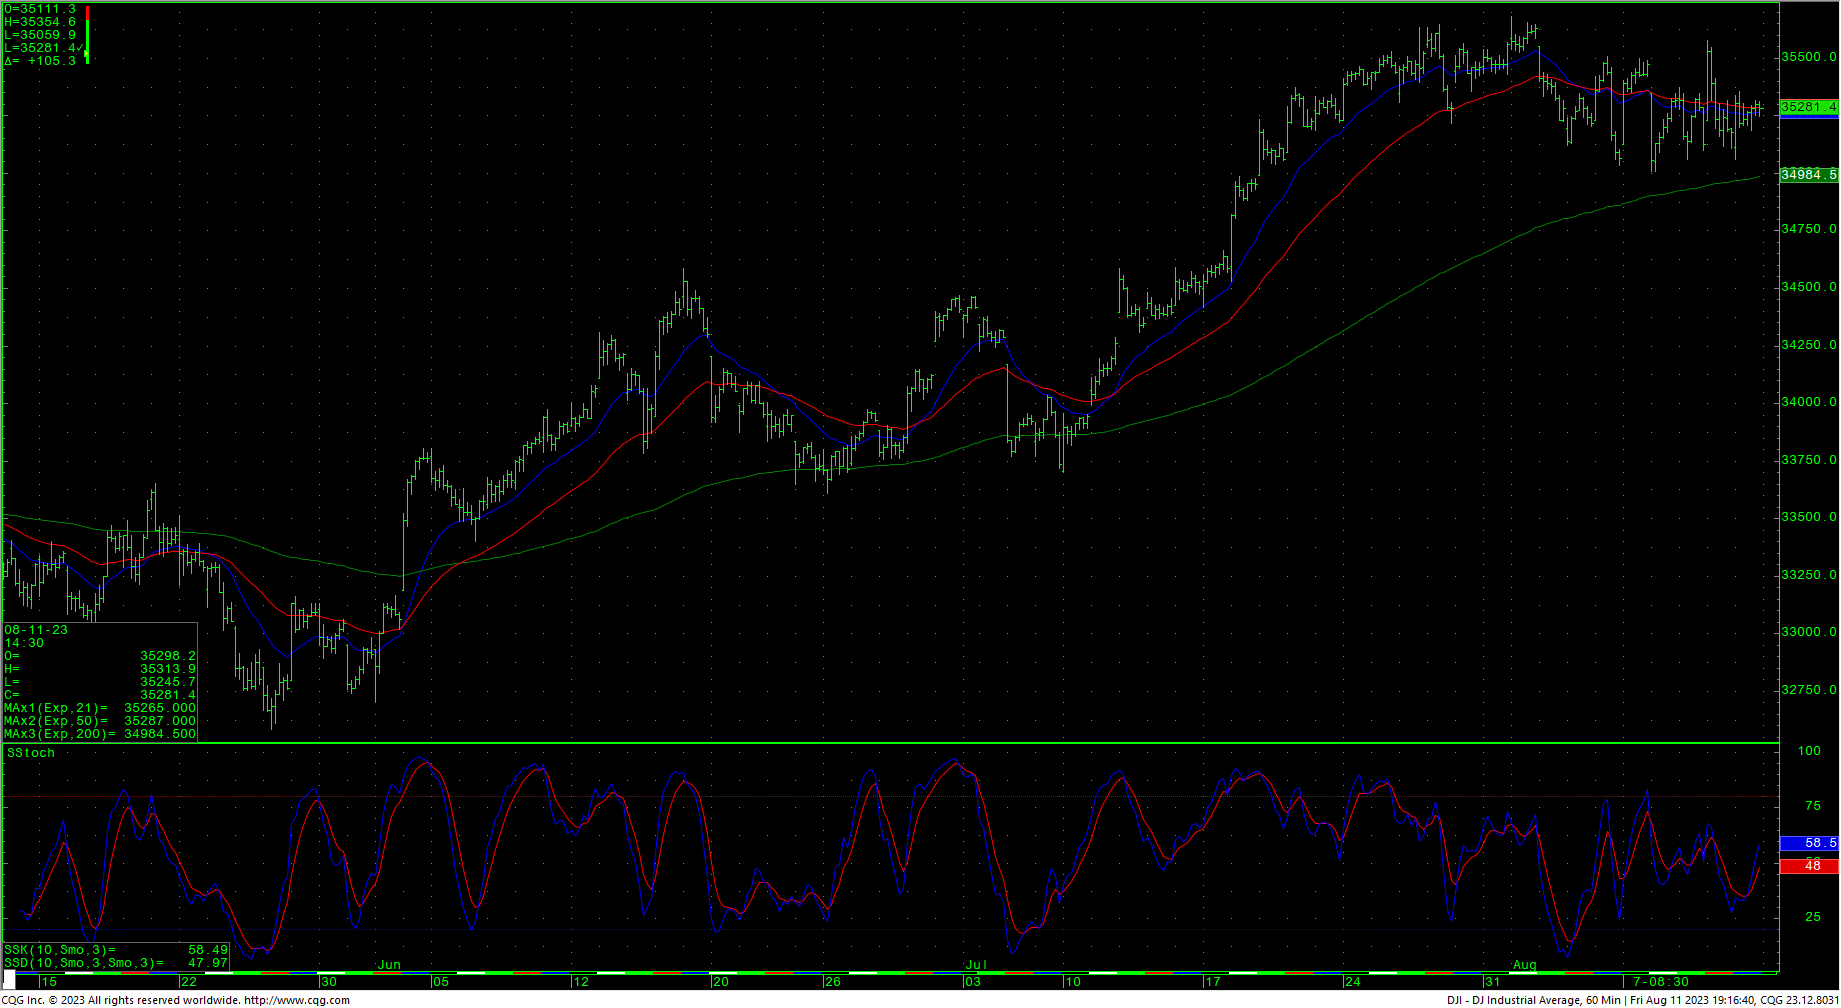
Dow Jones Industrial Average Hourly HLC
Dow Jones Industrial Average Daily HLC
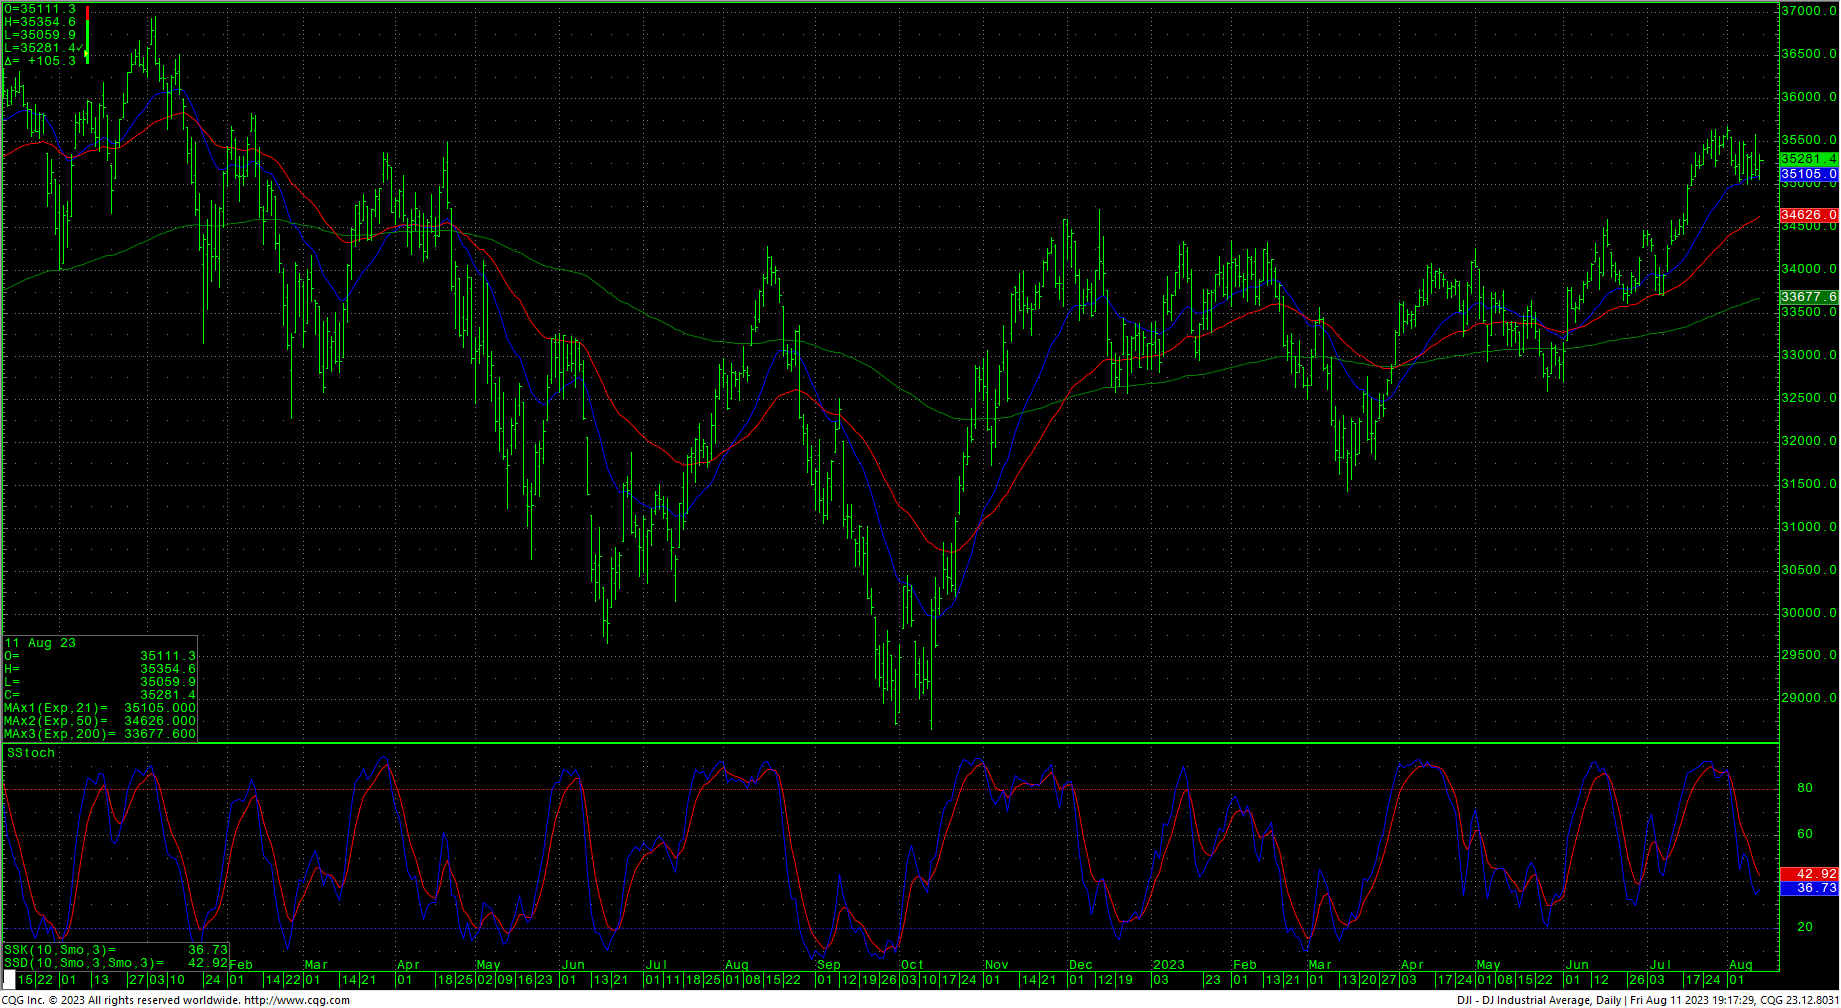
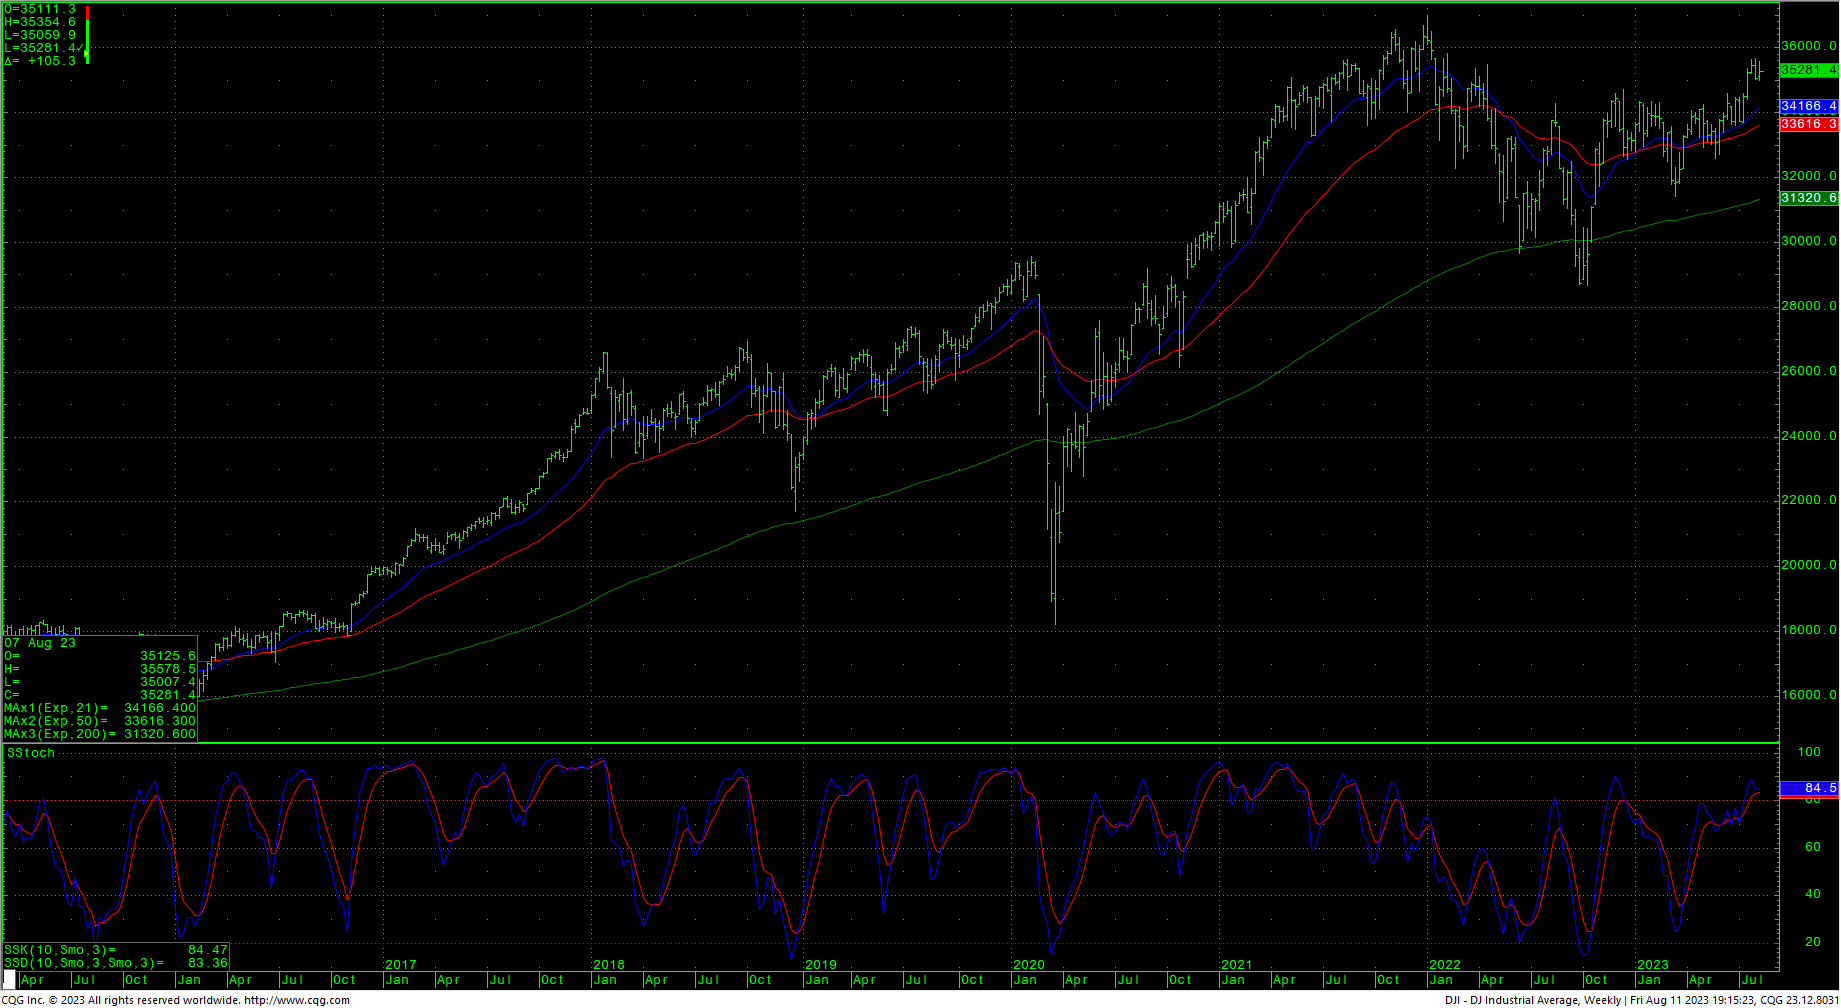
The Dow hourly is manic and trying to hook up from slightly oversold conditions as the daily builds a flagging pattern above the breakout area at 35000. Last week’s trade leaves most of the technicals the same. Resistance remains at 35356 and 35432/35440. Further rallies back over 35440 suggest a test of the trading highs at 35679 with intermediate counts to 35824 and longer-term counts into a gap area on the daily at 35996 to 36044. A breakout over 36044 sets up the 36513 area with potential to test the all-time record highs at 36952. A reminder that the larger inverted H&S pattern on the DJIA weekly counts toward long-term targets at 37095.
Support for the Dow is at 34888, 34644 and short-term pivotal at 34400/34390. A breakdown with closes under 34390 opens counts to 34132 with potential to short-term critical support of 33767/33760. Daily closes under 33760 open counts to major short-term support in the 33359 through 33316 area. Closes under 33316 can test 32998 with counts to critical intermediate-term support of 32586/32580. Closes below 32580 suggest a move to 32170 with potential to 31341/31330.
Dow Jones Industrial Average Weekly HLC
Resistance
- 35356 ***
- 35432/35440 *** ↑
- 35492 **
- 35578 ** ↑
- 35670 *** ↑
- 35800/35824 *** ↑
- 35996 ***
- 36044 *** ↑
- 36271 **
- 36390 **
- 36513 ***↑
- 36636 **
- 36934/36952 *** ↑
- 37095/37096 *** ↑
Support
- 35033 **
- 34888 ***
- 34644/34640 *** ↓
- 34500 **
- 34400/34390 *** ↓
- 34270 **
- 34132 *** ↓
- 33990 **
- 33865 **
- 33767/33760 *** ↓
S&P 500 Cash Index
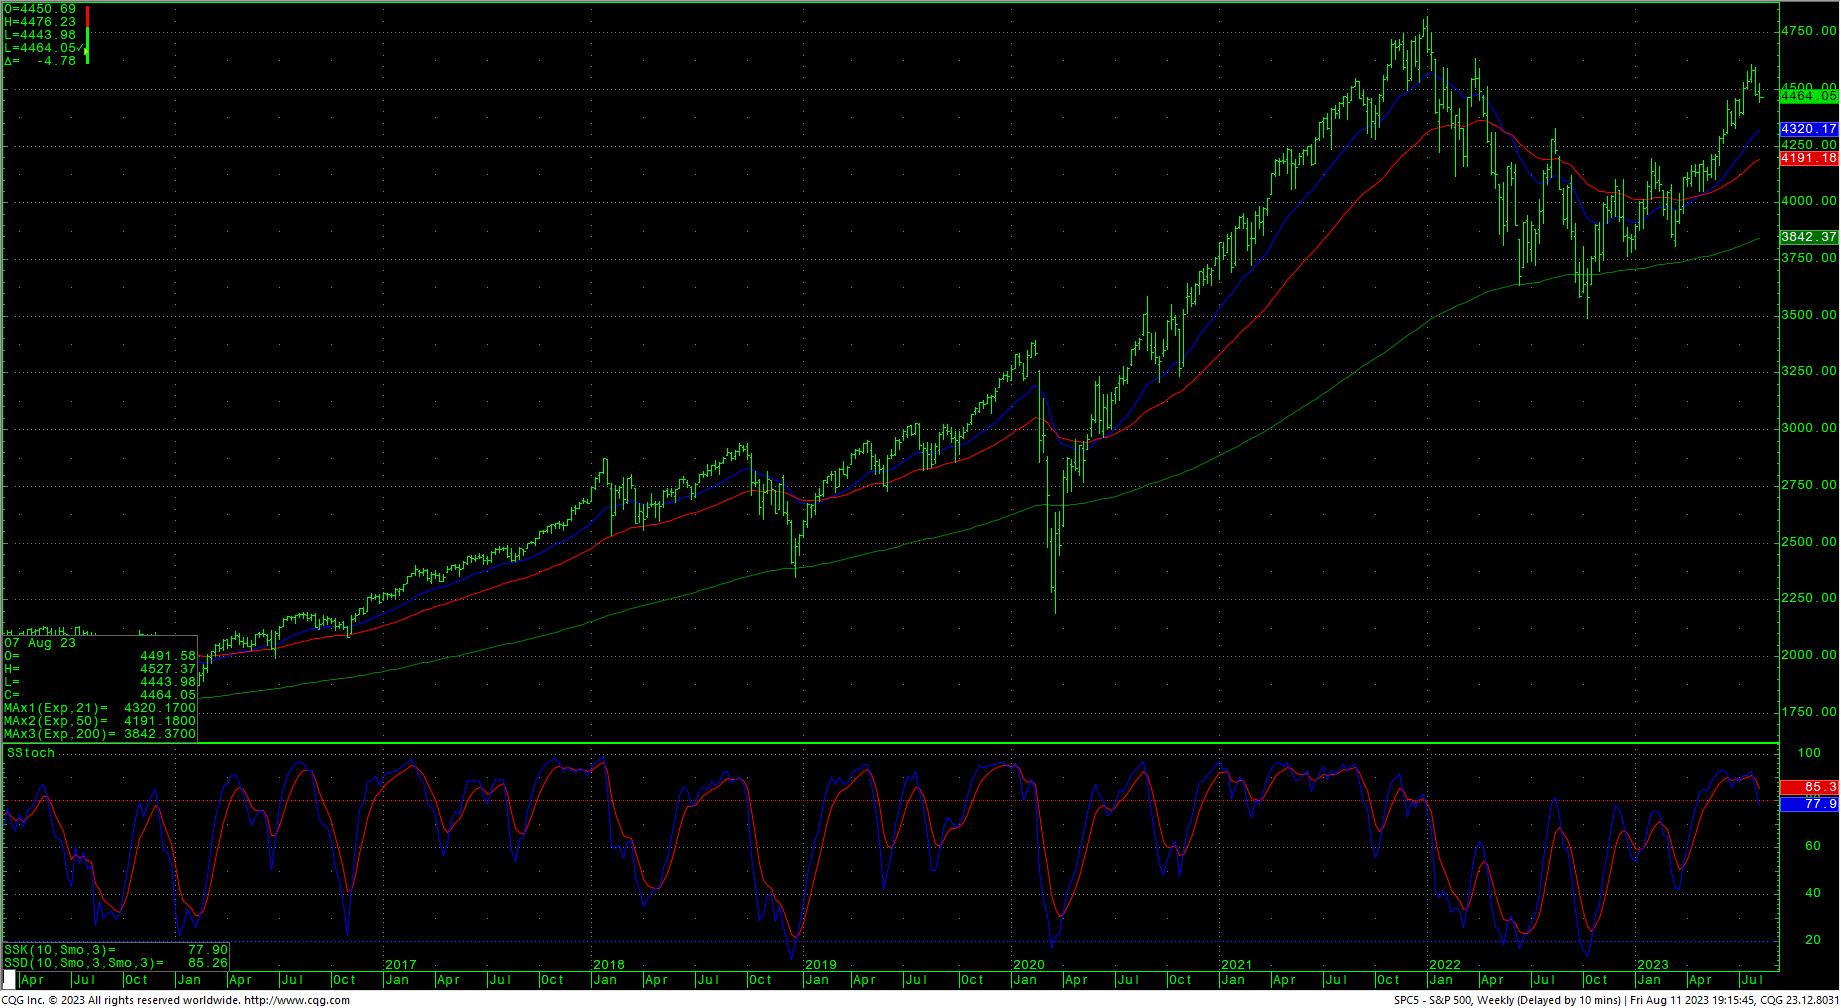
The S&P hourly ended Friday slightly oversold as that chart, like the Dow, is in a manic—but more pronounced—short-term selloff. There remains a key gap overhead now as prices congest above a key short-term support area at 4434/4430. Daily closes under 4430 set up a move to 4180/4177. Closes under 4177 open counts to 4049 and critical short-term support of 3917/3910. Daily closes below 3910 open counts to 3754/3750 with potential to support at 3503/3491.
Resistance short-term is 4482, 4506, 4525 and pivotal at 4544/4550. The hourly gap runs from 4550 through 4575. A drive back over 4575 is bullish for a test of the swing high at 4607. Closes over 4607 suggest a minimal test of 4637. A breakout with closes above 4637 opens potential toward 4748 and ultimately 4818. Above the record highs opens counts to 4952/5000 with potential to 5144.
S&P 500 Index Weekly HLC
Resistance
- 4476/4482 ***
- 4506 **
- 4525 *** ↑
- 4544/4550 *** ↑
- 4575 *** ↑
- 4593 **
- 4607 *** ↑
- 4637 *** ↑
- 4665 **
- 4748 *** ↑
- 4818 *** ↑
- 4952 ***↑
- 5000 *** ↑
- 5072 **
- 5144 *** ↑
Support
- 4443 ***
- 4434/4430 *** ↓
- 4405 ***
- 4280 **
- 4180/4177 *** ↓
- 4040 ***
- 3917/3910 *** ↓
- 3875 **
- 3754/3750 *** ↓
- 3625 **
- 3500/3491 *** ↓