
TECHNICAL ANALYSIS
Major Indices Week of September 15, 2023
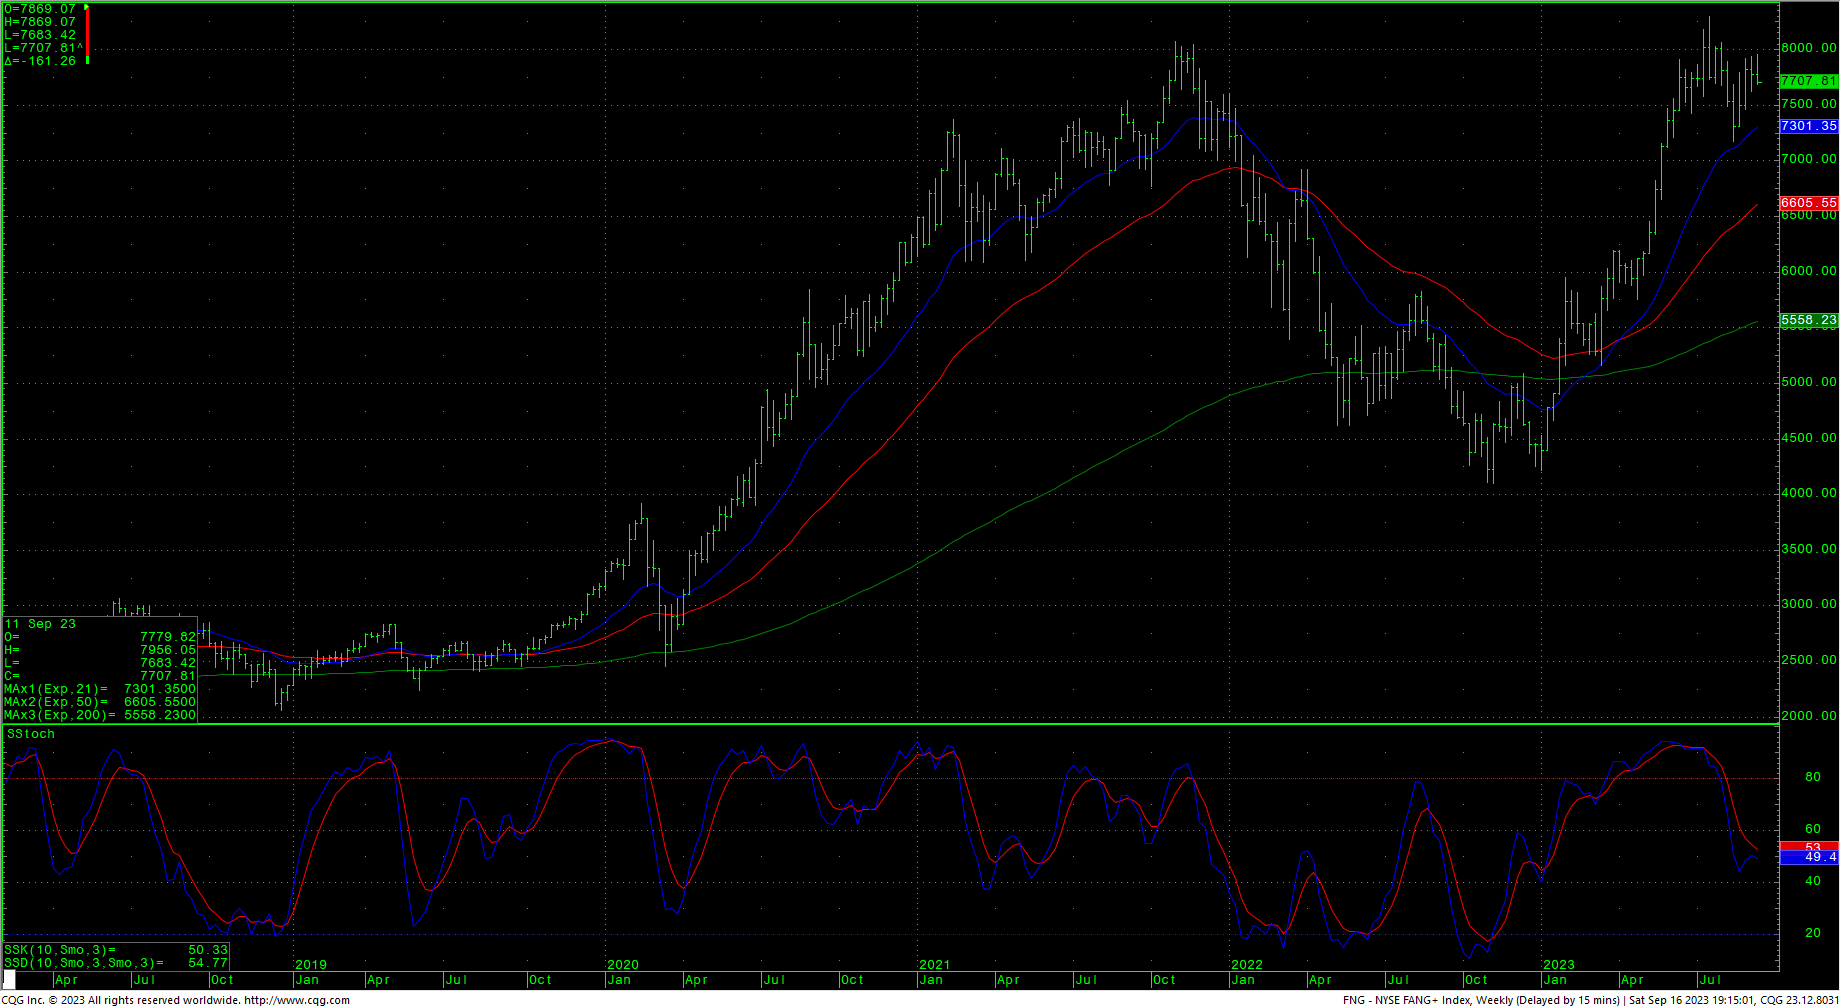
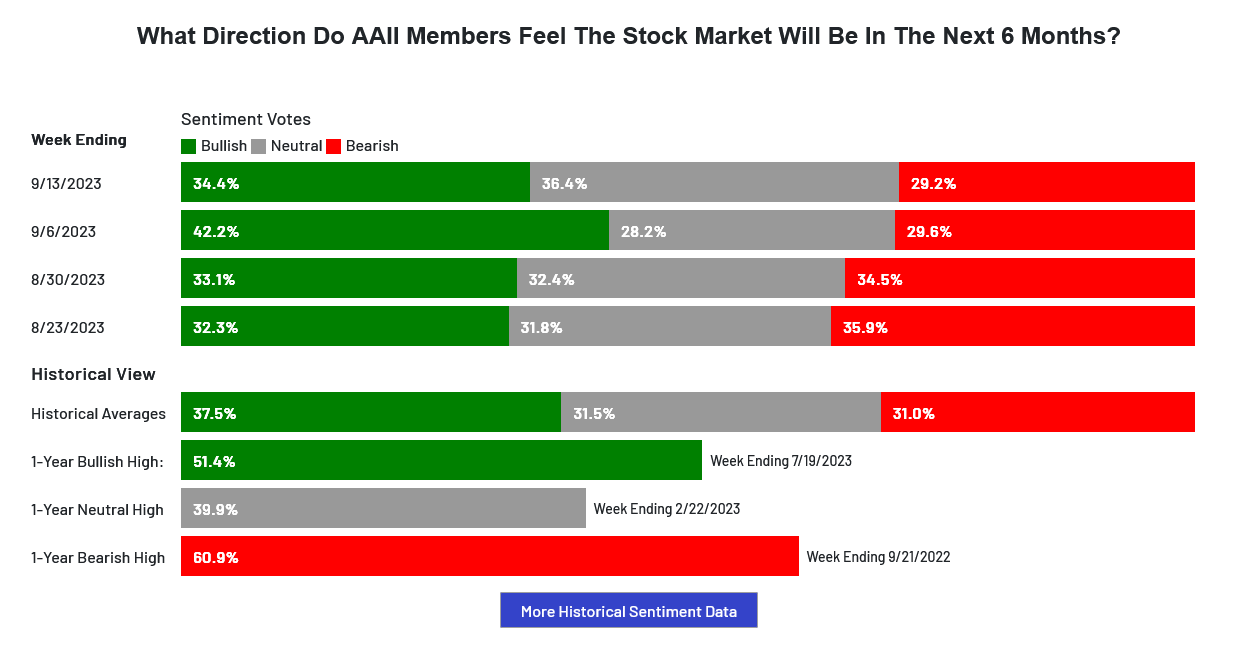
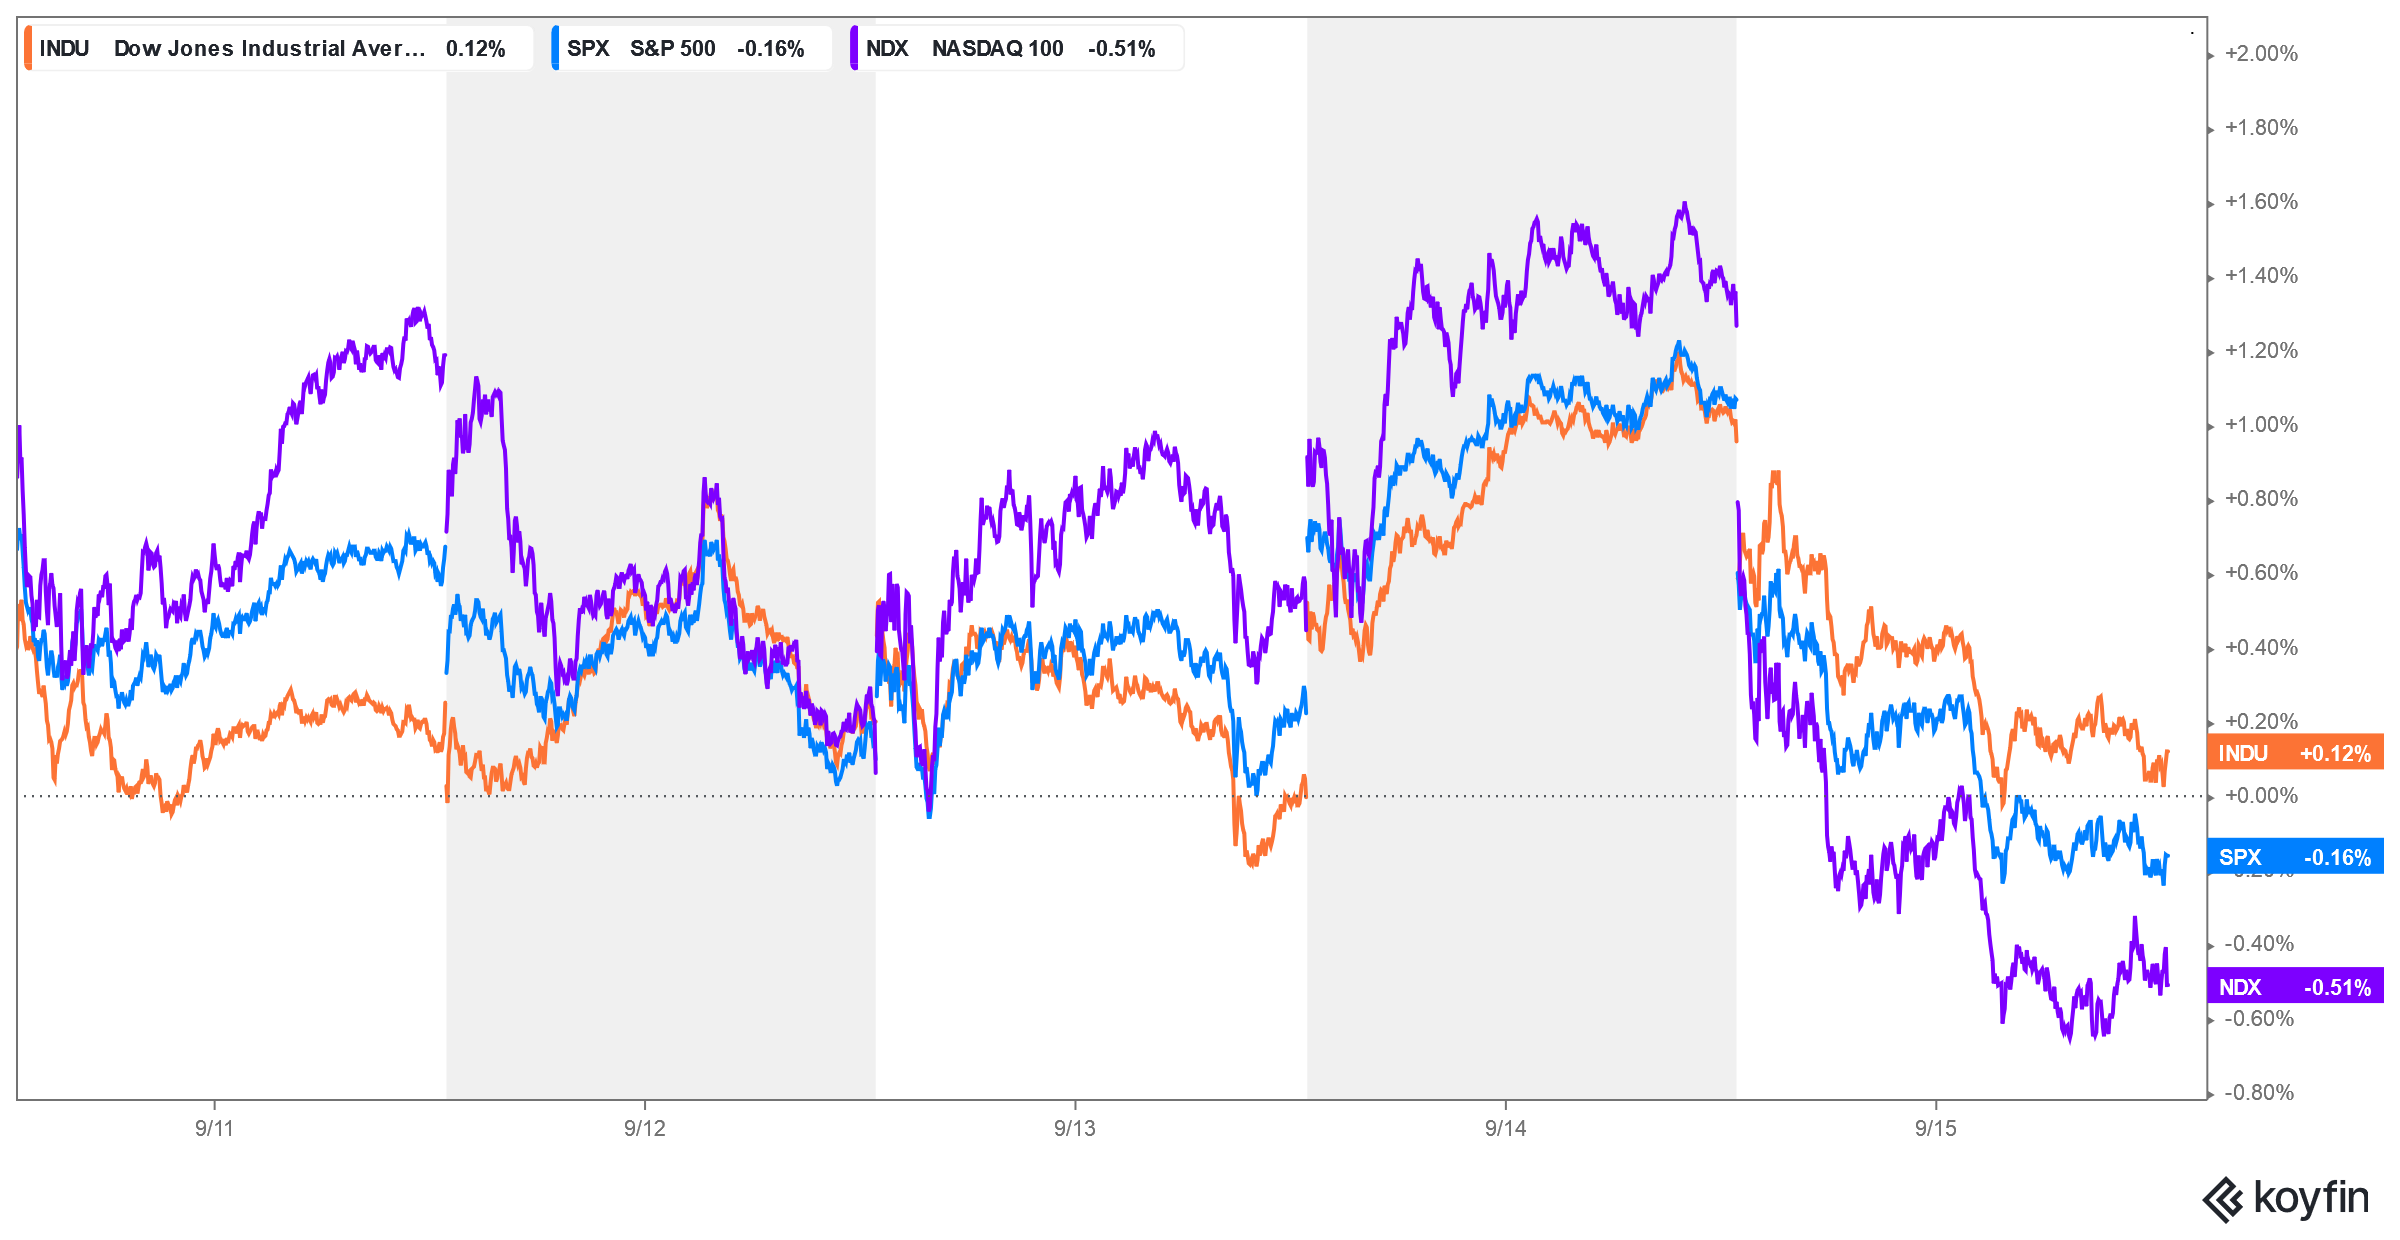 Stocks closed out a volatile week lower, with all indices recording weekly losses and settling at the bottom of the week’s range. Prices reacted to the timing on Thursday which coincided with the past quarter’s Triple Witching. The weekly charts continue to work off overbought conditions, the daily charts remain mostly neutral, and the hourly charts are slightly oversold on the closes on Friday. The next timing date is minor and is this coming week’s Friday trade. Sentiment has shifted to mostly neutral while fear still dominates the fund-related sector. The AAII Sentiment Index moved to the highest neutral reading since last May. The VIX closed flat, in the middle of the weekly range after hitting a 2.5 year low. The 52-week, A/D dropped to -0.62%. The Put/Call ratio sits at 0.94, where it has been for the past month. The Dow closed the week down -0.12%. The S&P was down -0.16%. The Nasdaq ended the week down -0.39%, the FANG closed lower, down -0.93% with the Russell down -0.25%. Bonds set a new weekly closing low for the decline and the weekly remains deeply oversold. The bonds did react with a swing high in Thursday’s timing. Commodities continued to rally as crude oil cleared $90 and the metals staged a late rebound while the US Dollar has moved to a one year high. The CRB closed up +1.91%. The Commitment of Traders CoT remains locked in a clueless pattern. Inventories for all the major players have remained the same for almost two months straight.
Timing Points
- 09/22 **
- 09-28 *** X extreme/fast moves
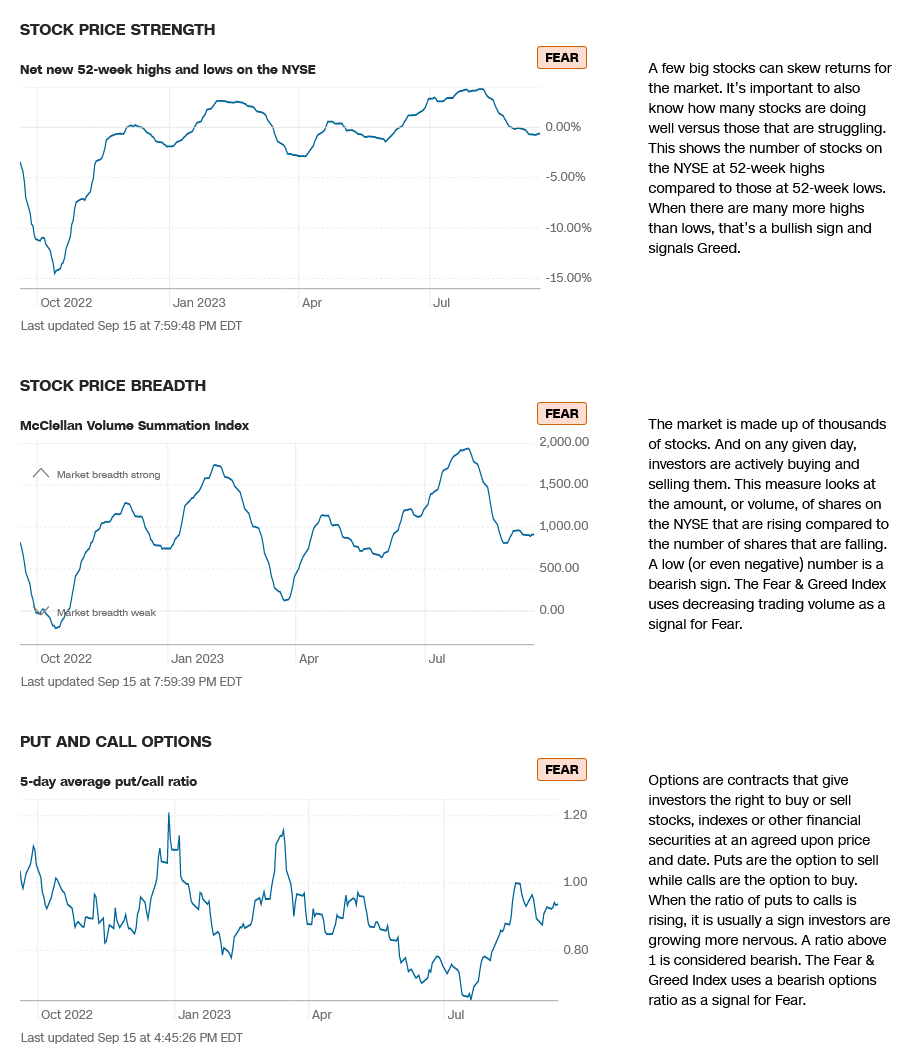
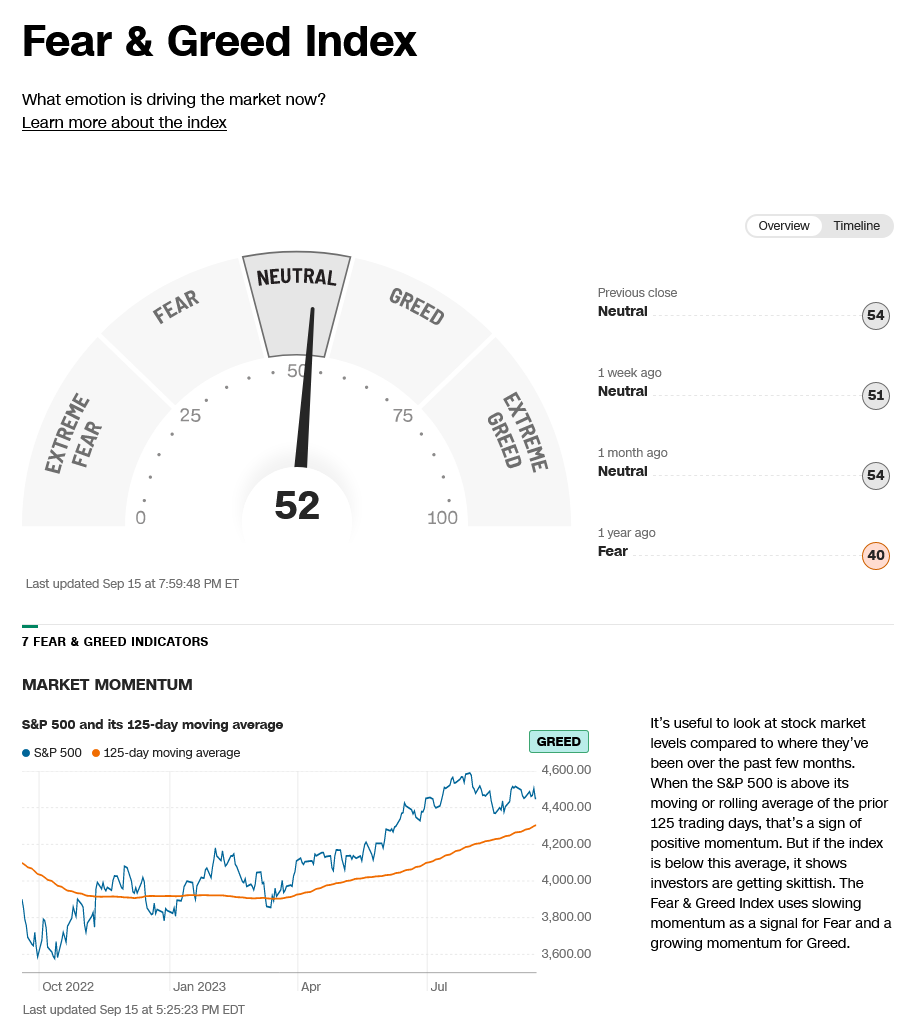
CNN Fear & Greed Index
AAII Investor Sentiment Survey
Dow Jones Industrial Average Hourly HLC
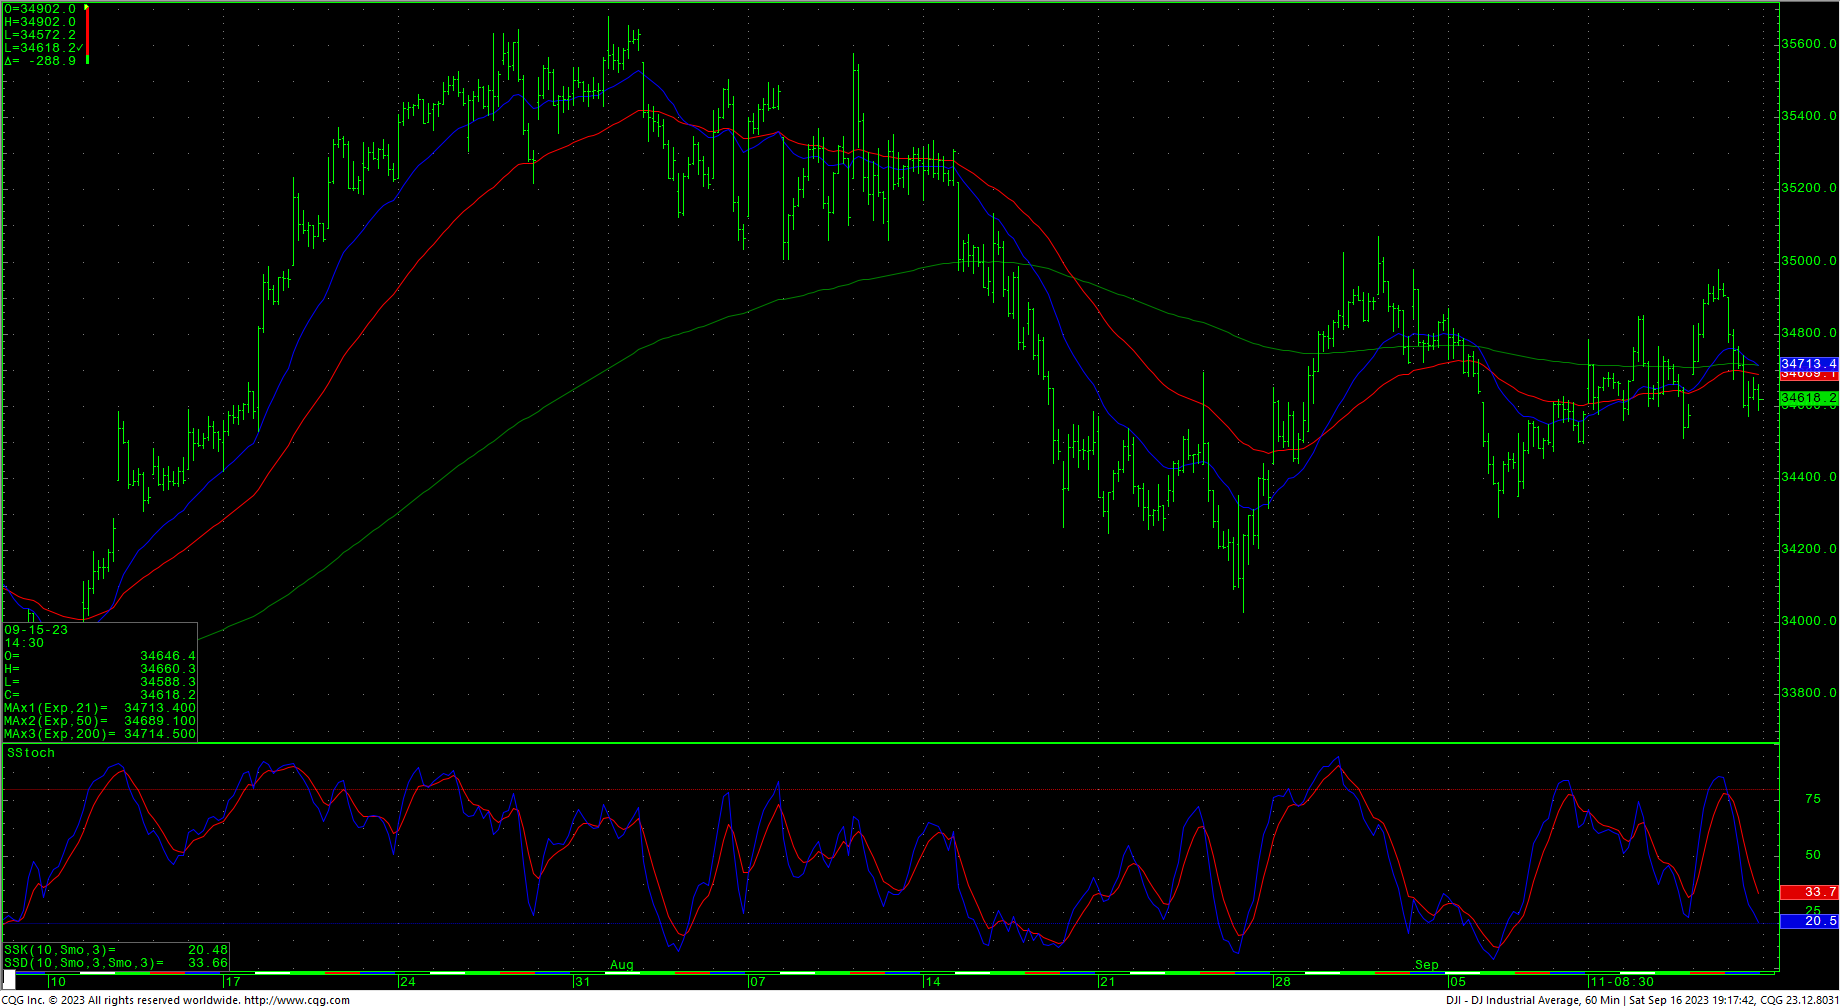 The Dow hourly is slightly oversold. It is important to note that last week’s trade doesn’t change the technical picture much at all. Support is 34549 and 34426/34420. A further breakdown under 34420 should retest 34289/34274 and opens counts to retest 34022 with potential to short-term critical support at 33767/33760. Daily closes under 33760 open counts to major short-term support in the 33359 through 33316 area. Closes under 33316 can test 32998 with counts to critical intermediate-term support of 32586/32580. Closes below 32580 suggest a move to 32170 with potential to 31341/31330.
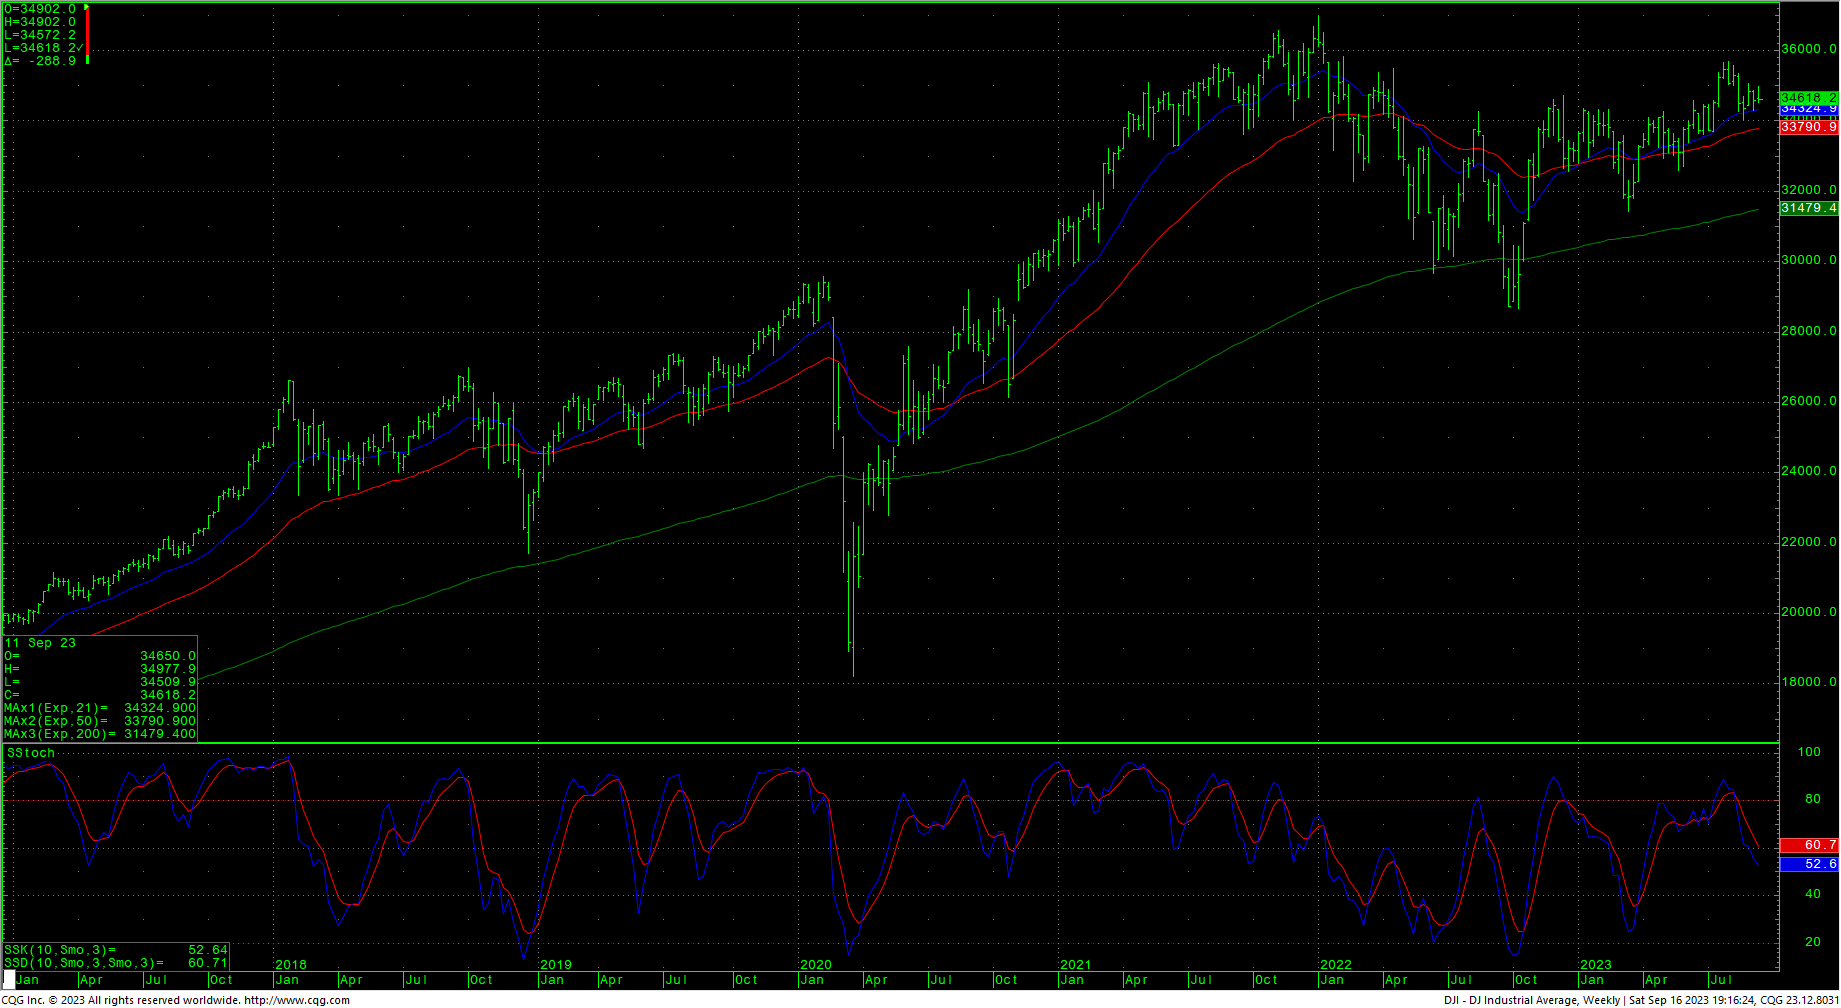
Resistance remains at 34659, 34854 and short-term pivotal at 35048/35055. Rallies with closes over 35055 suggest a test of last-gasp resistance at 35266/35289. Closes above 35289 setup a test of the trading highs at 35679 with intermediate counts to 35824 and longer-term counts into a gap area on the daily at 35996 to 36044. A breakout over 36044 sets up the 36513 area with potential to test the all-time record highs at 36952. A reminder that the larger inverted H&S pattern on the DJIA weekly counts toward long-term targets at 37095.
Dow Jones Industrial Average Weekly HLC
Support
- 34549 ***
- 34426/34420 ***↓
- 34132 **
- 34020/34022 *** ↓
- 33865 **
- 33767/33760 *** ↓
- 33610 *** ↓
- 33537 **
- 33400/33399 *** ↓
- 33359 ** ↓
- 33316 ** ↓
- 33187 ** ↓
- 33091 *** ↓
- 32998 *** ↓
Resistance
- 34659 **
- 34854 *** ↑
- 34977 ** ↑
- 35048/35055 *** ↑
- 35266/35289 *** ↑
- 35354 ** ↑
- 35432 **
- 35578 ** ↑
- 35670 *** ↑
- 35800/35824 *** ↑
- 35996 ***
- 36044 *** ↑
- 36271 **
- 36390 **
- 36513 ***↑
- 36636 **
- 36934/36952 *** ↑
- 37095/37096 *** ↑
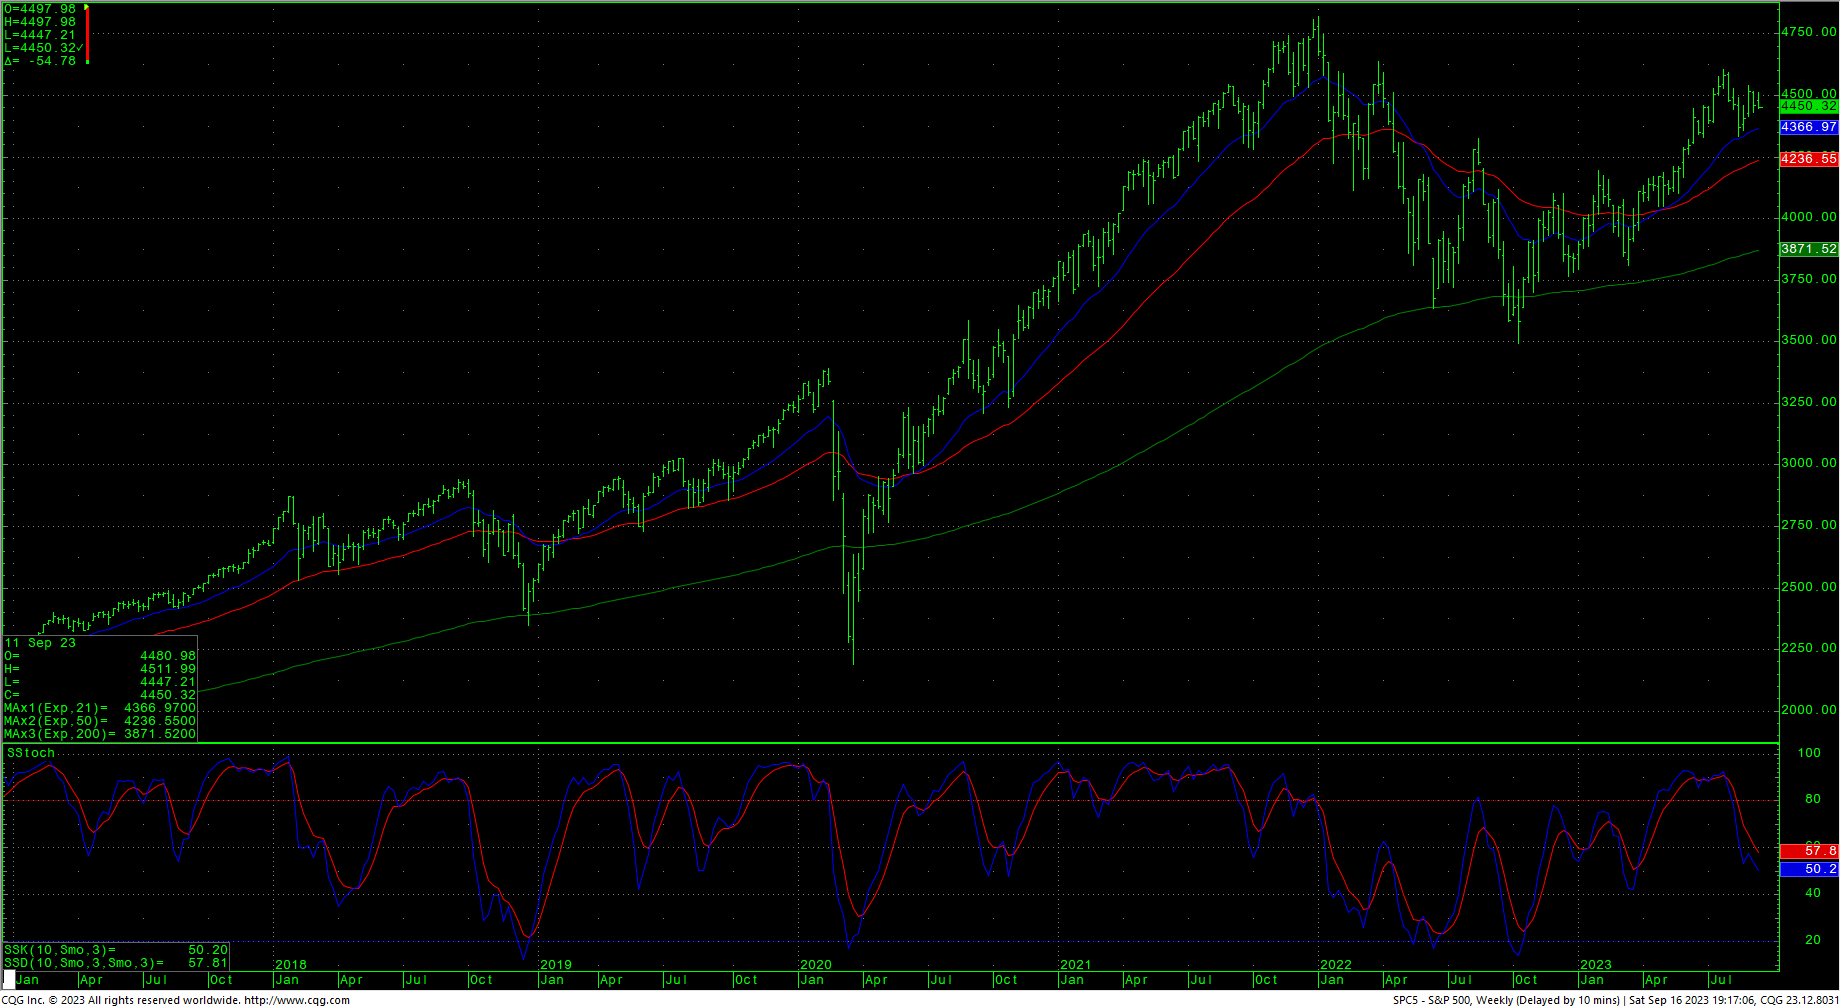
S&P 500 Cash Index
The S&P hourly also has slightly short-term oversold conditions and remains neutral. Prices closed back under pivotal resistance at 4503/4510. Resistance is 4474 and 4503/4510. Rallies with closes over 4510 setup a minimal test of 4550 and 4575. Closes over 4575 are bullish for a test of the swing high at 4607. Closes over 4607 suggest a minimal test of 4637. A breakout with closes above 4637 opens potential toward 4748 and ultimately 4818. Above the record highs opens counts to 4952/5000 with potential to 5144.
Support is 4434/4430 and near-term pivotal at 4413/4410. Closes under 4410 should test 4328. A breakdown with closes under 4328 set up a move to 4180/4177. Closes under 4177 open counts to 4049 and critical short-term support of 3917/3910. Daily closes below 3910 open counts to 3754/3750 with potential to support at 3503/3491.
S&P 500 Index Weekly HLC
Support
- 4434/4430 *** ↓
- 4413/4410 ***↓
- 4380 **
- 4356 **
- 4335/4328 *** ↓
- 4304 **
- 4280 **
- 4261 *** ↓
- 4180/4177 *** ↓
- 4049 *** ↓
- 3917/3910 *** ↓
- 3875 **
- 3754/3750 *** ↓
- 3625 **
- 3500/3491 *** ↓
Resistance
- 4474/4475 ** ↑
- 4503/4511 *** ↑
- 4527 **
- 4541 **
- 4550 *** ↑
- 4575 *** ↑
- 4593 **
- 4607 *** ↑
- 4637 *** ↑
- 4665 **
- 4748 *** ↑
- 4818 *** ↑
- 4952 ***↑
- 5000 *** ↑
- 5072 **
- 5144 *** ↑