
TECHNICAL ANALYSIS
*Note: There will be no technical update next weekend. The next report will be October 7th.
Major Indices Week of September 22, 2023
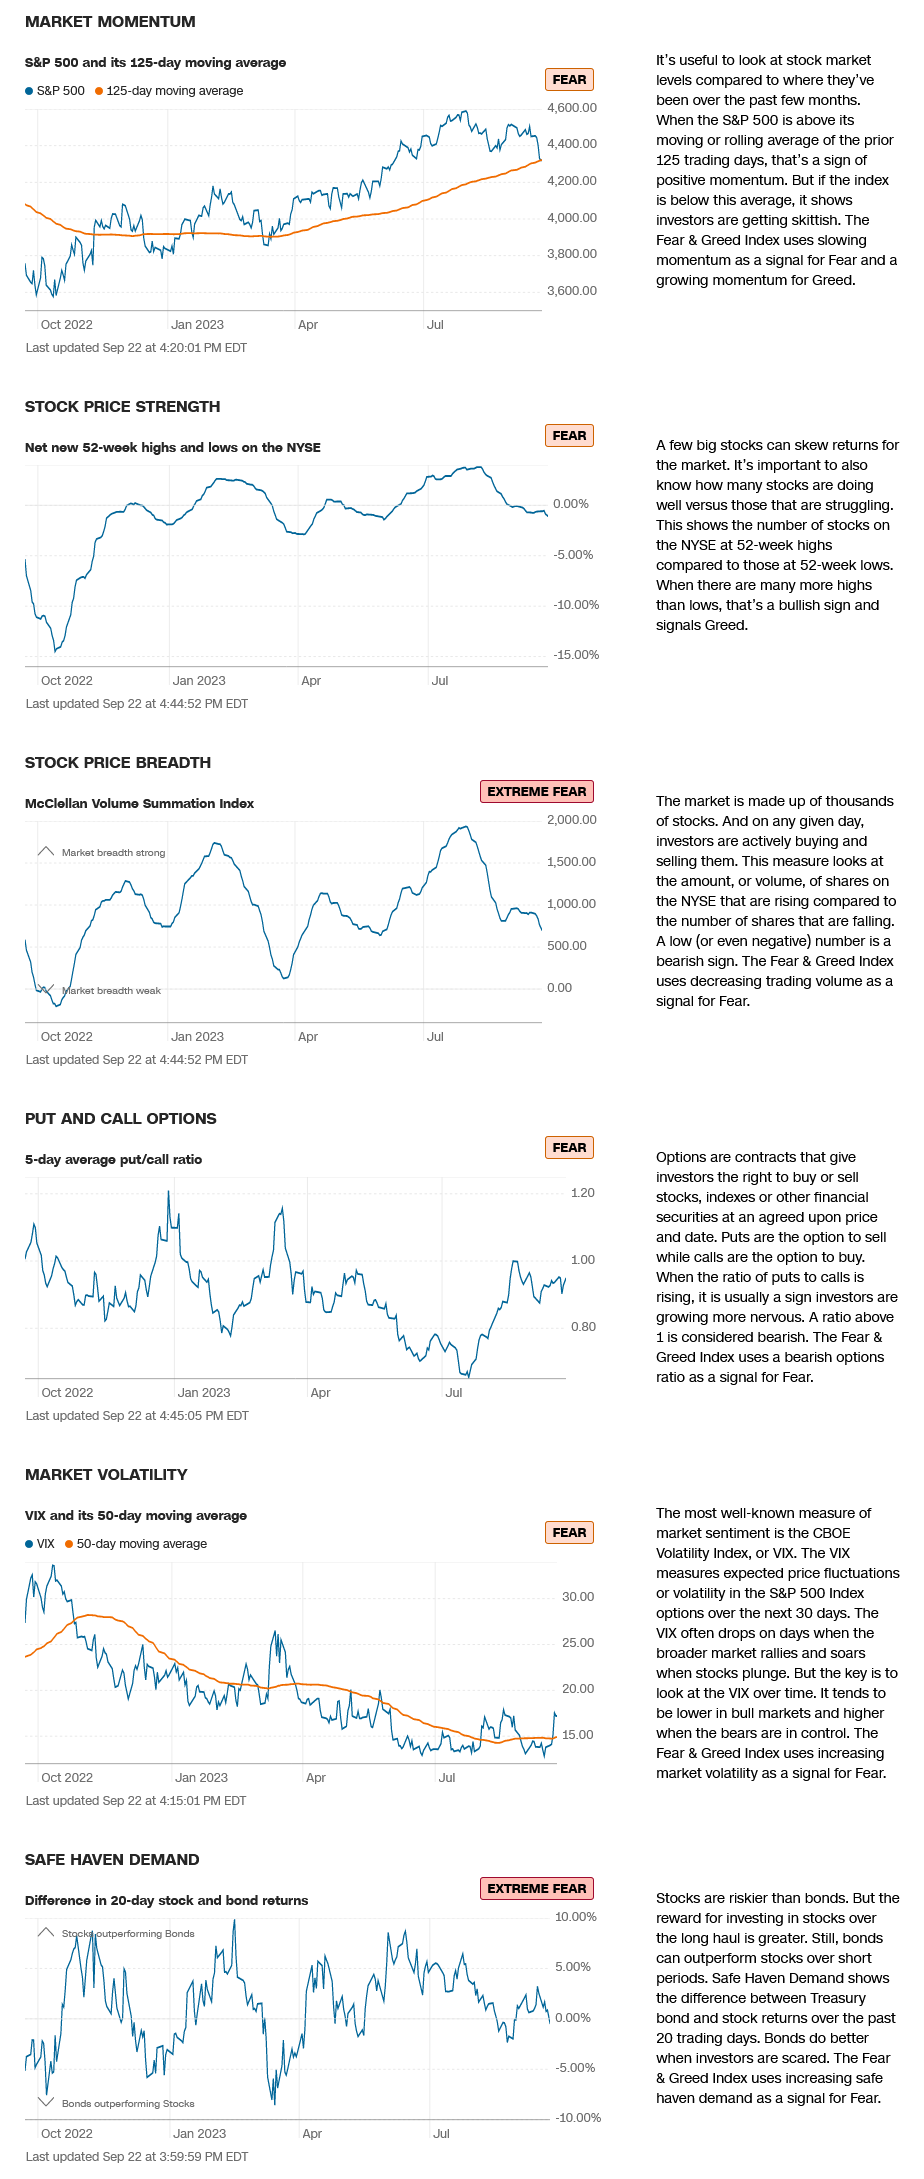
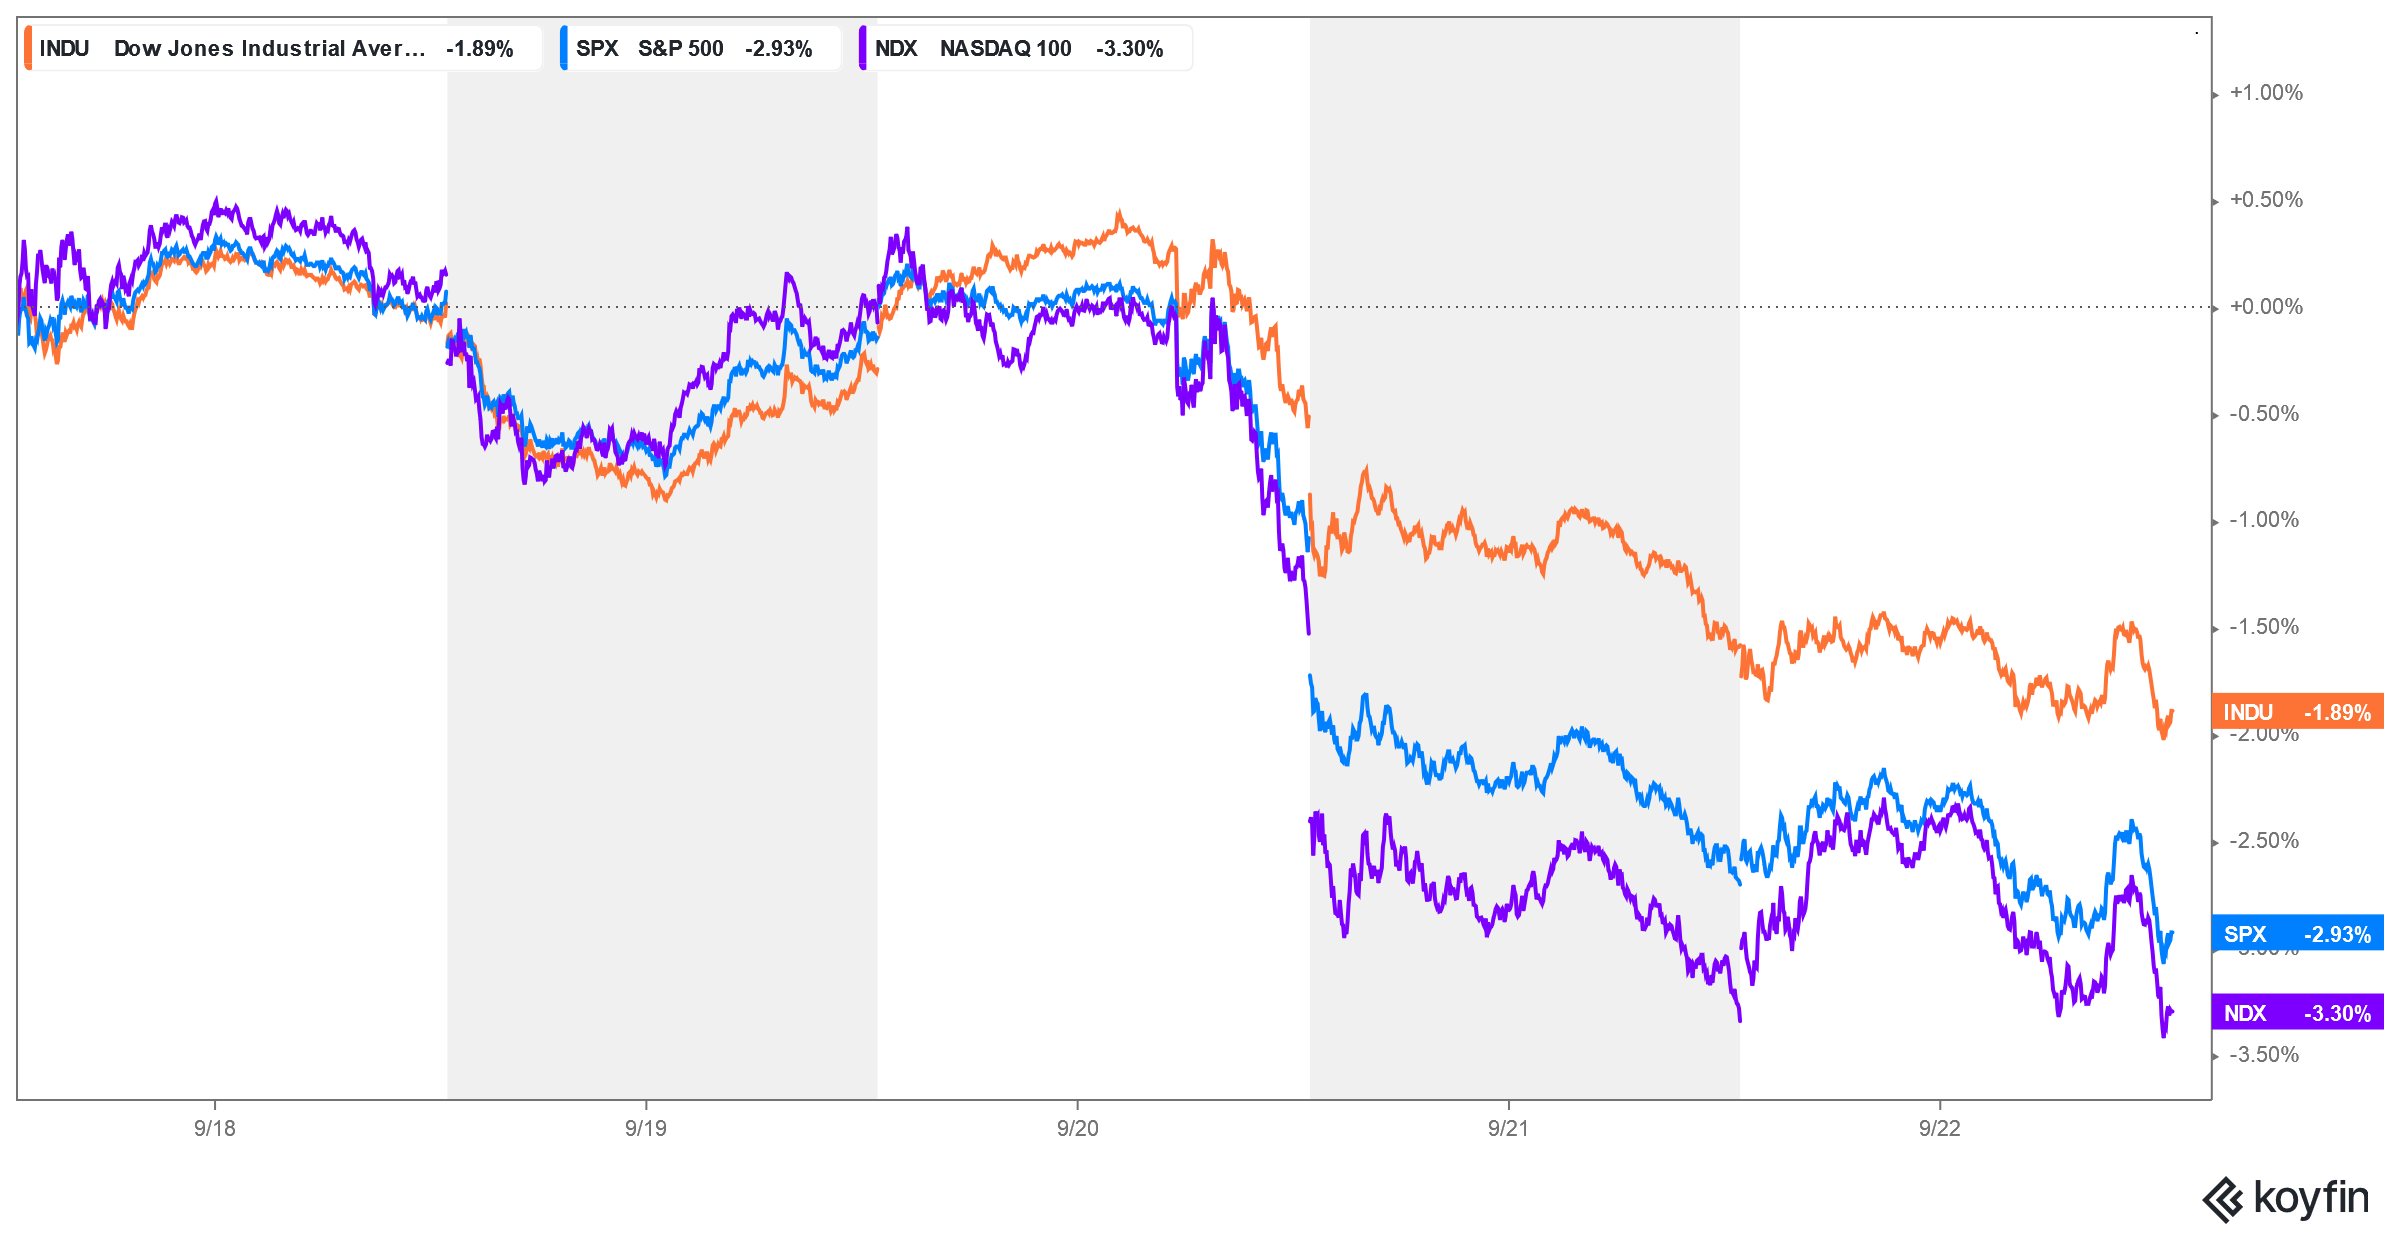 Stocks suffered sharp declines last week with the loss leaders being tech and secondary markets and the blue chips performing only slightly better. All major indices closed at the bottom of the weekly ranges as those charts are still working off their overbought conditions. The Dow closed at the lowest level since 10 July 2023. The weekly close is the lowest since 3 July 2023. For the S&P, the weekly close is the lowest since 23 July 2023 and the lowest daily close since 9 June 2023 as that market has now wiped out the entire last quarter’s move. The new three-month lows in the S&P most likely triggered technical selling at these levels…with the massive, rounded top and the trendline breakdown on that chart. Friday marked strong timing so it is important to see how prices move away from the timing early next week. The next timing date is critical this coming Thursday and we could see some large net changes, volatility and/or some large moves/swings. Sentiment has shifted sharply to bearish and FEAR is dominating all the key indicators as of Friday. The AAII Sentiment Index moved to a 16-week low in optimism, matching the price declines. The VIX moved sharply higher last week, testing the highs of the past three months…closing in the top of the weekly range. The 52-week, A/D is now down to -1.08%. The Put/Call ratio sits at 0.95, a fear reading. The Dow closed the week down -1.89%. The S&P was down -2.93%. The Nasdaq ended the week down -3.63%, the FANG closed sharply lower, down -4.85% with the Russell down -3.82%. Bonds also collapsed last week and the weekly close for the 30YR is the lowest since 1 October 2008, a 15-year low for the long bond…although they did stage a bullish reversal Friday. The CRB closed down -1.67% mostly on a selloff in the metals and grains. The Commitment of Traders CoT continues to offer very few clues as the commercials are flat and the speculators remain flat. Asset managers have continue to add to positions, which may be a warning sign?
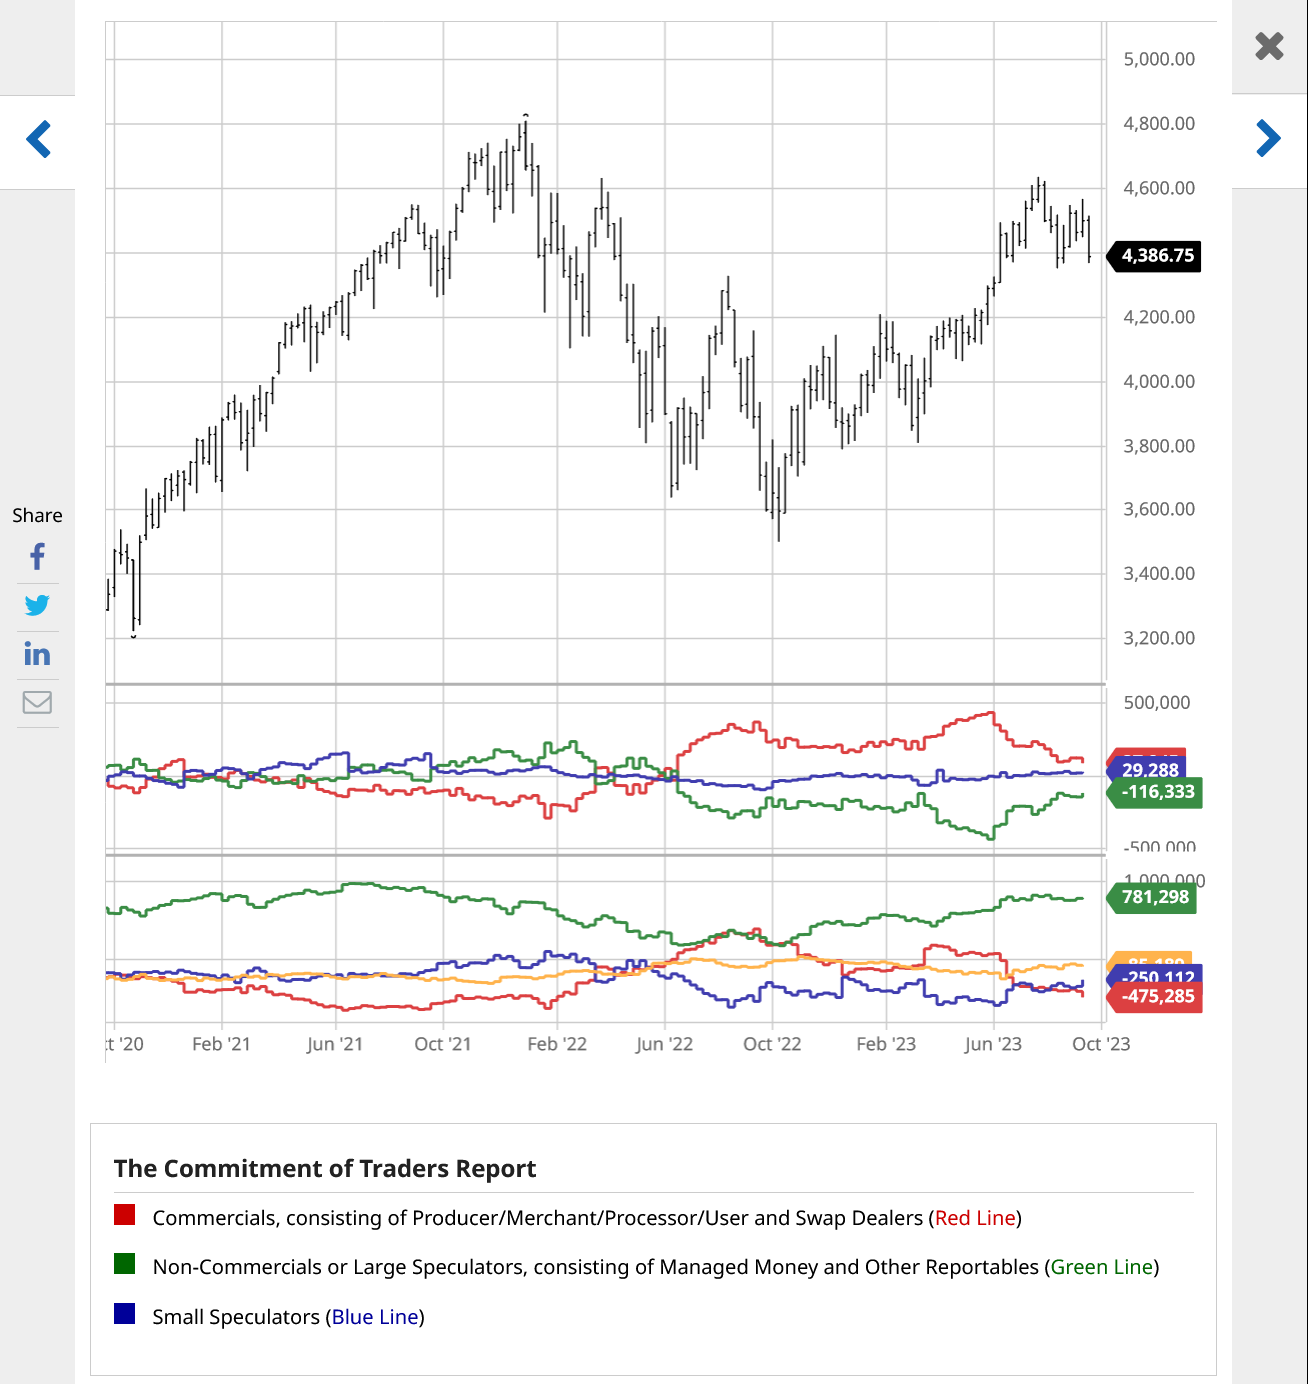
Commitment of Traders CoT (spot S&P futures)
Timing Points
- 09-28 *** X extreme/fast moves
- 10/04 **
- 10/13 *** X
- 10/19 **
- 10/22 **
- 11/02-03 *** X
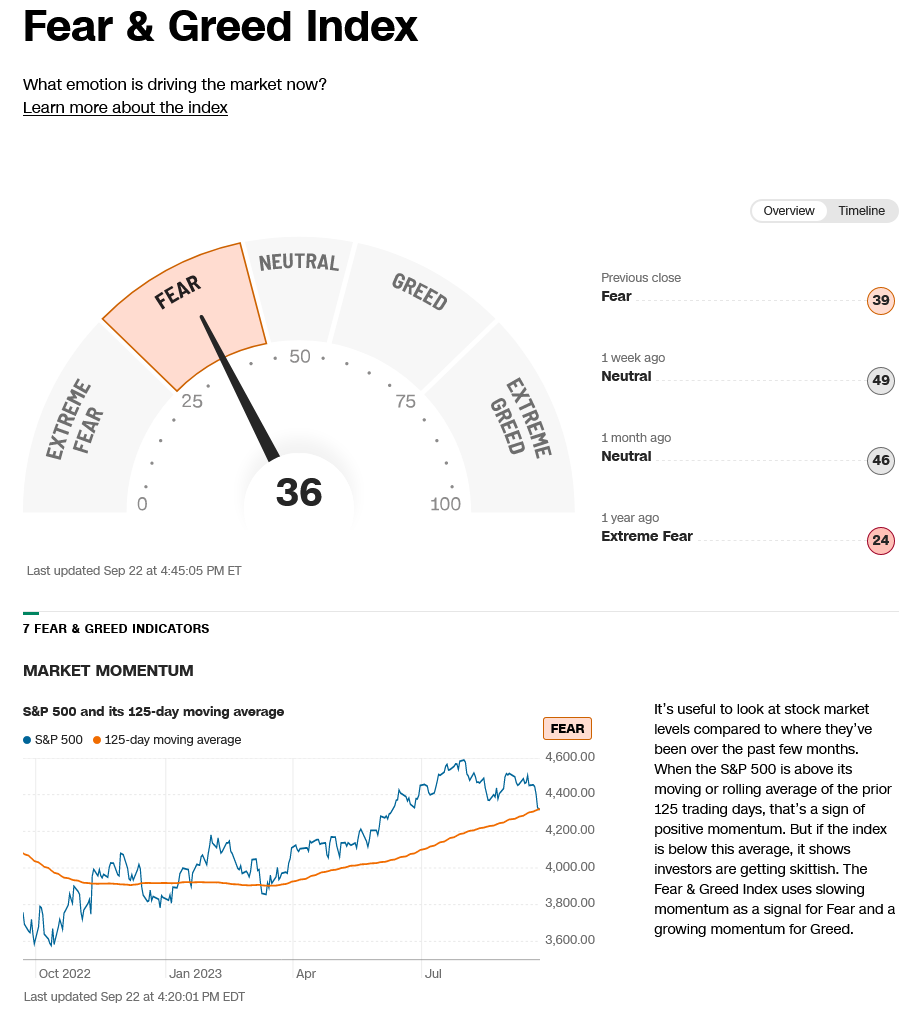
CNN Fear & Greed Index
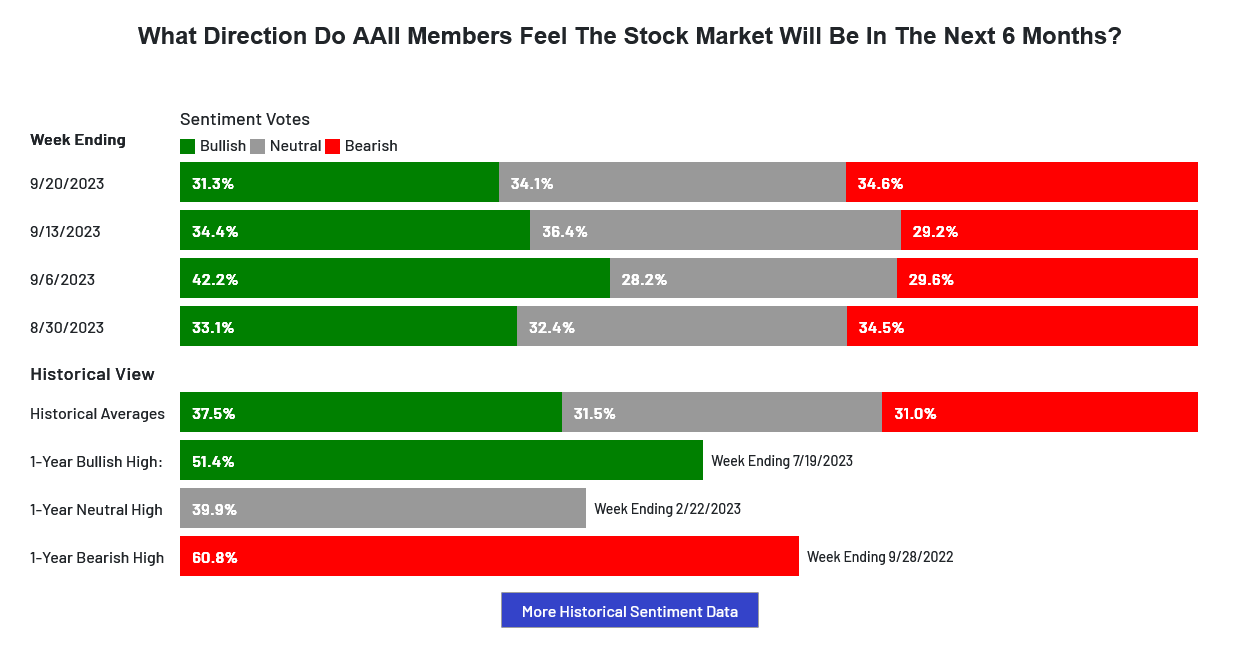
AAII Investor Sentiment Survey
 Dow Jones Industrial Average Hourly HLC
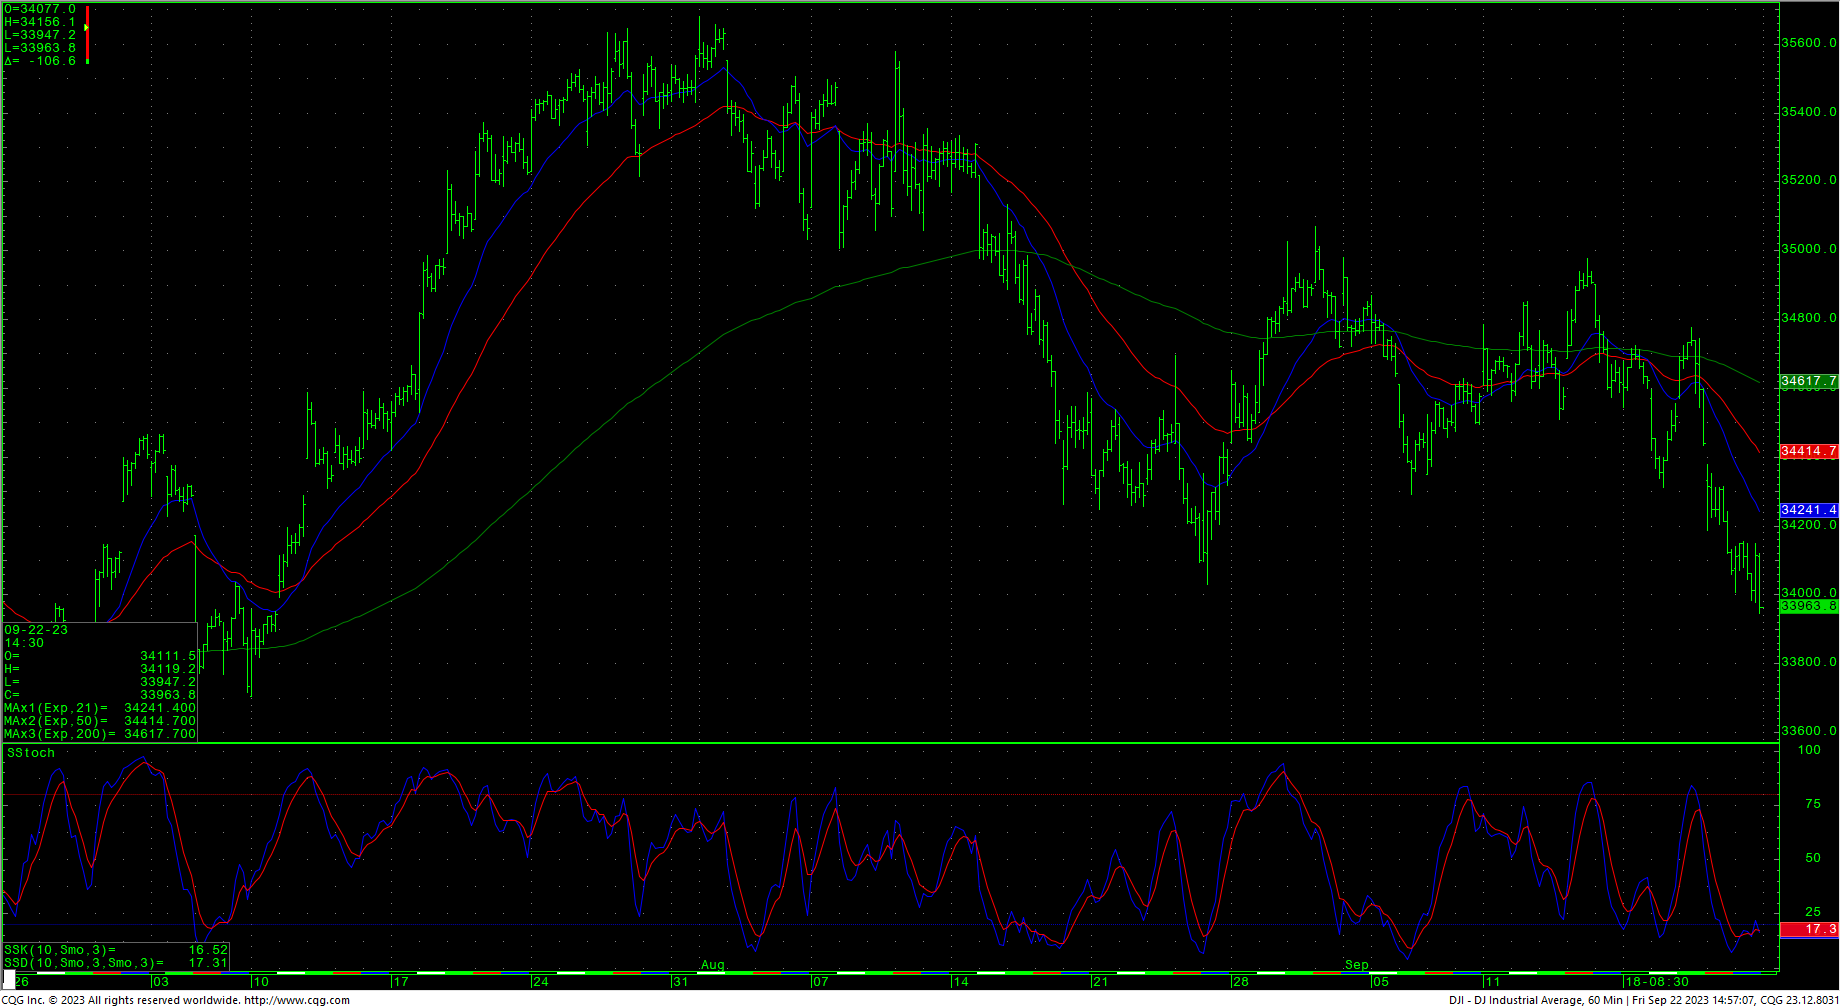 The Dow hourly is deeply oversold and flashing a preliminary bullish divergence on the close Friday. The close is bearish looking with the August lows being penetrated. Prices did fill in a long-standing gap on the daily chart back to 11 July 2023. The close under 34022 is bearish and the Dow is now close to testing the 200-day moving average around the 33900 area. A continued breakdown should carry prices to key support at 33554 with potential to test critical intermediate-term support at 33053/33045 through 32998. A breakdown with daily closes below 32998 can test 32731 with support at 32586 through 32492. Support is key long-term at 32170 and a close under that area is bearish with counts into the 31341/31330 level.
Resistance is 34212 and 34355/34376. Closes back over 34376 are near-term friendly and open counts to 34508 with potential to 34641/34650. A breakout above 34650 should minimally test 34814 with counts to pivotal near-term resistance at 35017/35025. Closes over 35025 suggest a test of last-gasp resistance at 35246/35270. Closes above 35270 setup a test of the trading highs at 35679 with intermediate counts to 35824 and longer-term counts into a gap area on the daily at 35996 to 36044. A breakout over 36044 sets up the 36513 area with potential to test the all-time record highs at 36952.
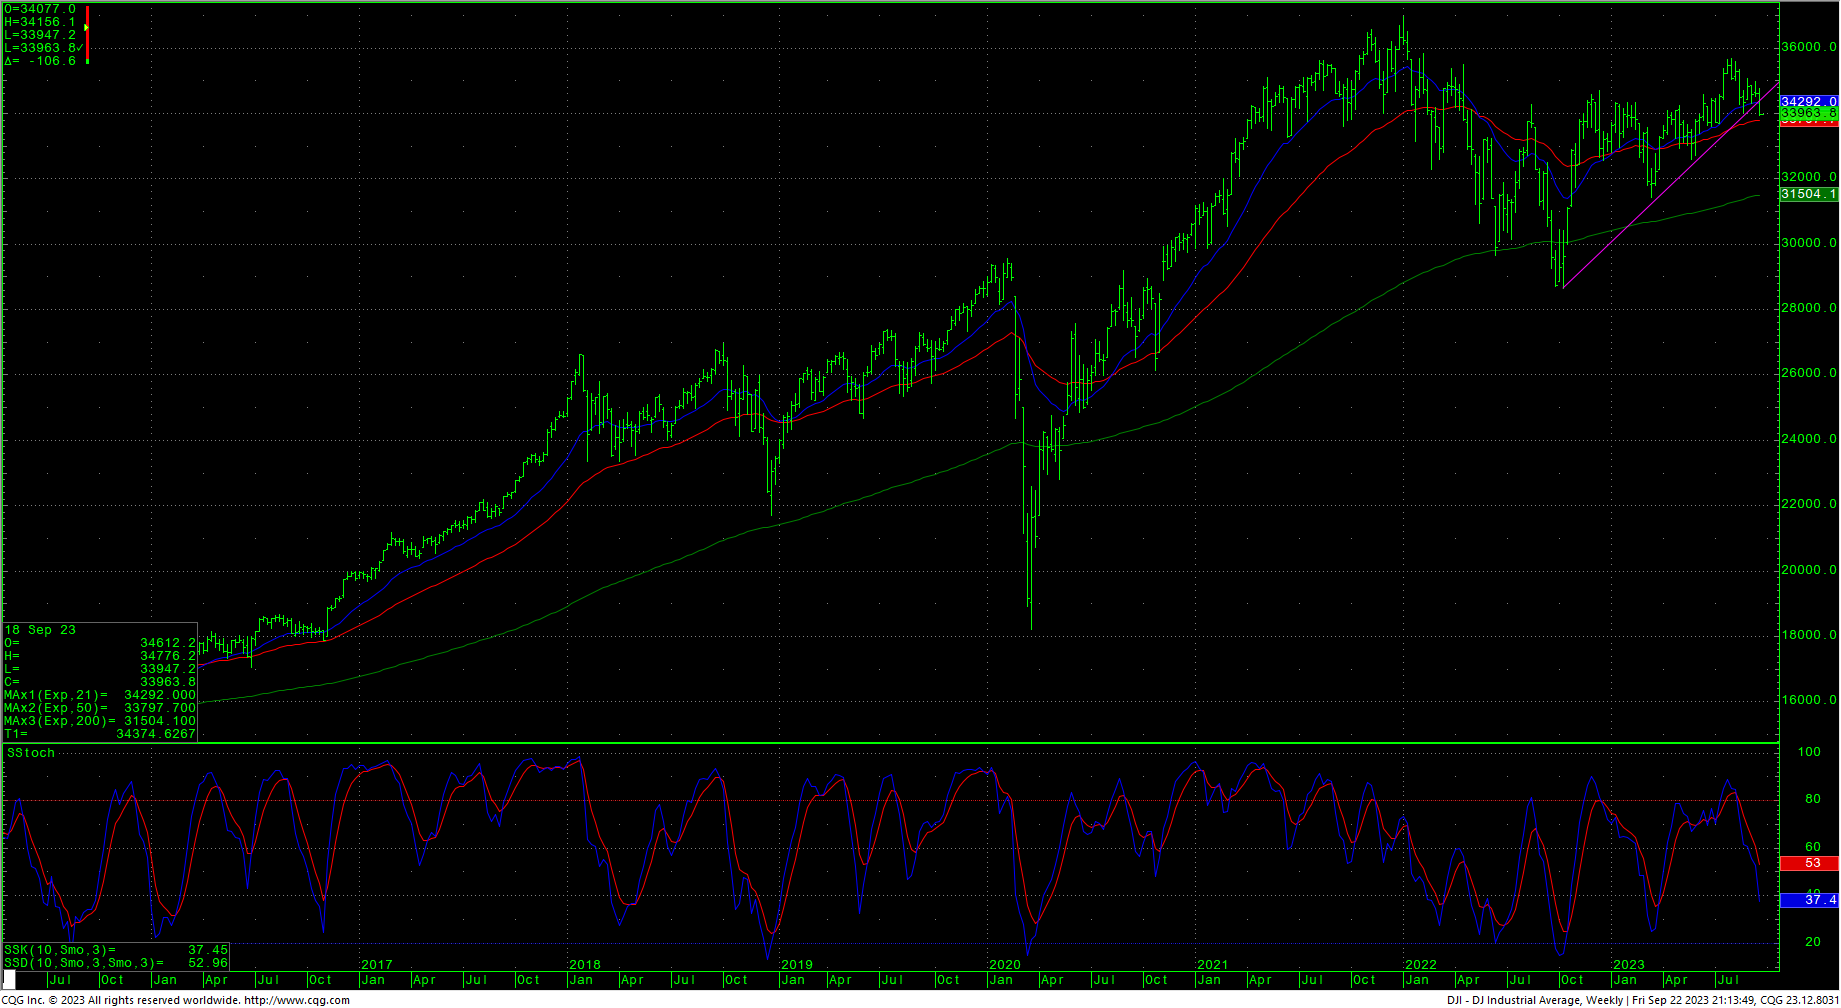
Dow Jones Industrial Average Weekly HLC
Support
- 33901 ***
- 33755 **
- 33610 *** ↓
- 33554 *** ↓
- 33400/33399 **
- 33359 ** ↓
- 33316 ** ↓
- 33187 ** ↓
- 33053/33045 *** ↓
- 32998 *** ↓
- 32731 ***
- 32586 *** ↓
- 32492 *** ↓
- 32170 *** ↓
Resistance
- 34156 **
- 34212 **
- 34355/34376 *** ↑
- 34418 **
- 34508 *** ↑
- 34641/34650 *** ↑
- 34813 *** ↑
- 34977 ** ↑
- 35017/35025 *** ↑
- 35246/35270 *** ↑
- 35354 ** ↑
- 35432 **
- 35578 ** ↑
- 35670 *** ↑
- 35800/35824 *** ↑
- 35996 ***
- 36044 *** ↑
- 36271 **
- 36390 **
- 36513 ***↑
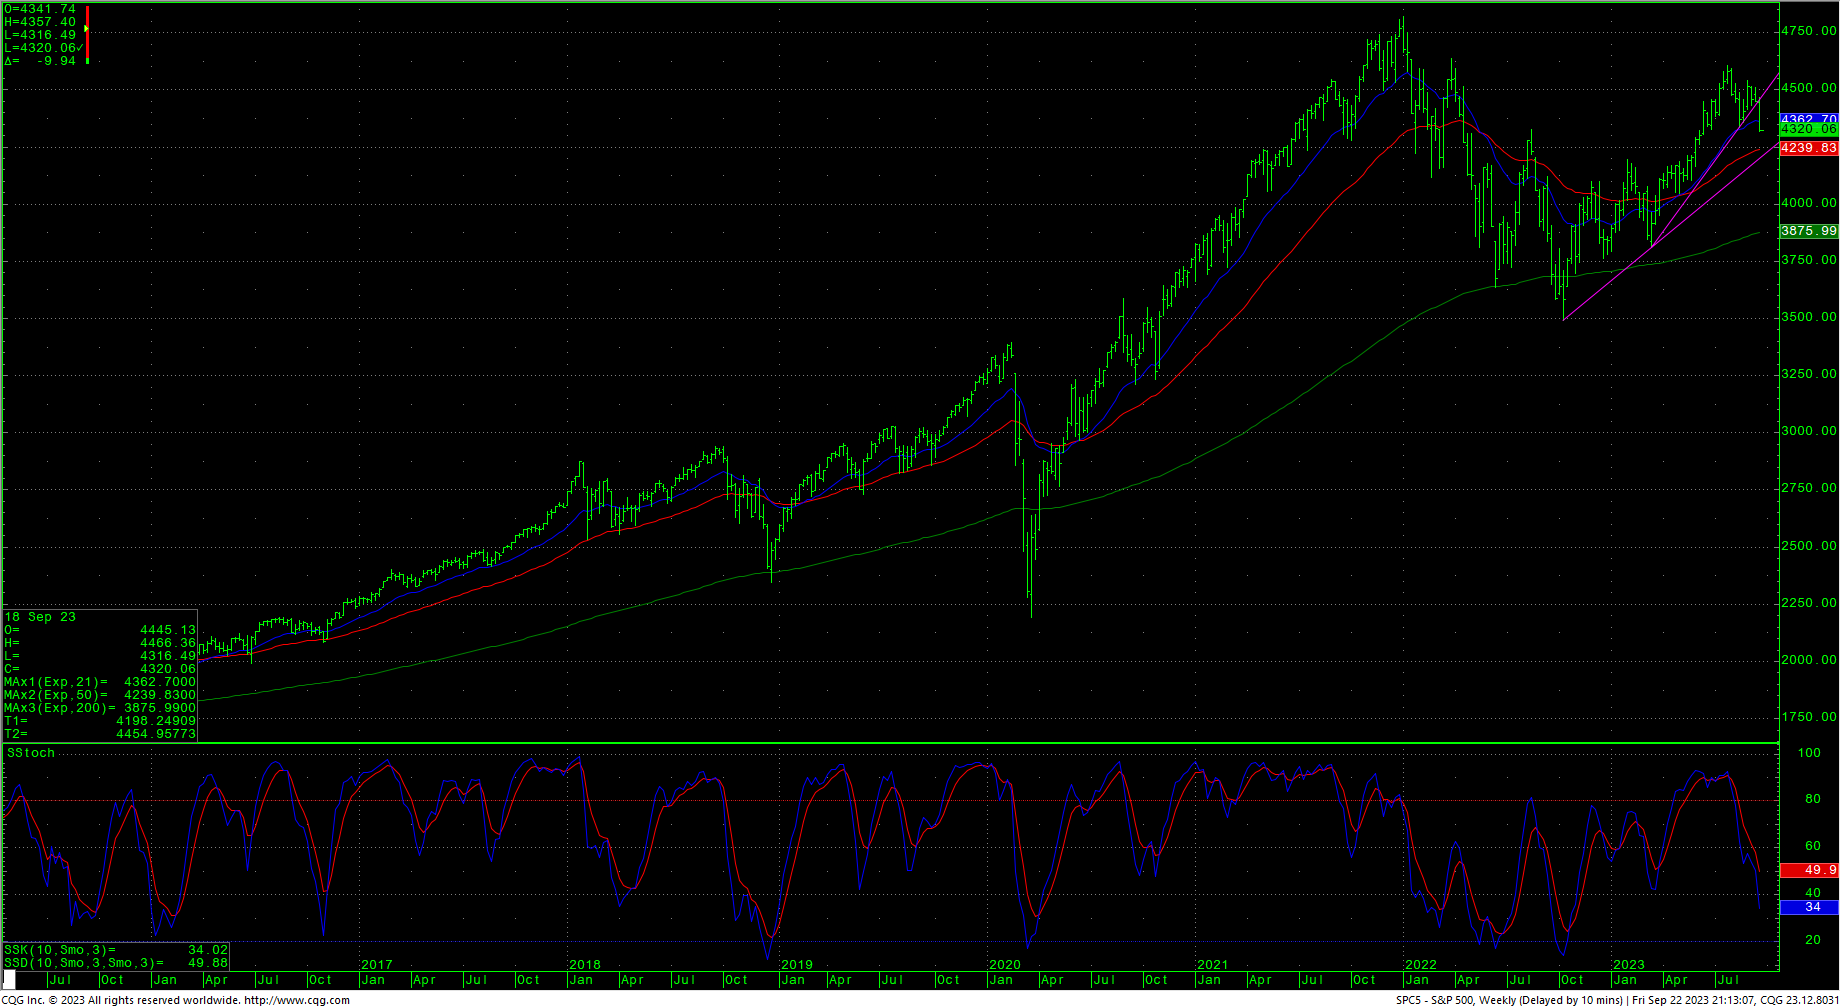
S&P 500 Cash Index
The S&P hourly is also oversold and flashing a preliminary bullish divergence with Friday’s late meltdown. Prices cleared a key area of short-term support at 4328. A further breakdown with closes under 4328 set up a move to 4262/4255. Closes under 4255 open counts to 4049 and critical short-term support of 3917/3910. Daily closes below 3910 open counts to 3754/3750 with potential to monthly support at 3503/3491.
Resistance is 4357 and 4385. A drive over 4385 should test 4412 with counts to 4428 and possible pivotal short-term resistance at 4455/4460. Daily closes over 4460 should minimally test pivotal hourly resistance at 4496/4500. A breakout over 4500 is friendly and sets up a move to 4607. Closes above suggest a minimal test of 4637. A breakout with closes above 4637 opens potential toward 4748 and ultimately 4818. Above the record highs opens counts to 4952/5000 with potential to 5144.
S&P 500 Index Weekly HLC
Support
- 4304 **
- 4280 **
- 4262/4355 *** ↓
- 4180/4177 *** ↓
- 4049 *** ↓
- 3917/3910 *** ↓
- 3875 **
- 3754/3750 *** ↓
- 3625 **
- 3500/3491 *** ↓
Resistance
- 4357 **
- 4385 ** ↑
- 4412 **
- 4428 *** ↑
- 4455/4460 ** ↑
- 4503/4511 *** ↑
- 4527 **
- 4541 **
- 4550 **
- 4575 *** ↑
- 4593 **
- 4607 *** ↑
- 4637 *** ↑
- 4665 **
- 4748 *** ↑
- 4818 *** ↑