
TECHNICAL ANALYSIS
Major Indices Week of October 6, 2023
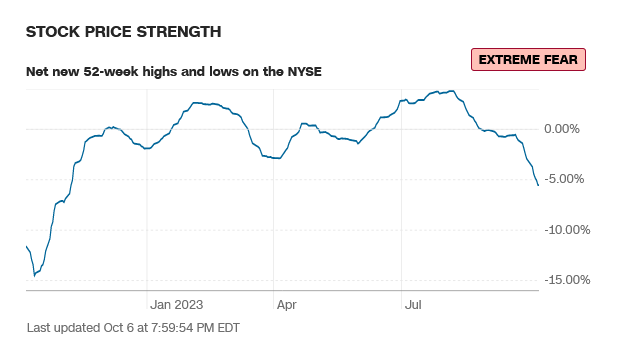
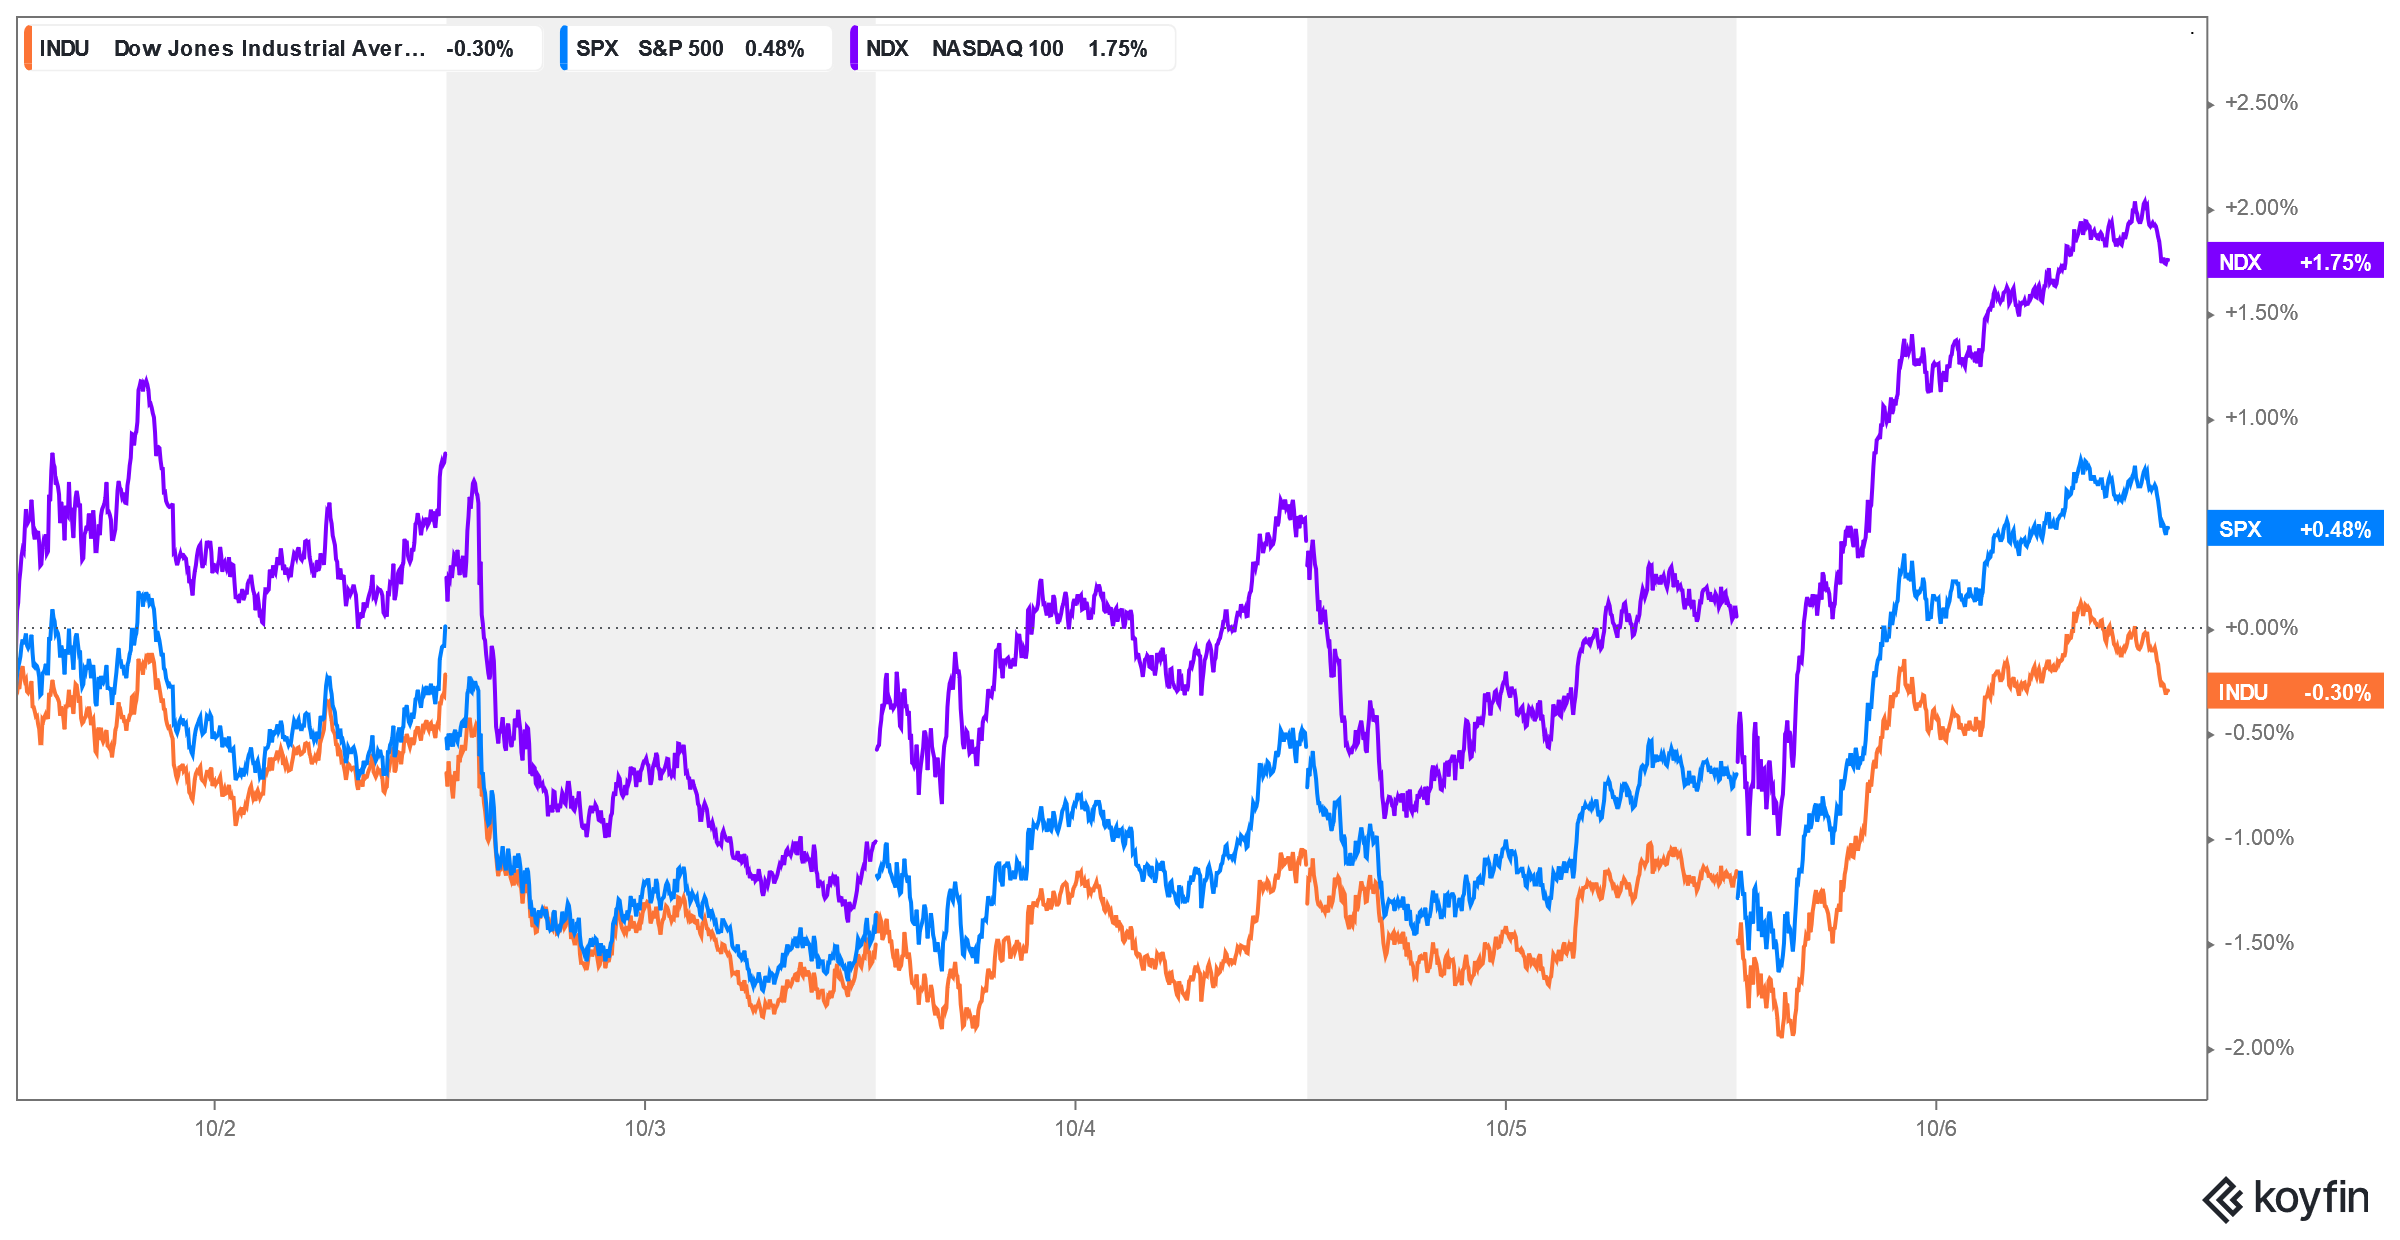 Stocks continued their sharp declines last week with the major indices hitting 4–5-month lows before Friday’s rally which left all but the Dow in weekly reversals. The daily charts are reacting to oversold conditions and the hourlies had setup bullish divergences from extreme oversold conditions. The minor timing in the middle of the week caught the closing lows for most markets when, at the time the lows were being set, all leading sentiment indicators were in extreme fear territory. The next timing point for stocks is this Friday and marks strong timing.
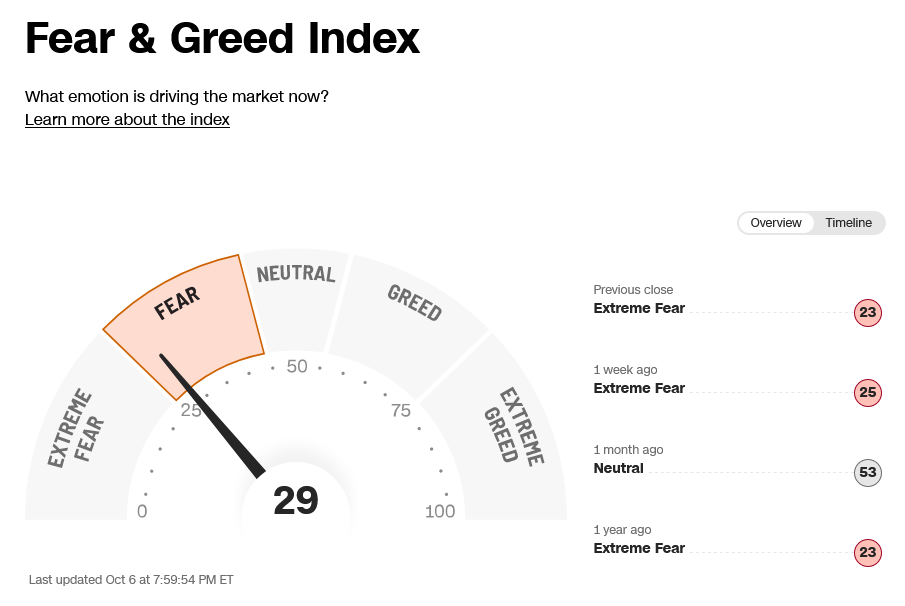
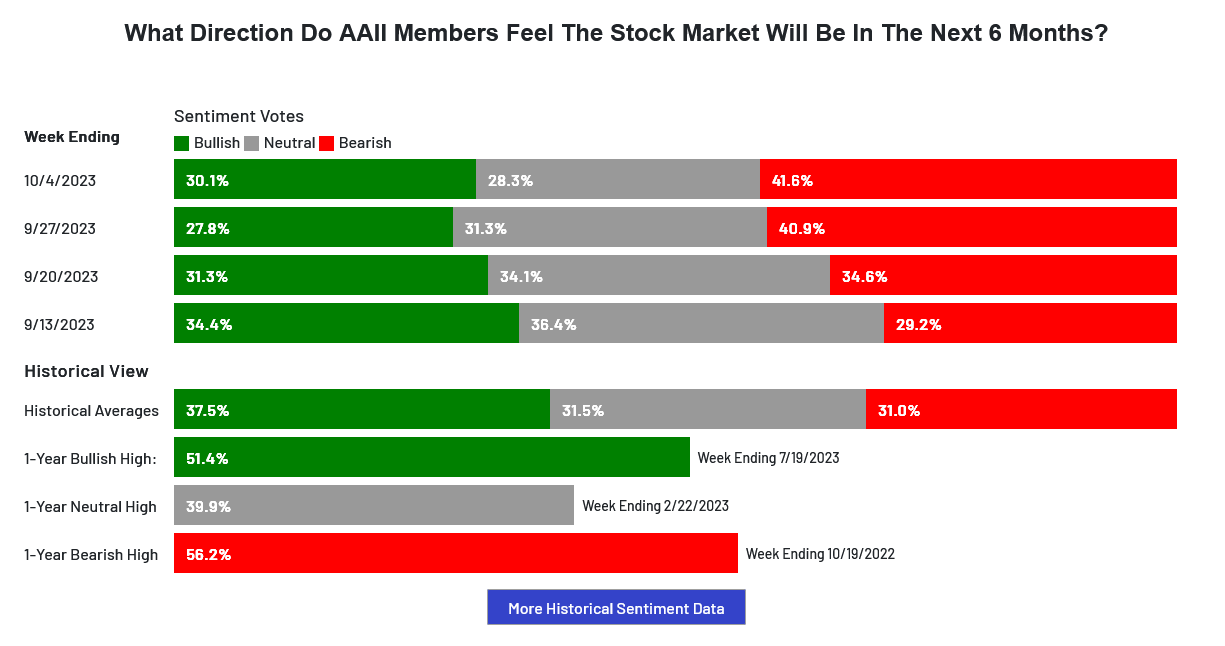
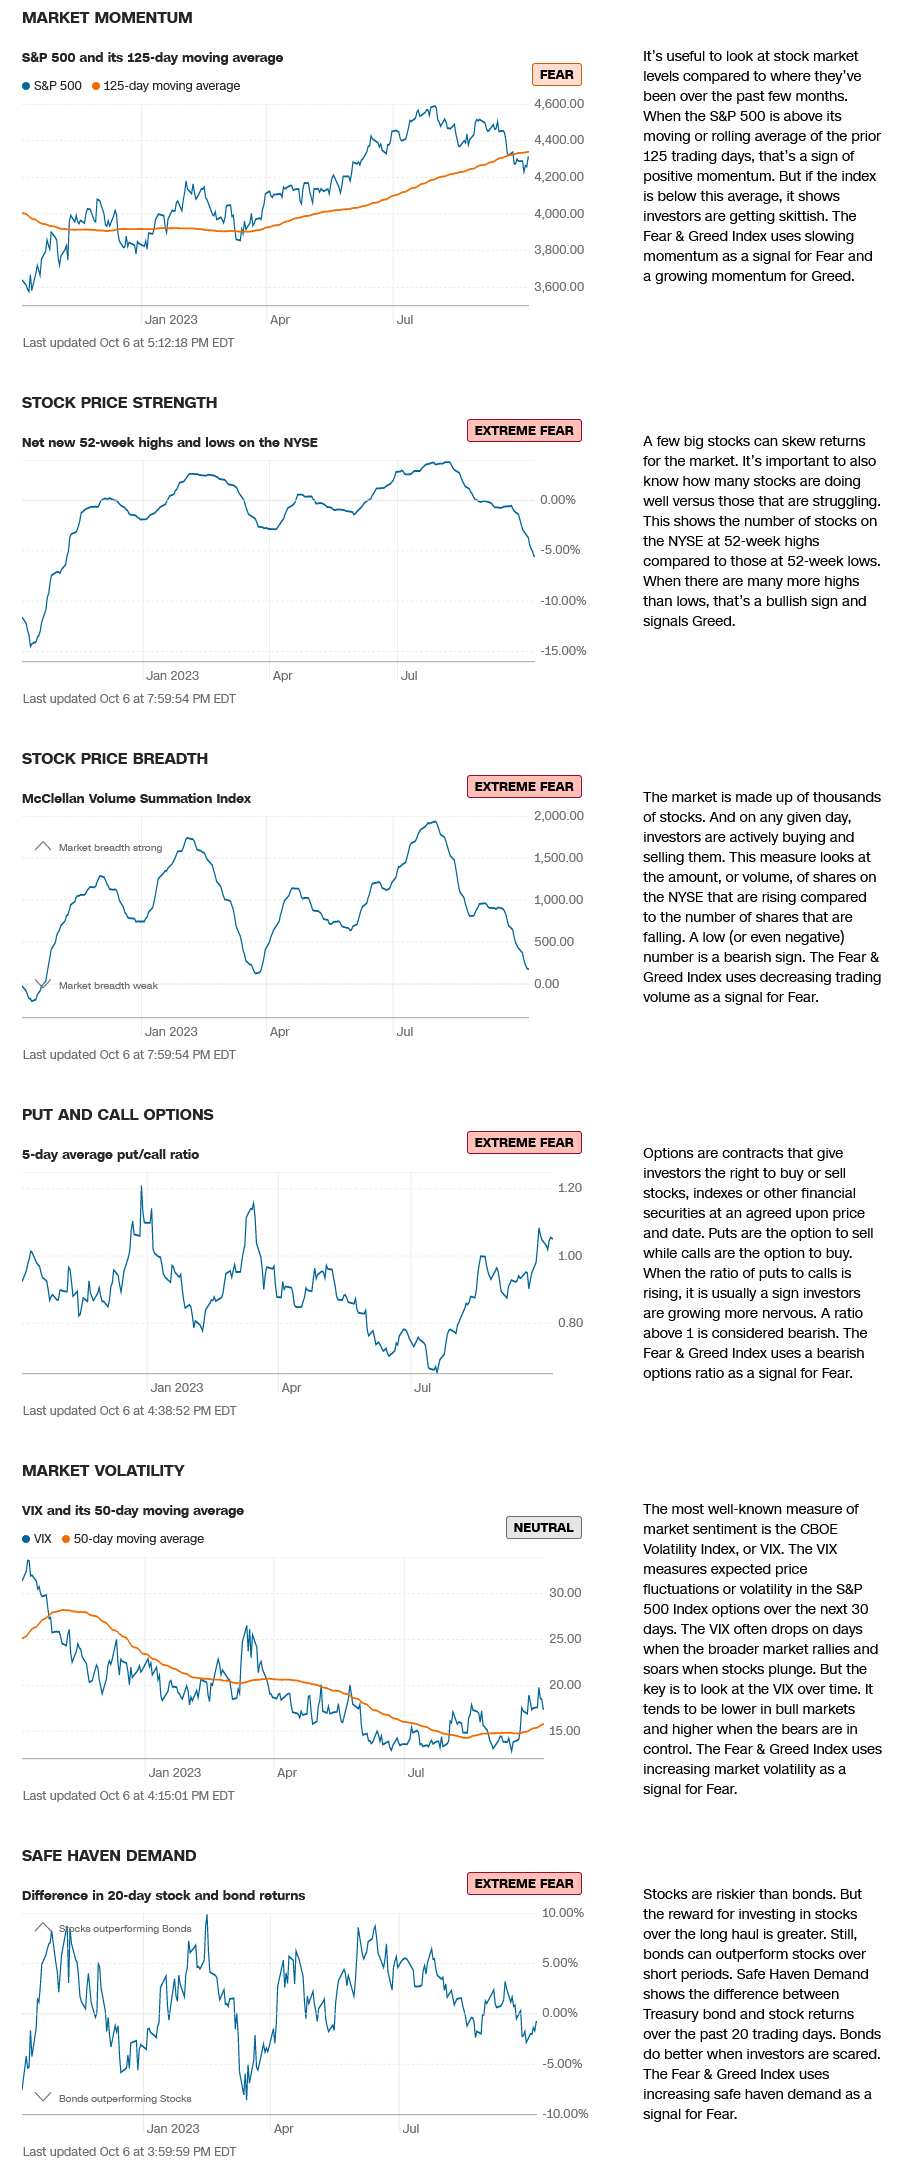
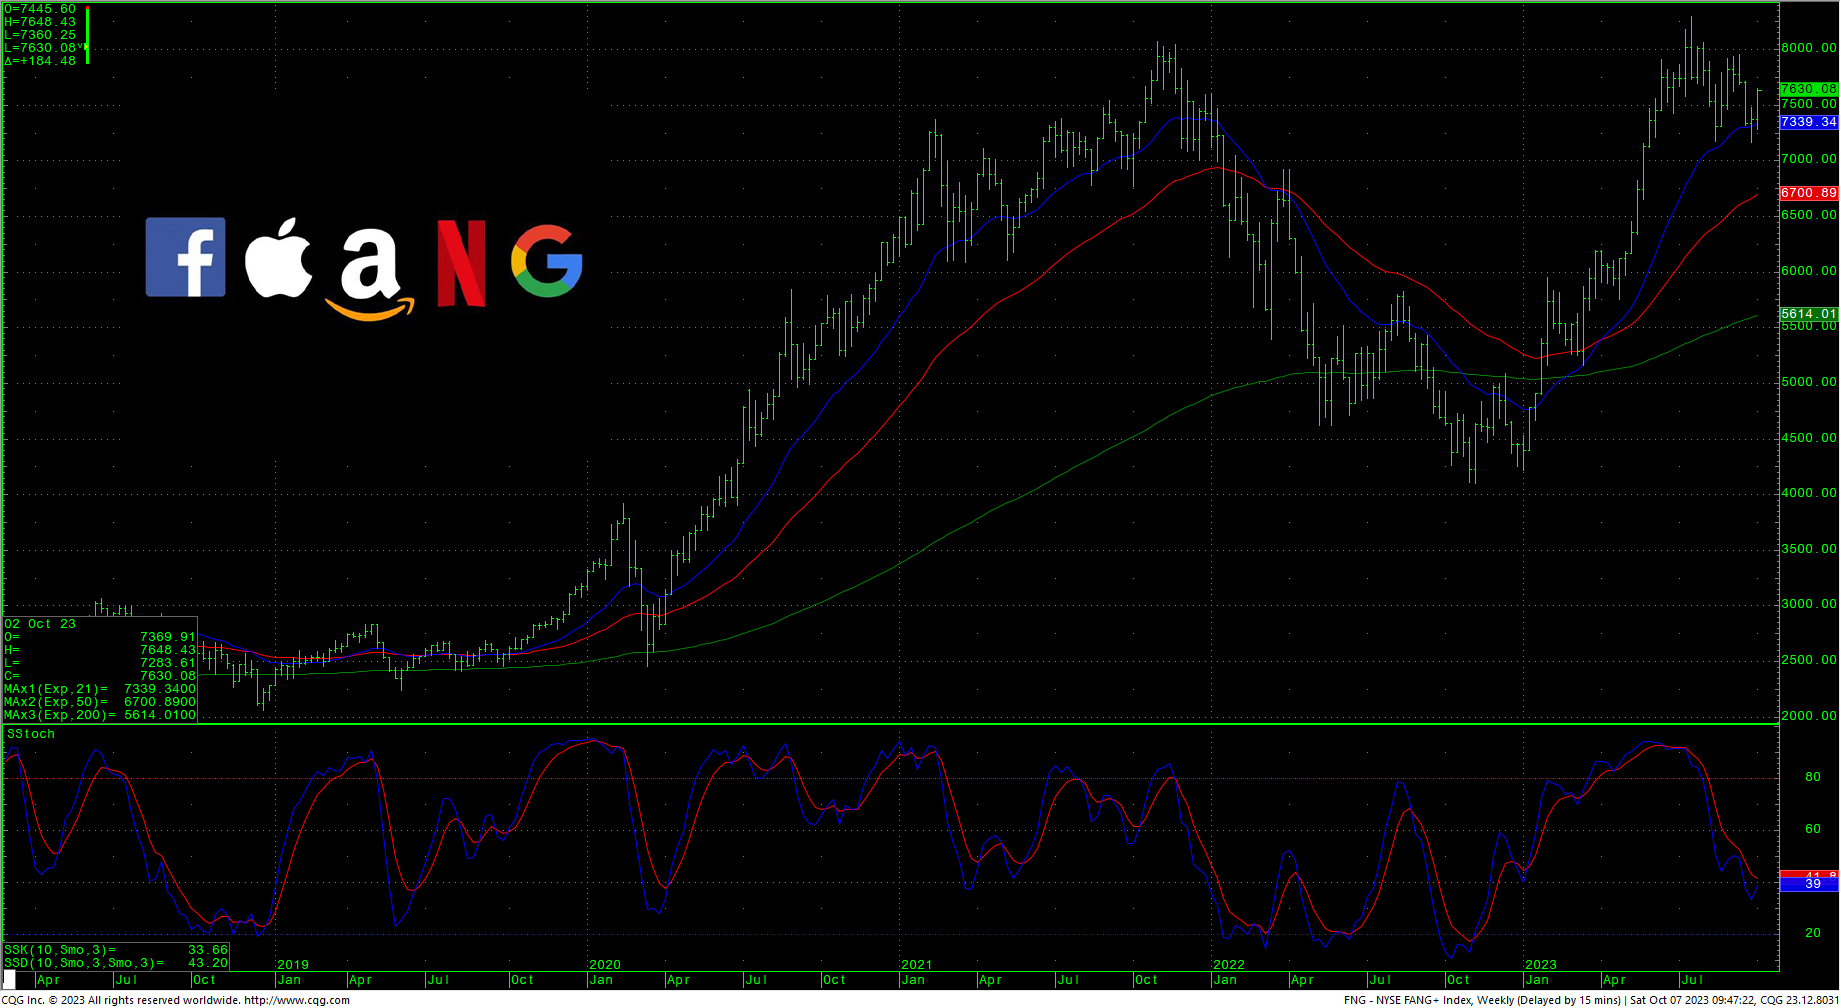
Sentiment remains in deep fear on last week’s closes. The AAII Sentiment Index hit a 5-month high for bearish sentiment last week. The VIX moved to the highest levels since mid-May before closing the week basically flat. The 52-week, A/D is now down to -5.53% which is a new low for 2023 and the lowest since November of 2022…indicating extreme fear. The Put/Call ratio sits at 1.05, another extreme fear reading. The Dow closed the week down -0.30%. The S&P was up +0.48%. The Nasdaq ended the week up +1.60%, the FANG closed sharply higher, up +3.53% with the Russell down -2.22%, as that market tested the 2023 lows. Bonds moved into the lowest levels since the summer of 2007. The nearby 30-year futures are now testing monthly support in the 109232/108014 area and the long term charts are grossly oversold. Another key note; junk bonds continue to outperform institutional bonds in a huge way in 2023…however, this is a multi-year trend for the spread. The CRB closed down -1.52% as metals and crude oil saw sharp declines. The Commitment of Traders CoT is one indicator that does not offer hope for the bulls. The overall trend there has been a continuation of commercials selling and speculators buying…the opposite of the trend throughout early 2023. Asset managers have finally begun to do some small liquidation on the recent break.
Timing Points
- 10/13 *** X
- 10/19 **
- 10/22 **
- 11/02-03 *** X
CNN Fear & Greed Index
AAII Investor Sentiment Survey
 Dow Jones Industrial Average Hourly HLC
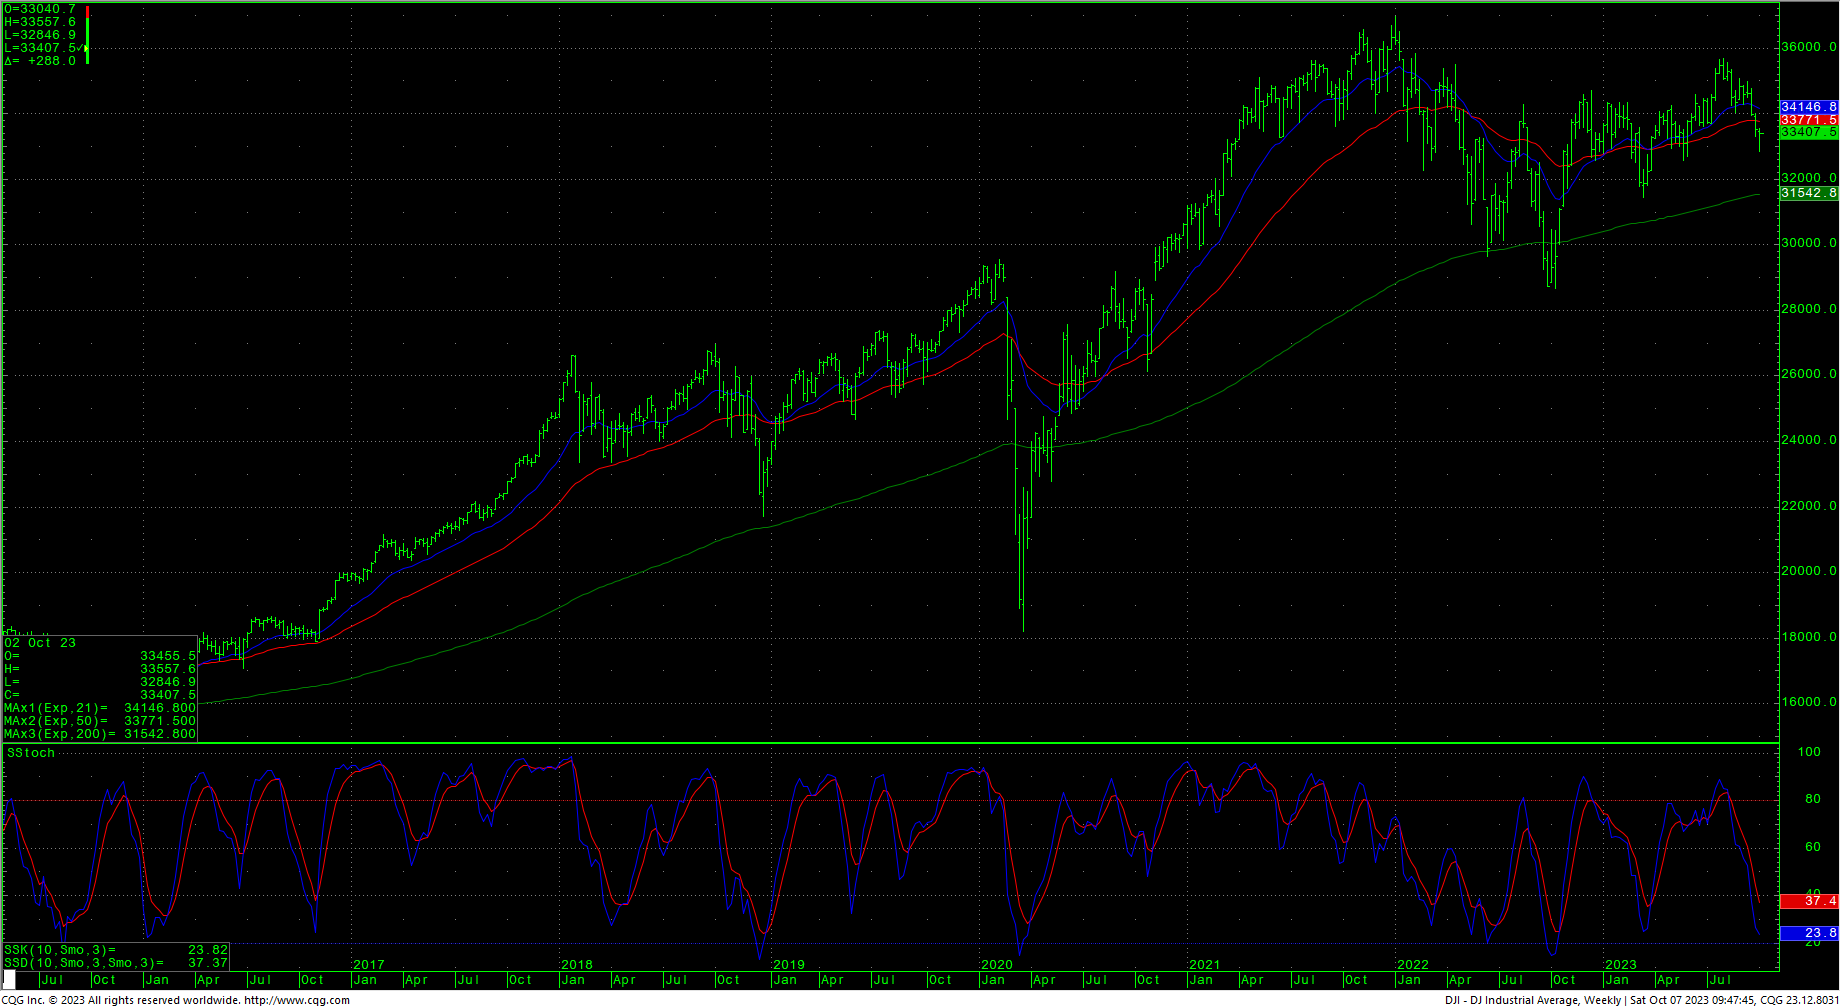
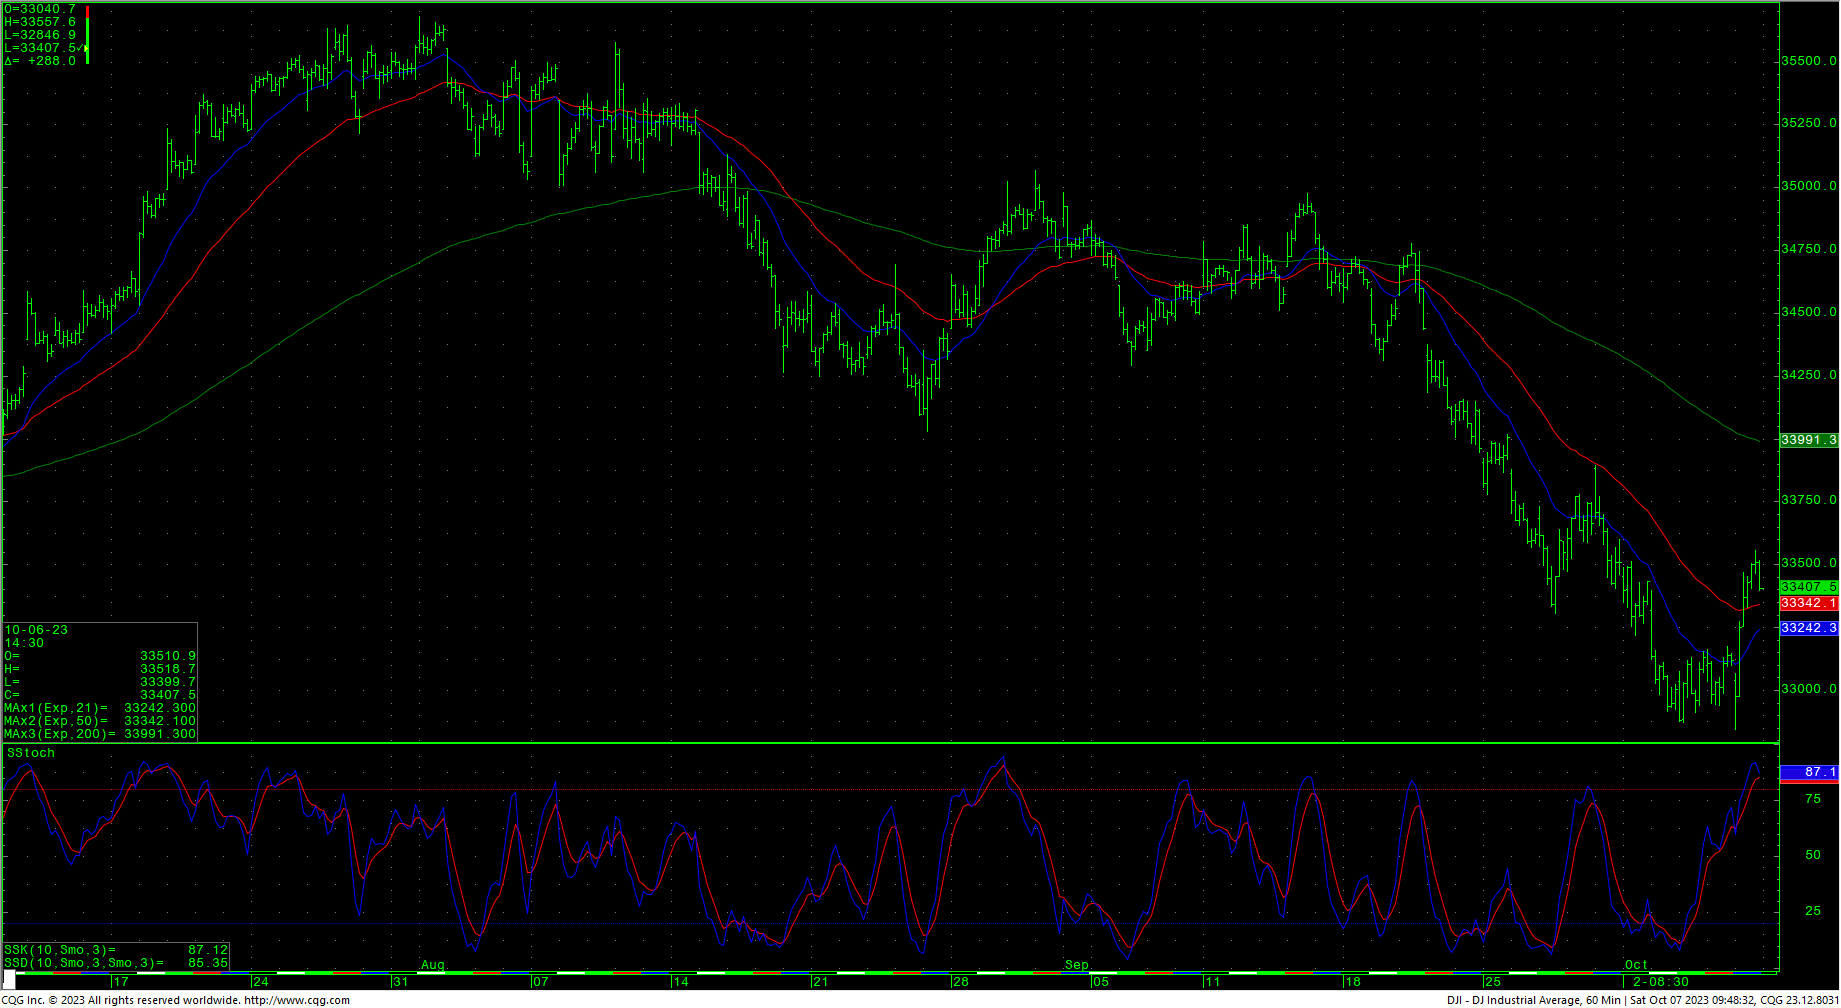 The Dow hourly is reaching overbought conditions with Friday’s rally and it is important to note that price/time are not favorable on the intermediate-term charts. Again, prices reacting to oversold daily conditions and critical intermediate-term support against 33053/33045 through 32998. A further breakdown with daily closes below 32998 can test 32731 with support at 32586 through 32492. Support is key long-term at 32170 and a close under that area is bearish with counts into the 31341/31330 level. Closes under 31330 in the Dow will open potential to 29806 through 28660.
Resistance is 33515 and 33696/33700. Closes over 33700 are near-term friendly and open counts to 33958 with potential to 34220/34263. A breakout above 34263 should minimally test 34597/34605. Daily closes over 34605 suggest a test of 35010 with counts to 35070. Closes above 35070 setup a test of the trading highs at 35679 with intermediate counts to 35824 and longer-term counts into a gap area on the daily at 35996 to 36044.
Dow Jones Industrial Average Weekly HLC
 Support
- 33389 **
- 33755 **
- 33286 **
- 33202 ***
- 33118/33113 *** ↓
- 33053/33045 *** ↓
- 32998 *** ↓
- 32846 *** ↓
- 32764 *** ↓
- 32731 **
- 32586 *** ↓
- 32492 *** ↓
- 32432 ** ↓
- 32276 **
- 32170 *** ↓
- 32020 **
- 31805 *** ↓
Resistance
- 33515/33518 **
- 33558 **
- 33696/33700 *** ↑
- 33958 ***
- 34110 **
- 34220 *** ↑
- 34263 *** ↑
- 34378 ** gap
- 34434 ** fills gap
- 34597/34605 *** ↑
- 34776 ** ↑
- 34900 **
- 35010 *** ↑
- 35070 *** ↑
S&P 500 Cash Index
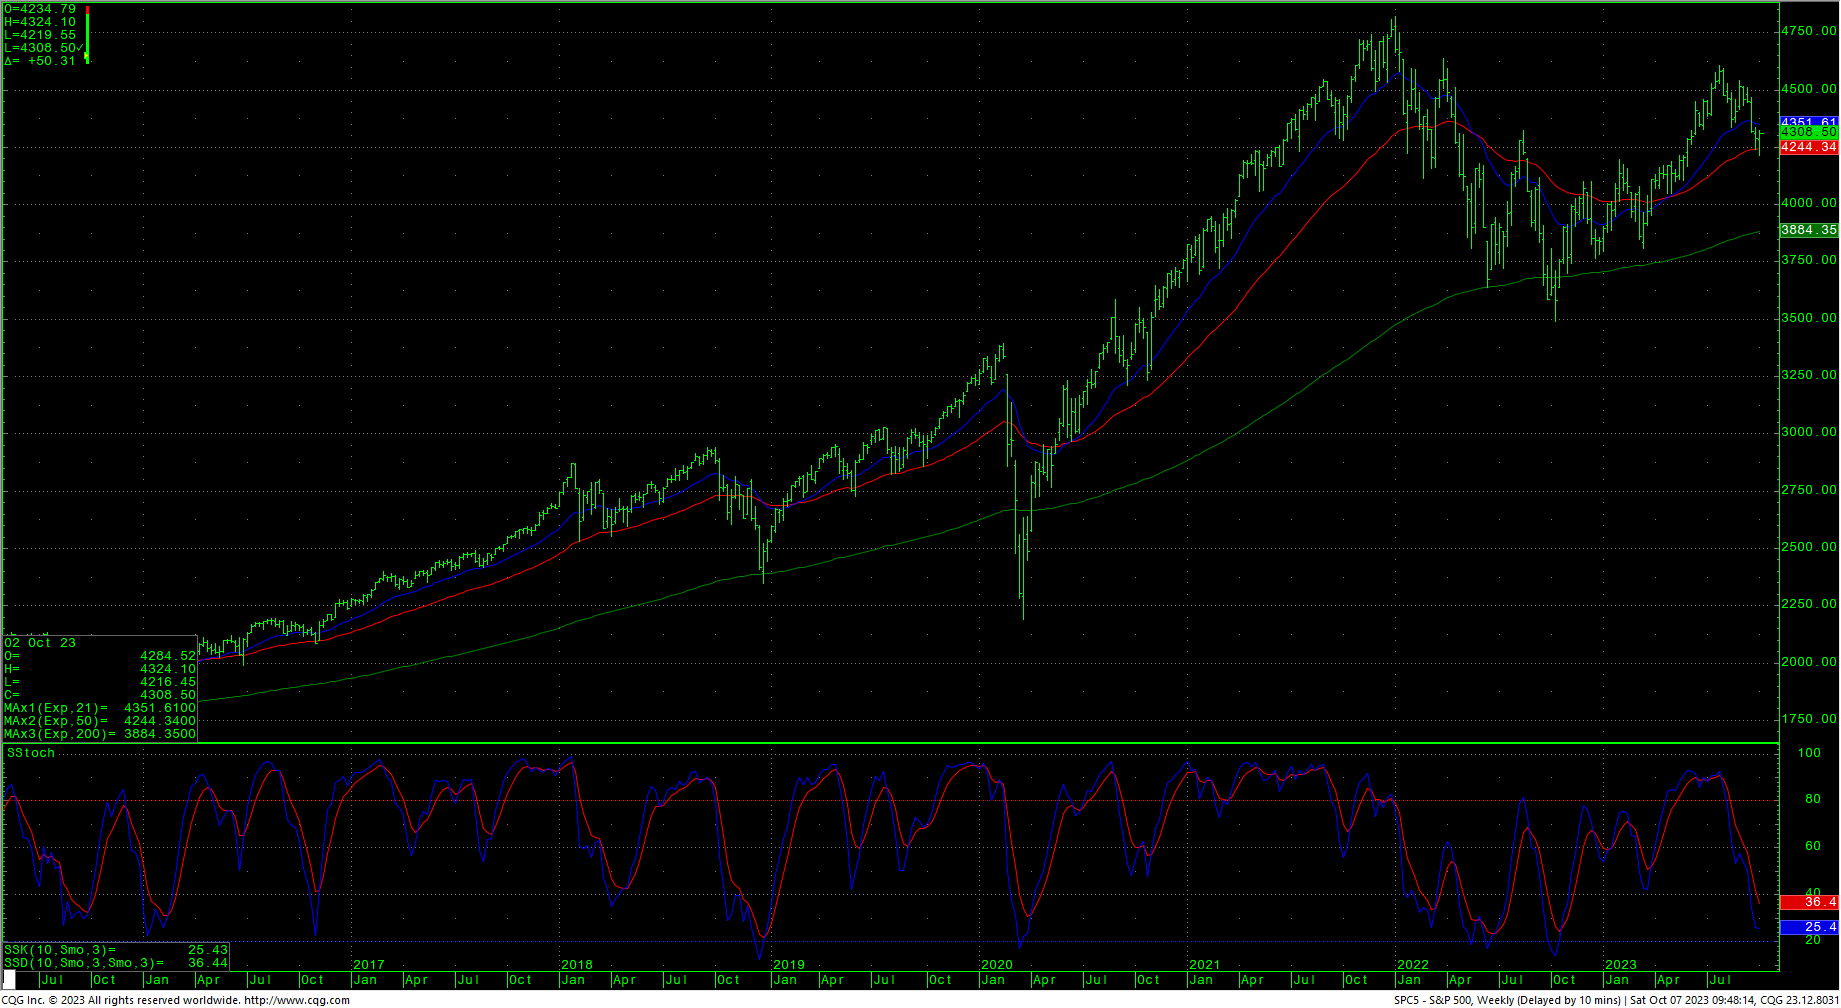
The S&P hourly is showing slightly overbought with Friday’s close as the market reacted to a bullish divergence with the spike low Friday. Prices traded under critical intermediate-term support at 4262/4255 but managed to close back above that level. Continued breakdowns with closes under 4255 open counts to 4049 and critical long-term support of 3917/3910. Daily closes below 3910 open counts to 3754/3750 with potential to monthly support at 3503/3491.
Resistance is 4365, 4379, 4412/4417 and 4457/4460. A drive over 4460 should minimally test pivotal hourly resistance at 4509/4515. A breakout over 4515 is friendly and sets up a move to 4607. Closes above suggest a minimal test of 4637. A breakout with closes above 4637 opens potential toward 4748 and ultimately 4818. Above the record highs opens counts to 4952/5000 with potential to 5144.
S&P 500 Index Weekly HLC
 Support
- 4283 **
- 4270 **
- 4262/4255 *** ↓
- 4216 ** ↓
- 4180/4177 *** ↓
- 4049 *** ↓
- 3917/3910 *** ↓
- 3875 **
- 3754/3750 *** ↓
- 3625 **
- 3500/3491 *** ↓
Resistance
- 4333 **
- 4365 **
- 4376 ** gap
- 4385 ** ↑
- 4401 ** fills gap
- 4412/4417 *** ↑
- 4455/4460 ** ↑
- 4509/4515 *** ↑
- 4527 **
- 4541 **
- 4550 **
- 4575 *** ↑
- 4593 **
- 4607 *** ↑