
TECHNICAL ANALYSIS (by Intraday Dynamics)
Major Indices Week of November 10, 2023
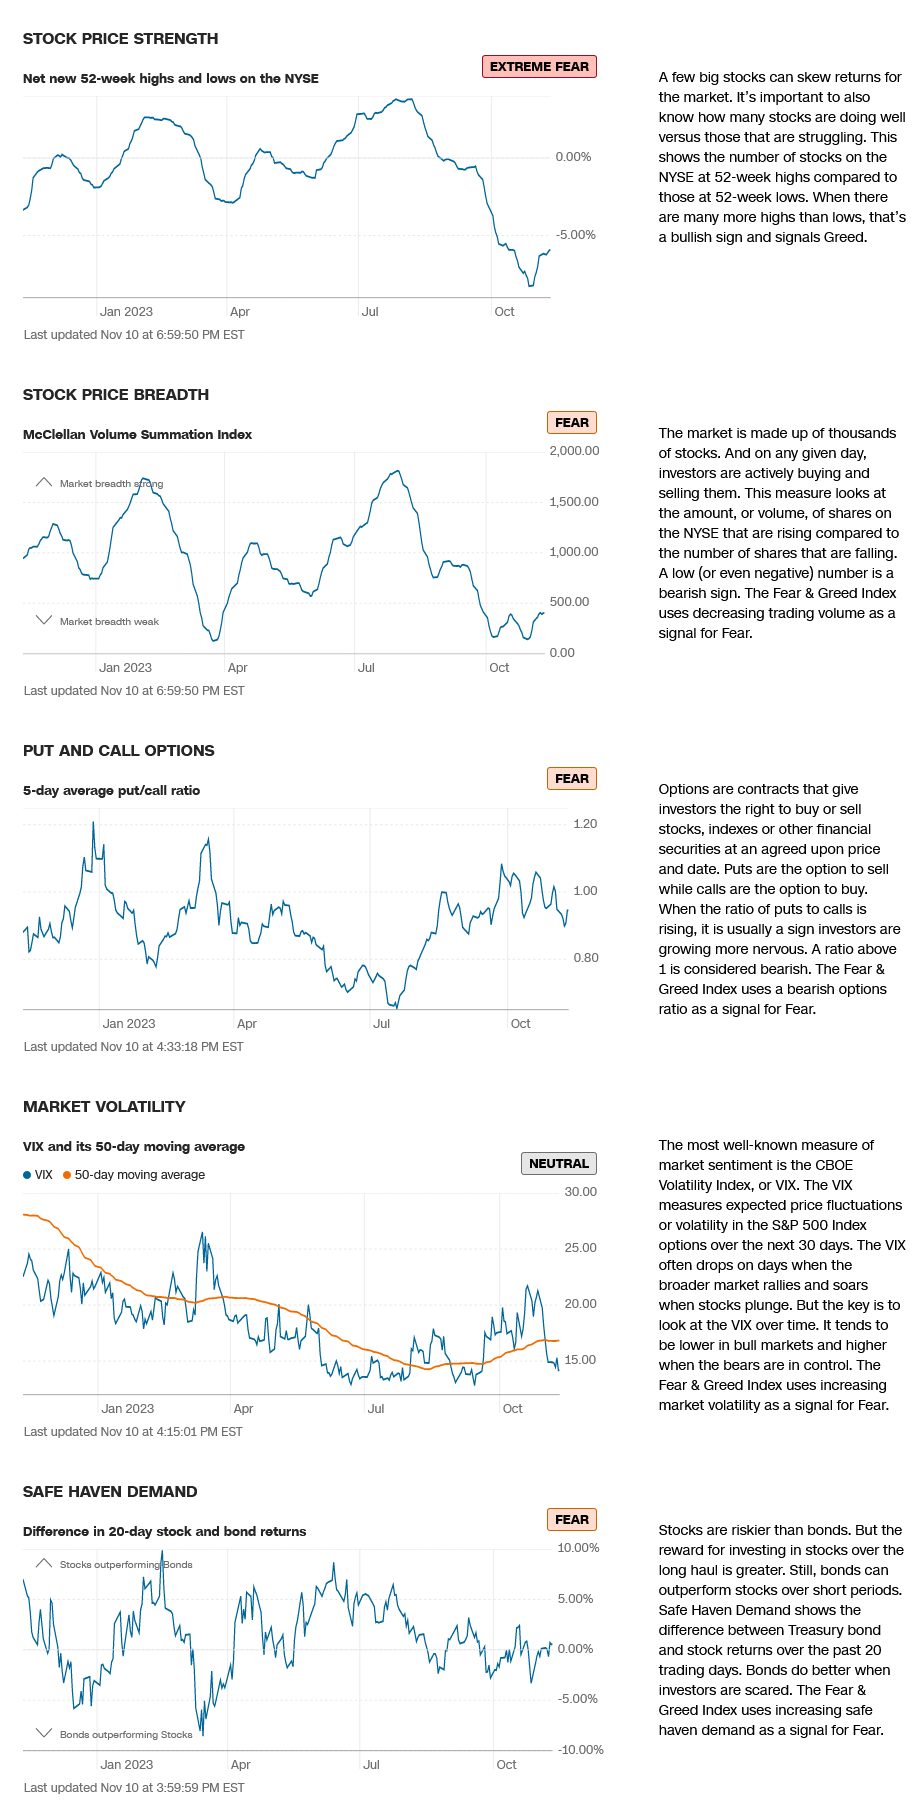
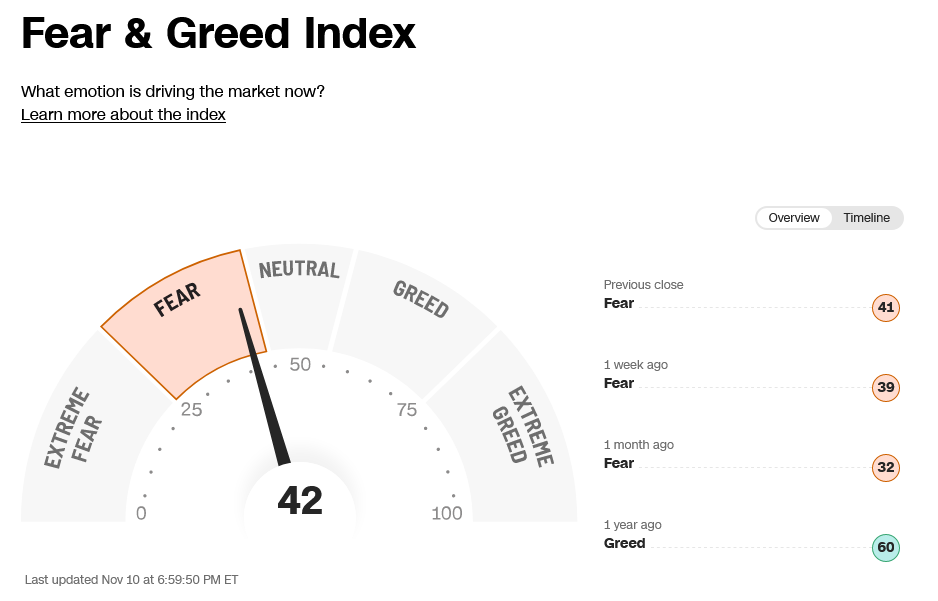
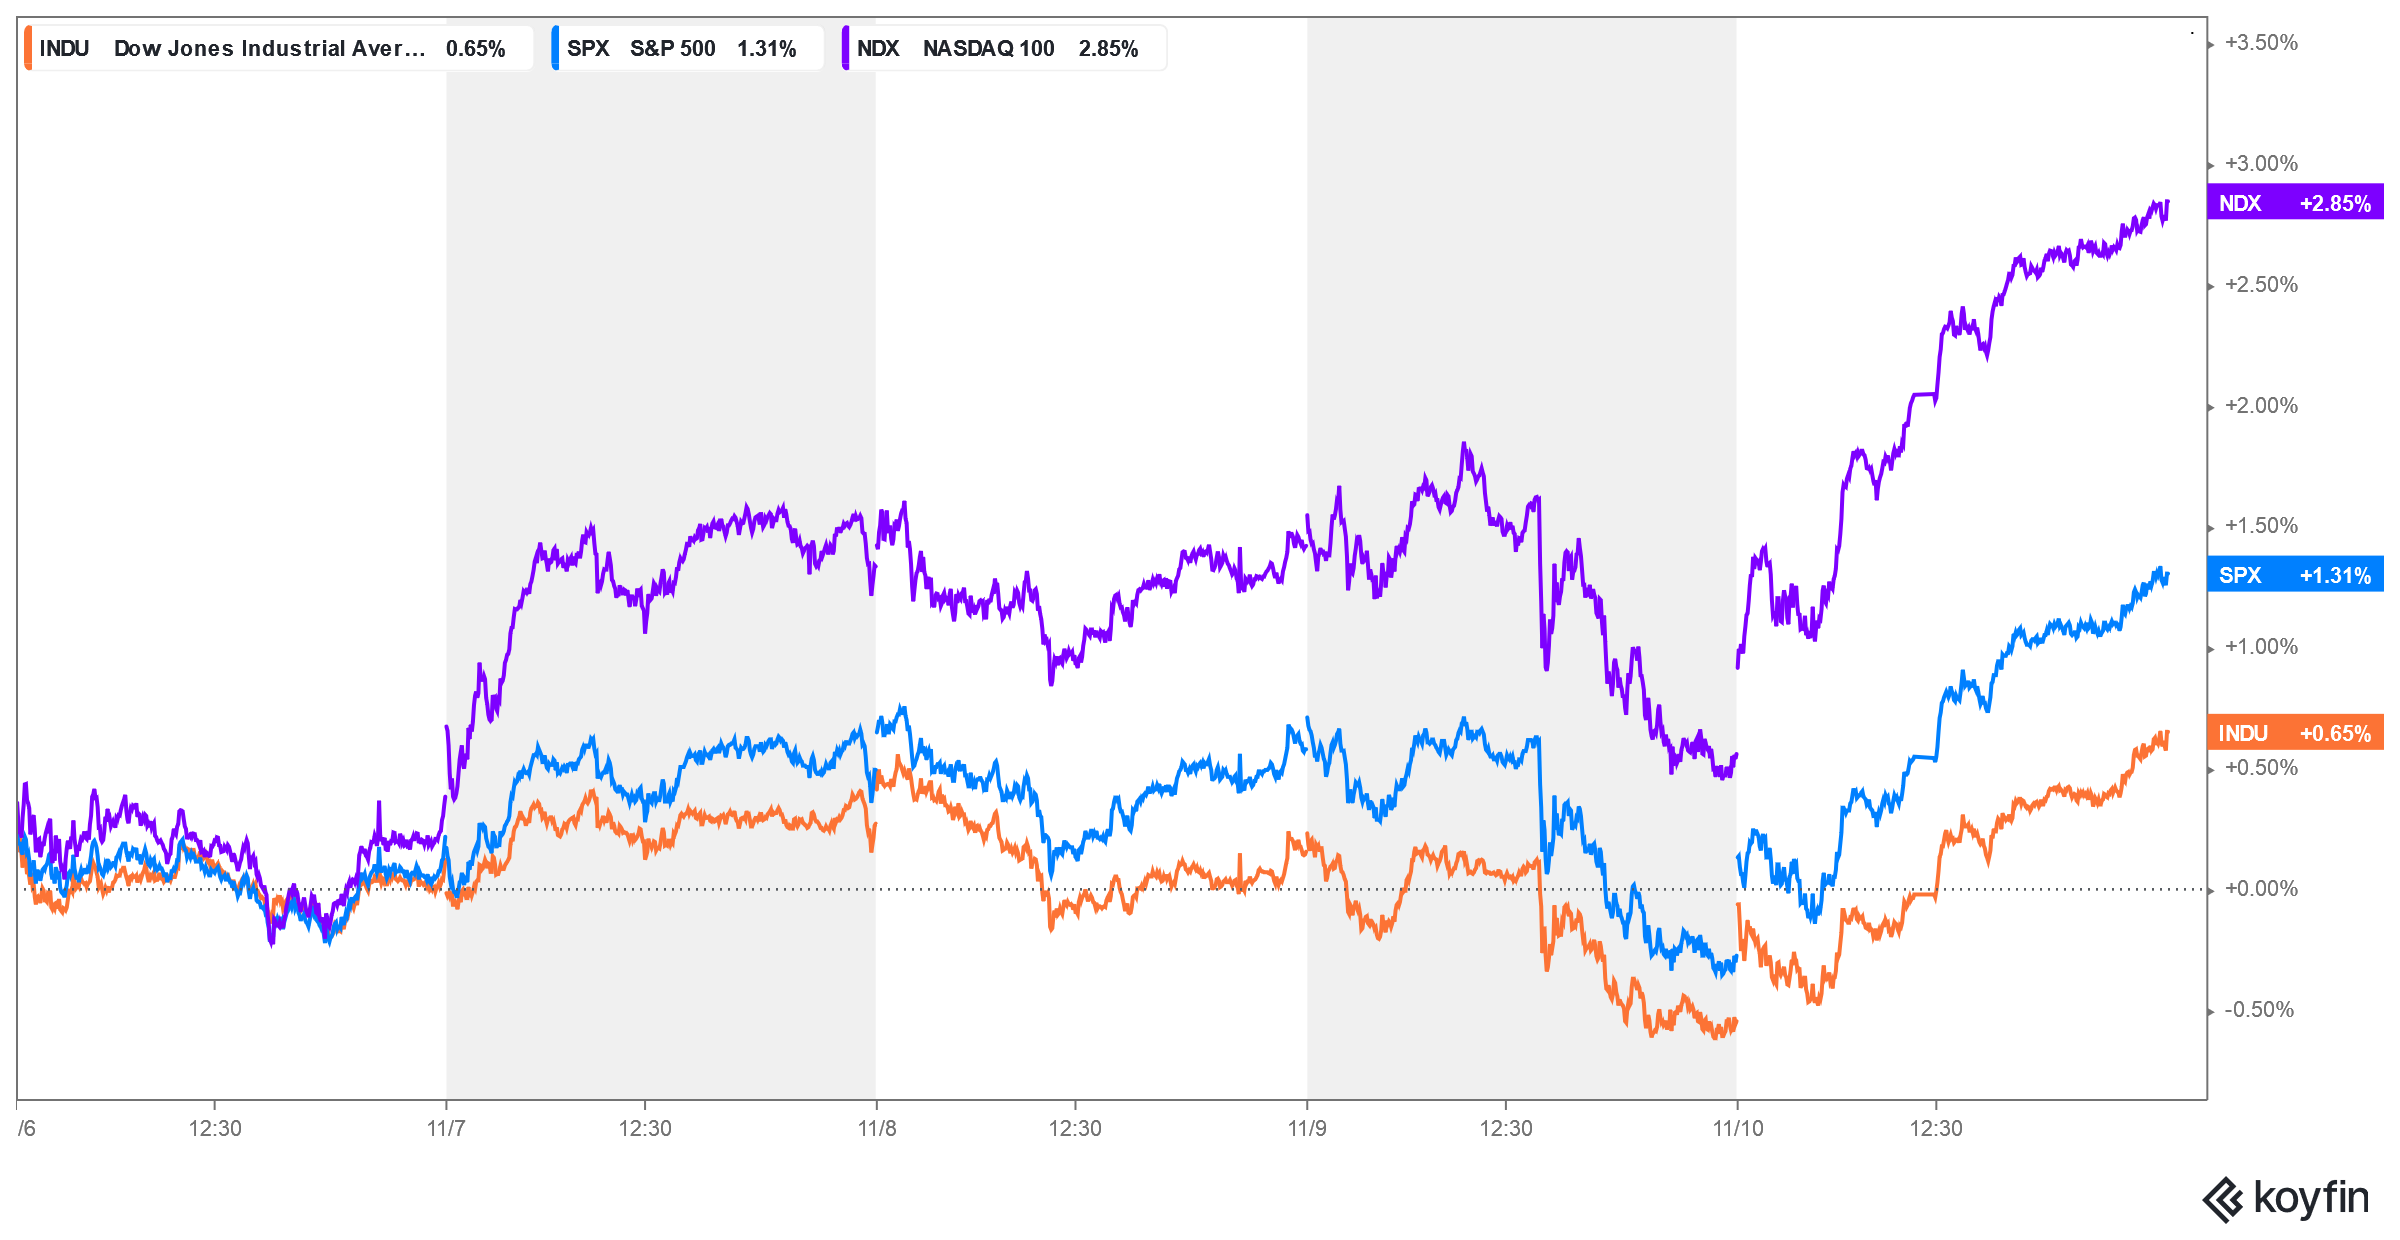 Stocks closed out a mixed week mostly higher, with tech and large cap stocks leading the way, while the dogging secondary market once again under-performed. The Dow dipped into the runaway gap on the daily, but left a few point gap on that chart before rallying sharply on Friday to close out the week with a modest gain. The close is the highest daily close since 20 September 2023. The S&P decisively cleared the October highs and closed at the highest daily close since 19 September 2023 as that chart filled in a long standing gap from back in late September. The daily charts are now starting to reach some overbought conditions as the weeklies are reacting to oversold intermediate-term readings. The S&P daily is now flirting with trendline resistance from the 2023 tops and it has regained the 125-day MA…which translates to a greed reading. That said, the majority of sentiment remains vastly mixed with EXTREME FEAR readings still showing while a number of other indicators are less dramatic. Time and price remain bullish, and the S&P clearing the October highs helps add to that outlook.
52-Week A/D Line
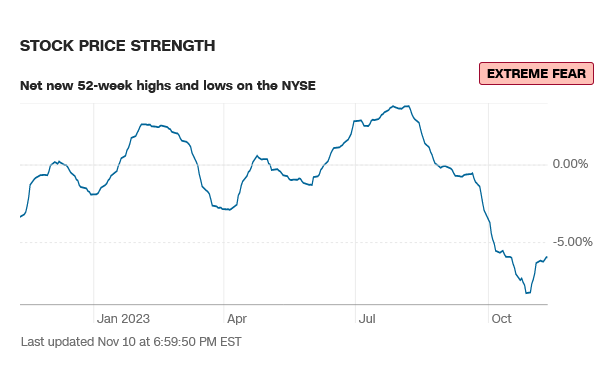
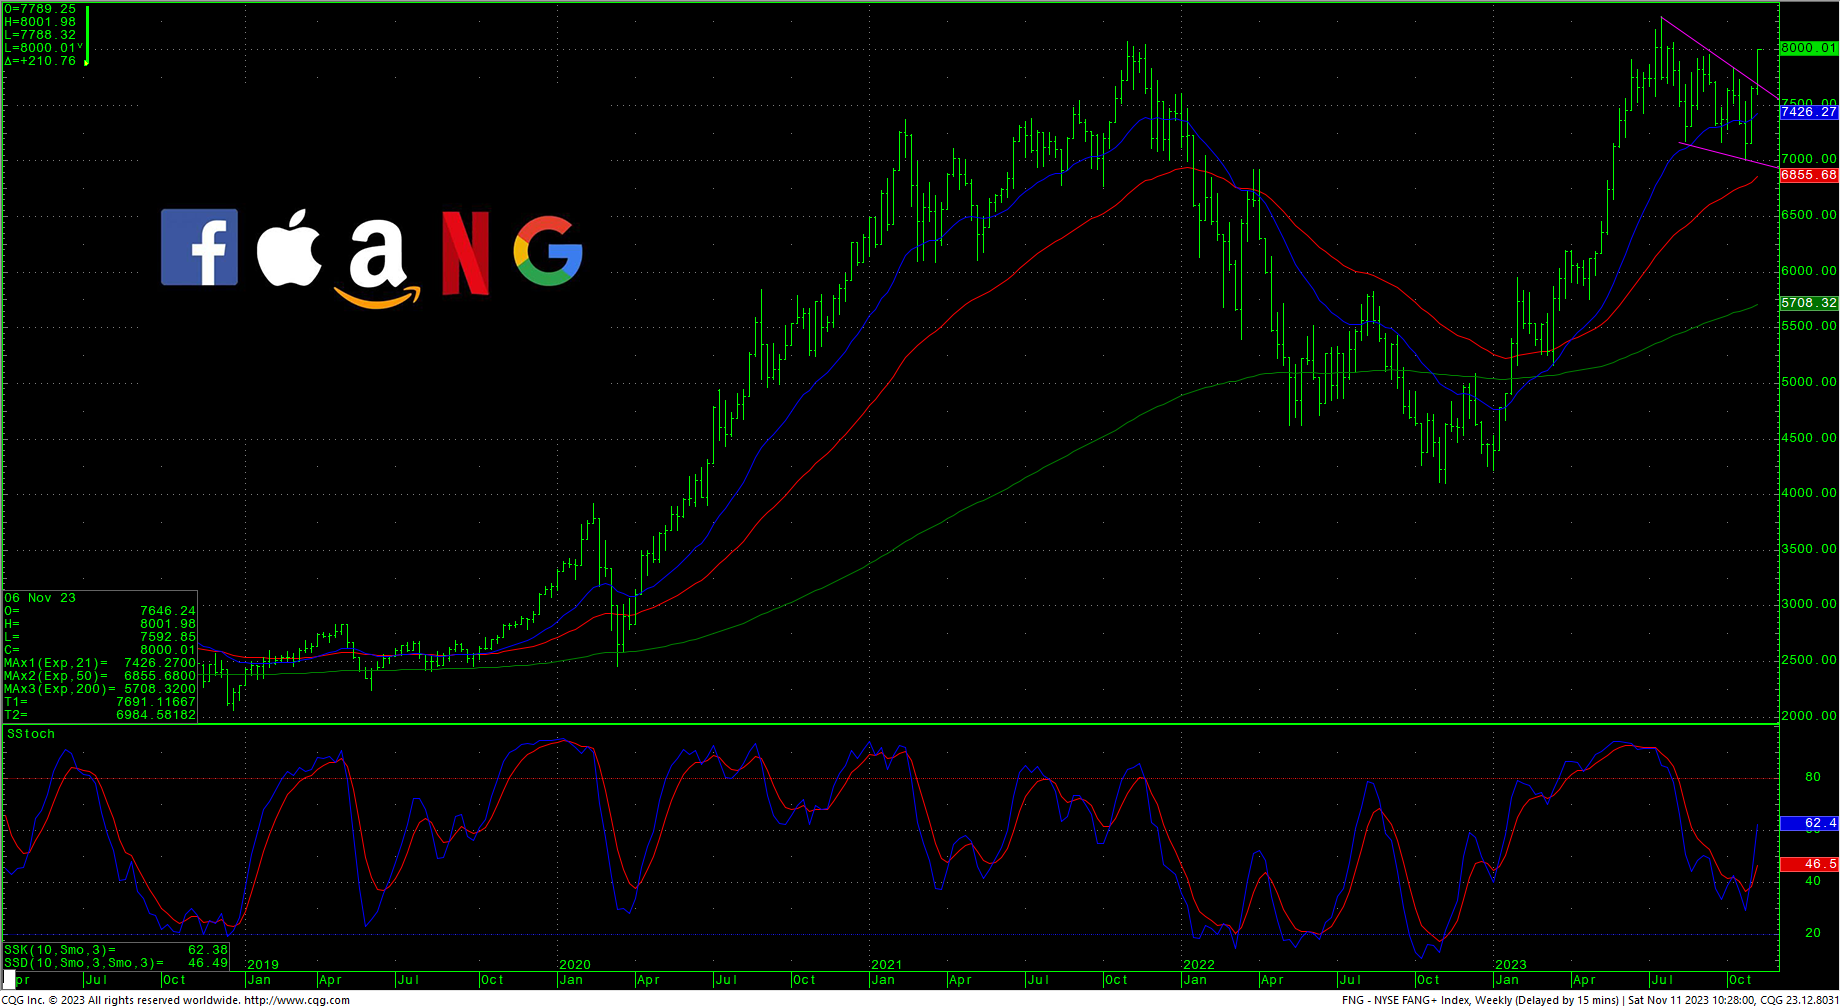
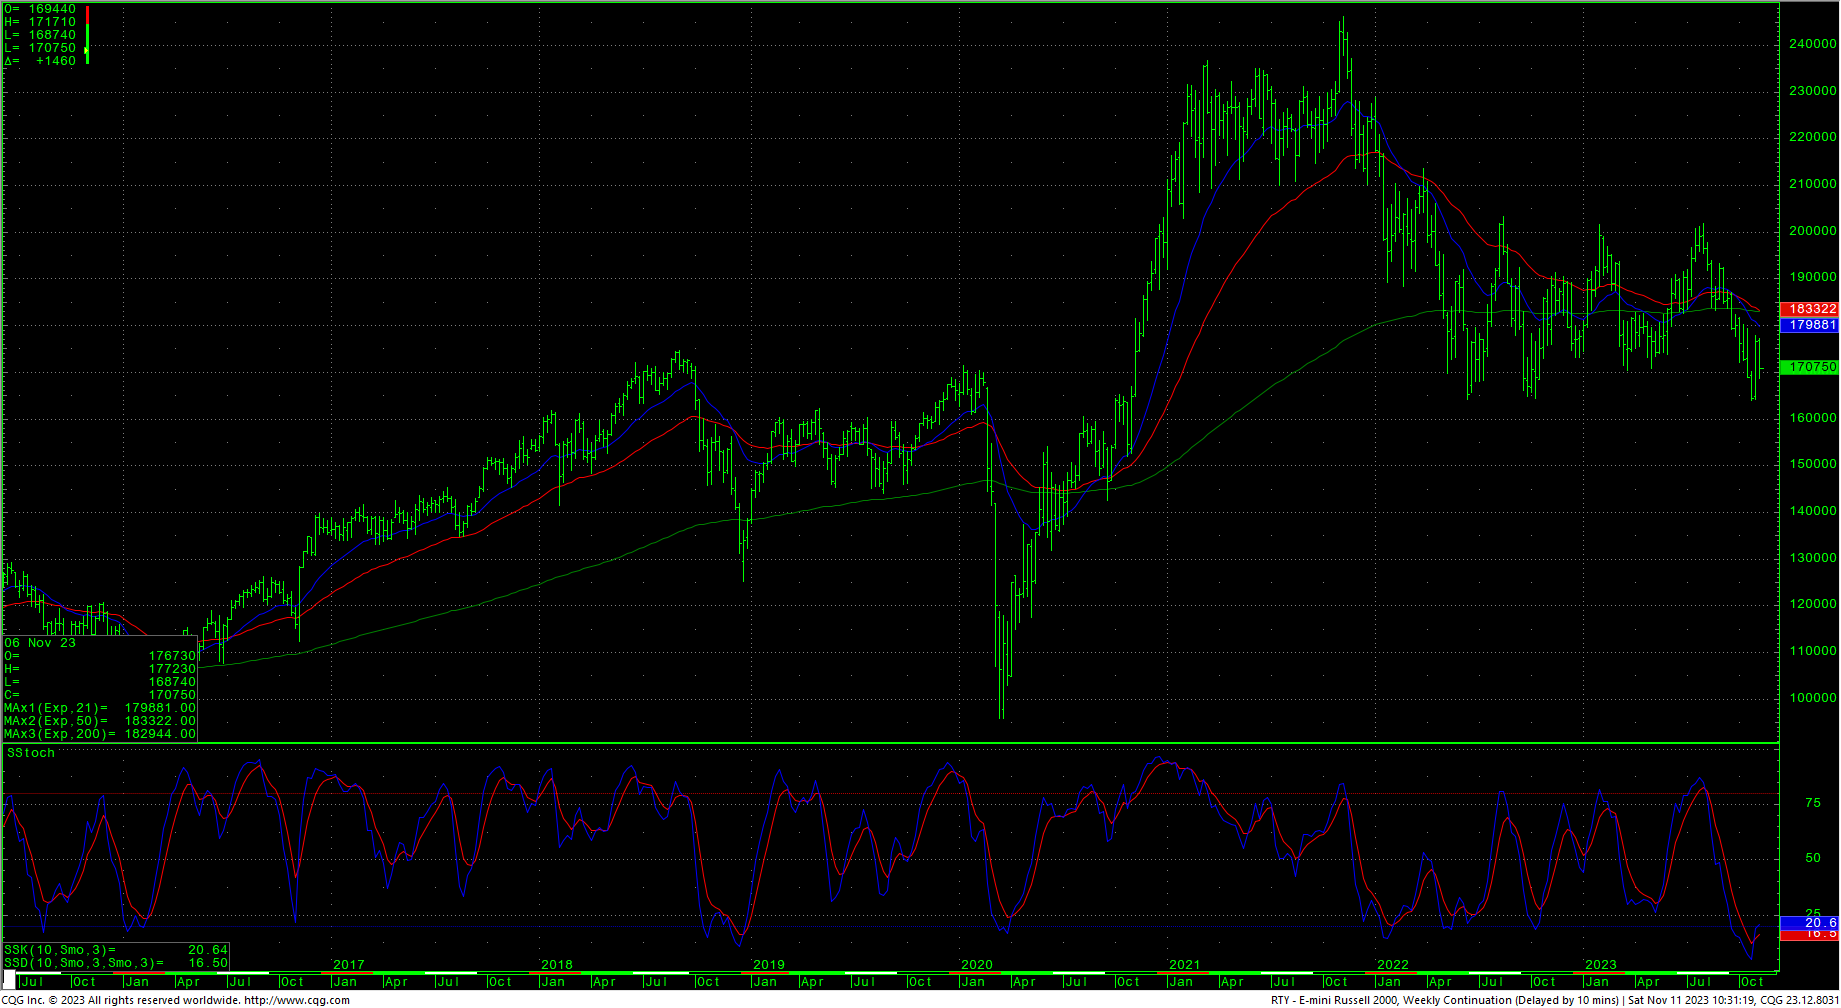
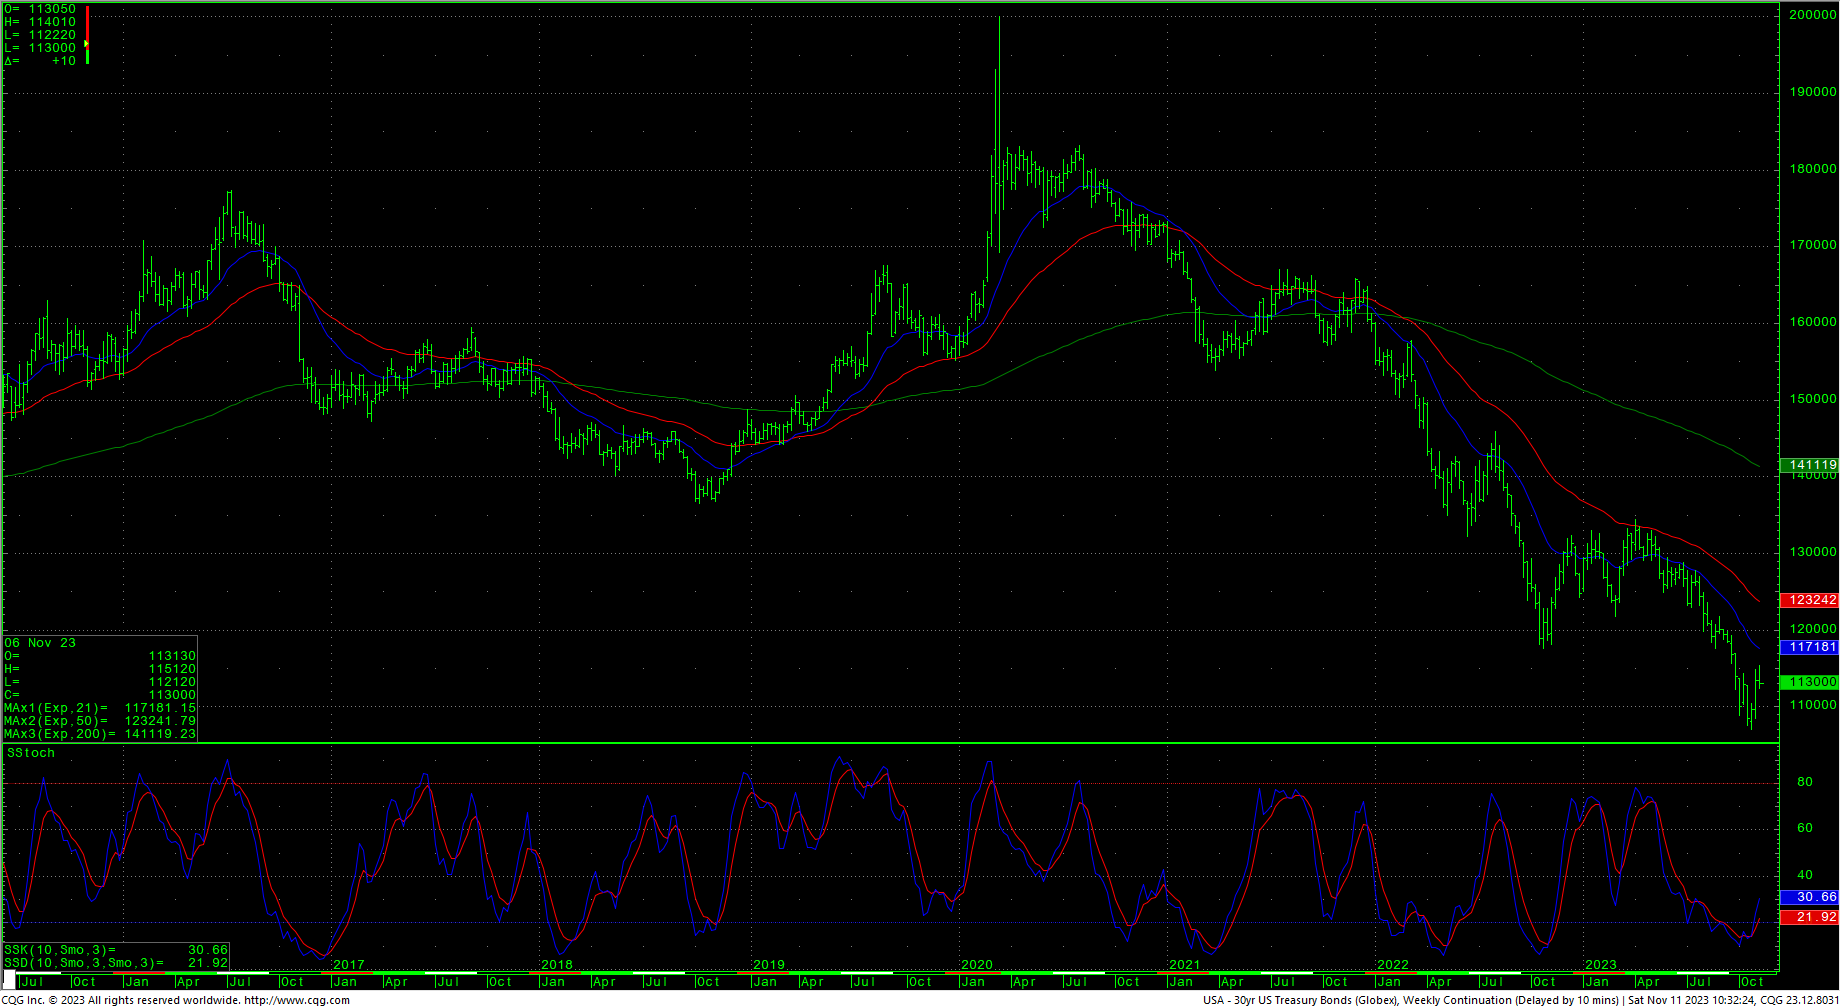
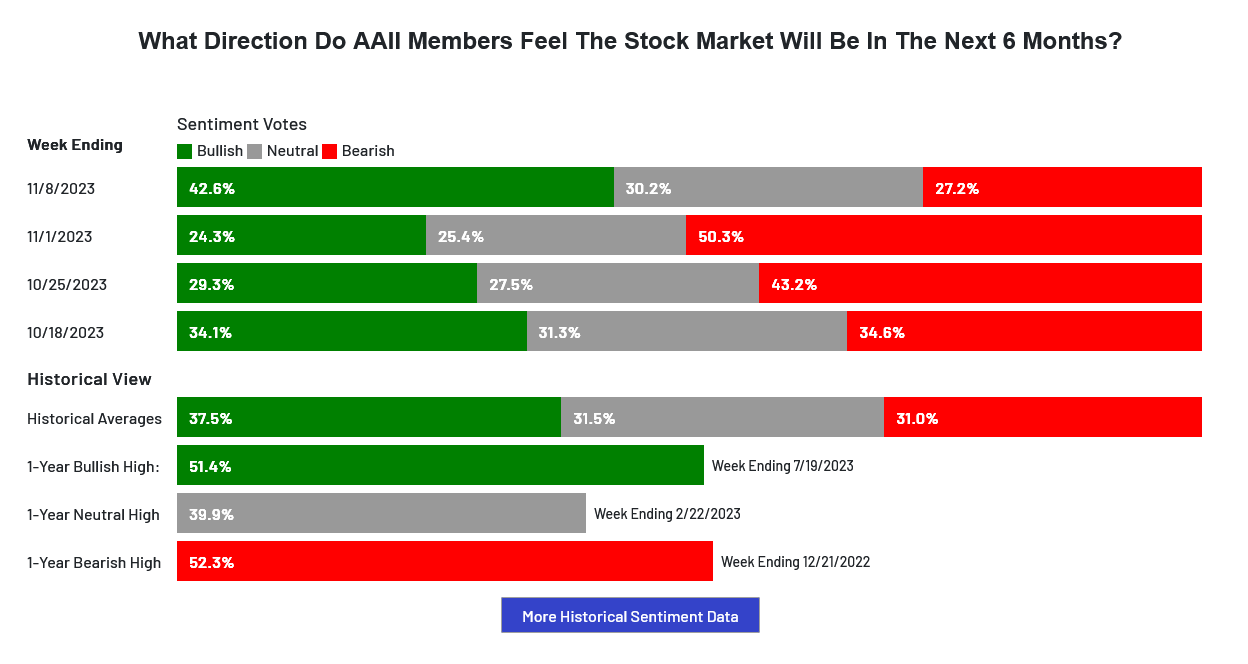
As mentioned, sentiment is mixed with some lingering EXTREME FEAR. The AAII Sentiment: Saw Optimism Surging Last Week. The VIX closed lower as it moves back toward the 2023 lows. The 52-week, A/D moves slightly higher to -5.94% which still indicates extreme fear. The Put/Call ratio sits at 0.95, another fear reading. The Dow closed the week up +0.65%. The S&P was up +1.35%. The Nasdaq ended the week up +2.37%, the FANG rallied sharply through the upper trendline of the bull flag pattern on the weekly, closing up +4.63% while the Russell struggled all week and closed down -3.15. The bond market stalled out and the 30-year closed slightly lower in a tight weekly reversal, closing on the low of the range. The CRB closed down sharply, -3.04%, as crude oil and gold plunged lower. The Commitment of Traders CoT shows commercials and Asset Managers selling into this rally. The next timing point is this coming Friday and marks critical timing.
Timing Points
- 11/17 *** X fast moves/swings/volatility
- 11/24 **
CNN Fear & Greed Index
AAII Investor Sentiment Survey
Dow Jones Industrial Average Hourly HLC
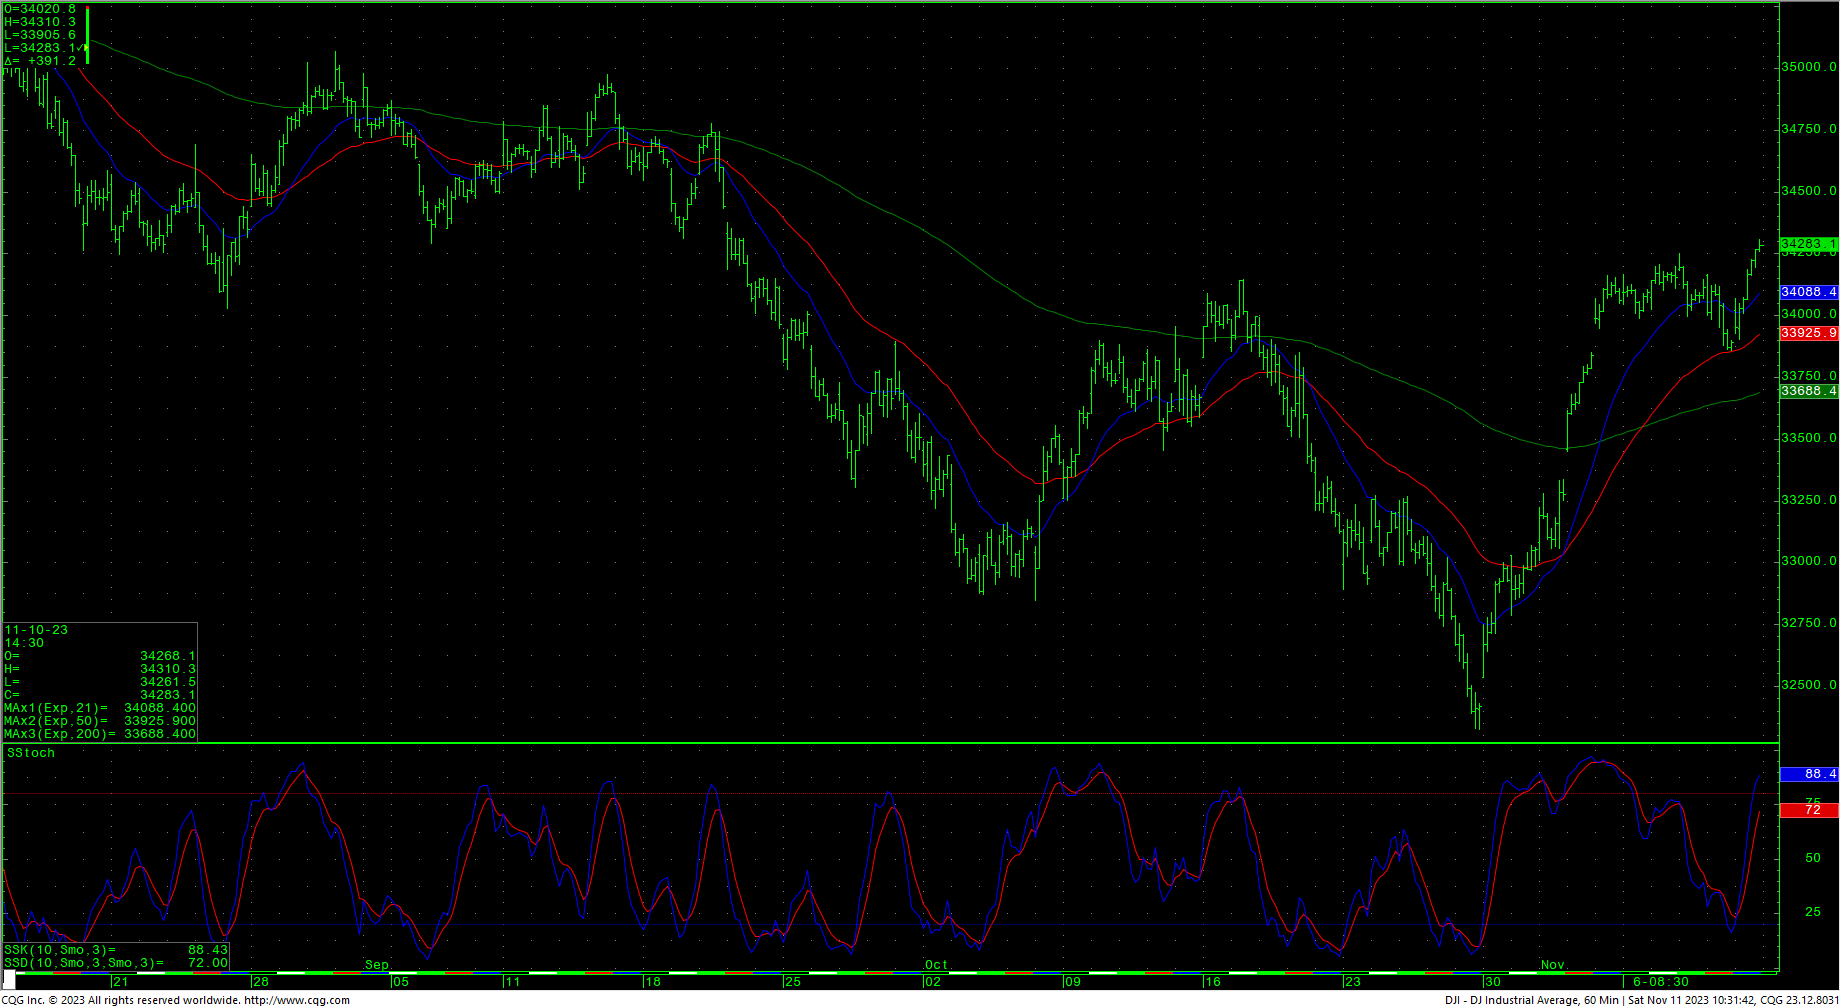 The Dow hourly is neutral as Friday’s rally reacted to some oversold conditions. The market cleared resistance at 34163 and further rallies should carry to pivotal resistance at 34398/34410. A breakout above 34410 should minimally test 34841/34888. Daily closes over 34888 suggest a test of 35010 with counts to 35070. Closes above 35070 set up a test of the trading highs at 35679 with intermediate counts to 35824 and longer-term counts into a gap area on the daily at 35996 to 36044.
Support is at 33852/33842 and trading back under that area suggests 33552. A breakdown under 33552 opens counts to 33318 with potential to pivotal near-term support of 33084/33075. A breakdown under 33075 will setup a retest of the 32327 area while opening up lower counts. Support is key intermediate-term against the 32170 level. That area represents a 50% retracement of the entire move from the 2022 lows to the 2023 highs. A breakdown with closes under 32170 is bearish and opens counts into the 31429 through 31341/31330 level with a target at 31665. Closes under 31330 in the Dow will open potential to 29806 through 28660 with support at 30415 and 30317.
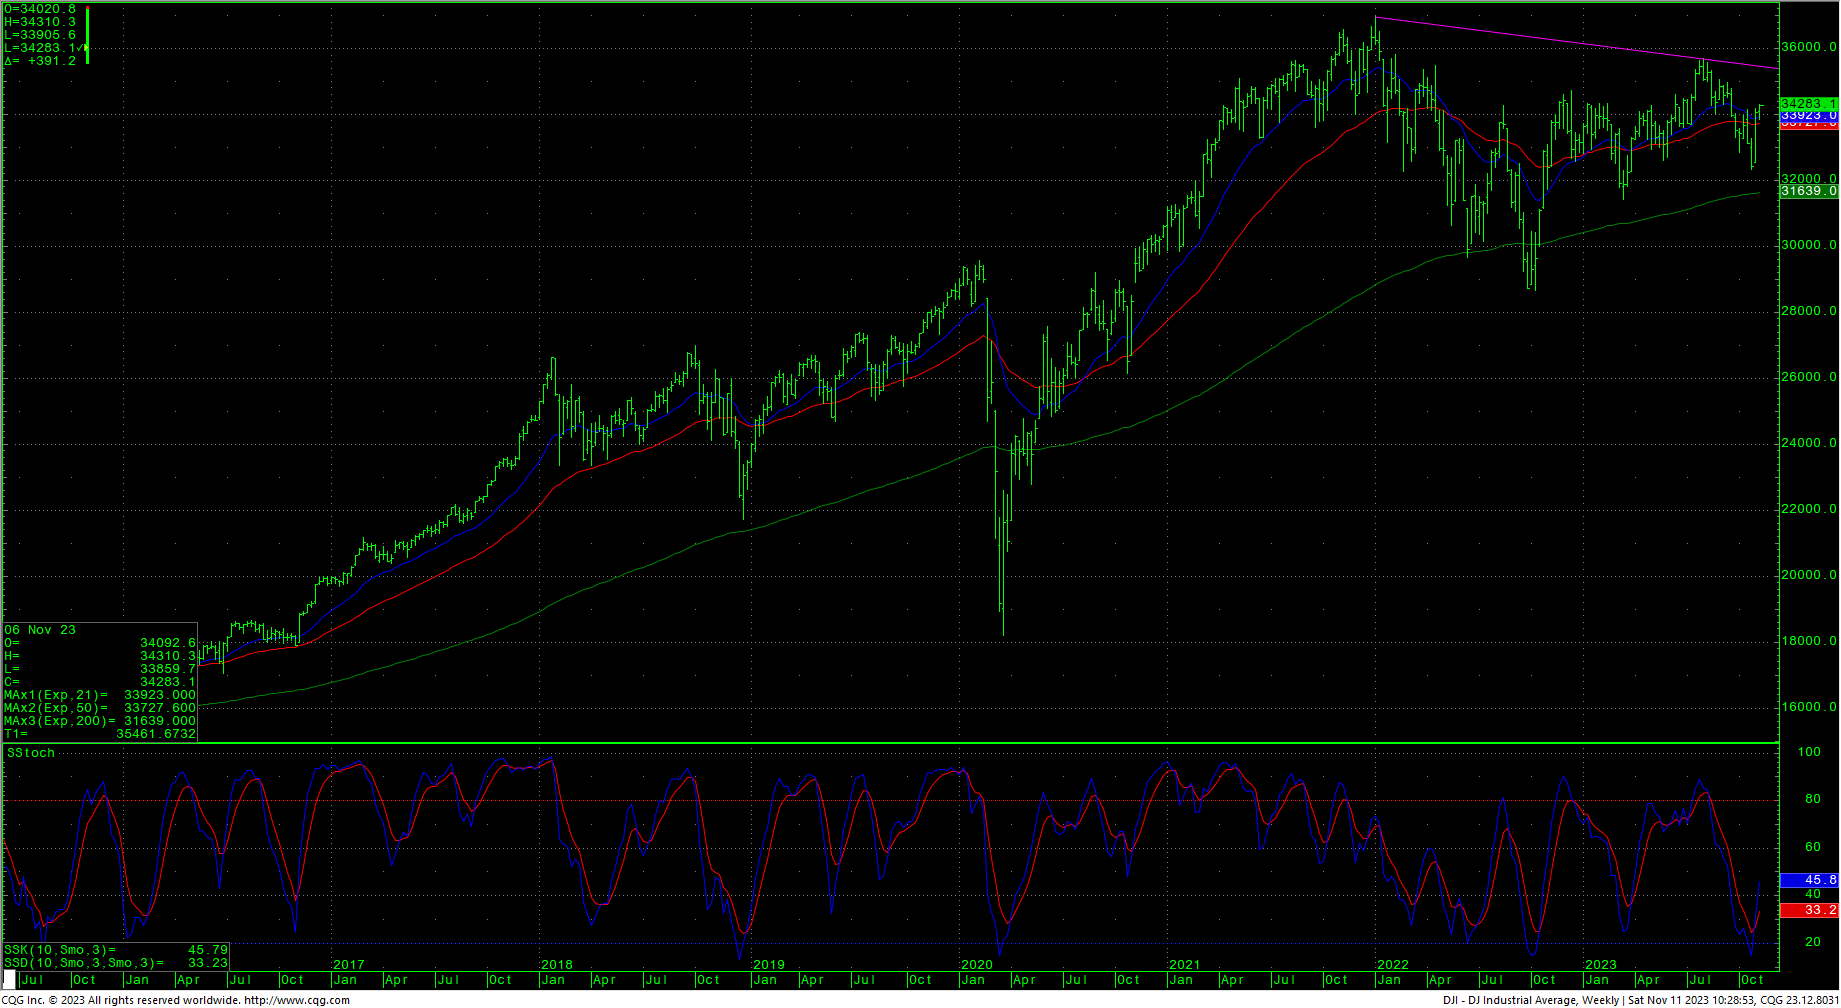
Dow Jones Industrial Average Weekly HLC
Resistance
- 34310 **
- 34378 ** hourly gap
- 34398/34410 *** ↑
- 34434 ** fills hourly gap
- 34600 ** ↑
- 34776 ** ↑
- 34841/34888 *** ↑
- 34977 **
- 35010 *** ↑
- 35070 *** ↑
- 35246/35270 *** ↑
- 35354 ** ↑
- 35432 **
- 35578 ** ↑
- 35670 *** ↑
- 35800/35824 *** ↑
- 35996 ***
- 36044 *** ↑
- 36271 **
- 36390 **
- 36513 *** ↑
Support
- 34203 **
- 34136 **
- 34085 ***
- 34031/34028 *** ↓
- 33905 **
- 33852/33842 *** fills gap ↓
- 33730 **
- 33462/33450 *** ↓ gap
- 33552 *** ↓
- 33337 ** fills gap
- 33318 *** ↓
- 33245 ***
- 33084/33075 *** ↓
- 32900 **
- 32786/32760 *** ↓
- 32650 **
- 32537 ** hourly gap
- 32430 ** fills hourly gap
- 32327 *** ↓
- 32276 **
- 32170 *** ↓
- 32020 **
- 31805 *** ↓
- 31727 **
- 31429 *** ↓
- 31341/31330 *** ↓
- 31250 **
- 31161 *** gap
- 31119 *** ↓ fills gap
- 30990 **
- 30837/30822 ***
- 30625 **
- 30415/30317 *** ↓
S&P 500 Cash Index
S&P 500 Index Daily HLC
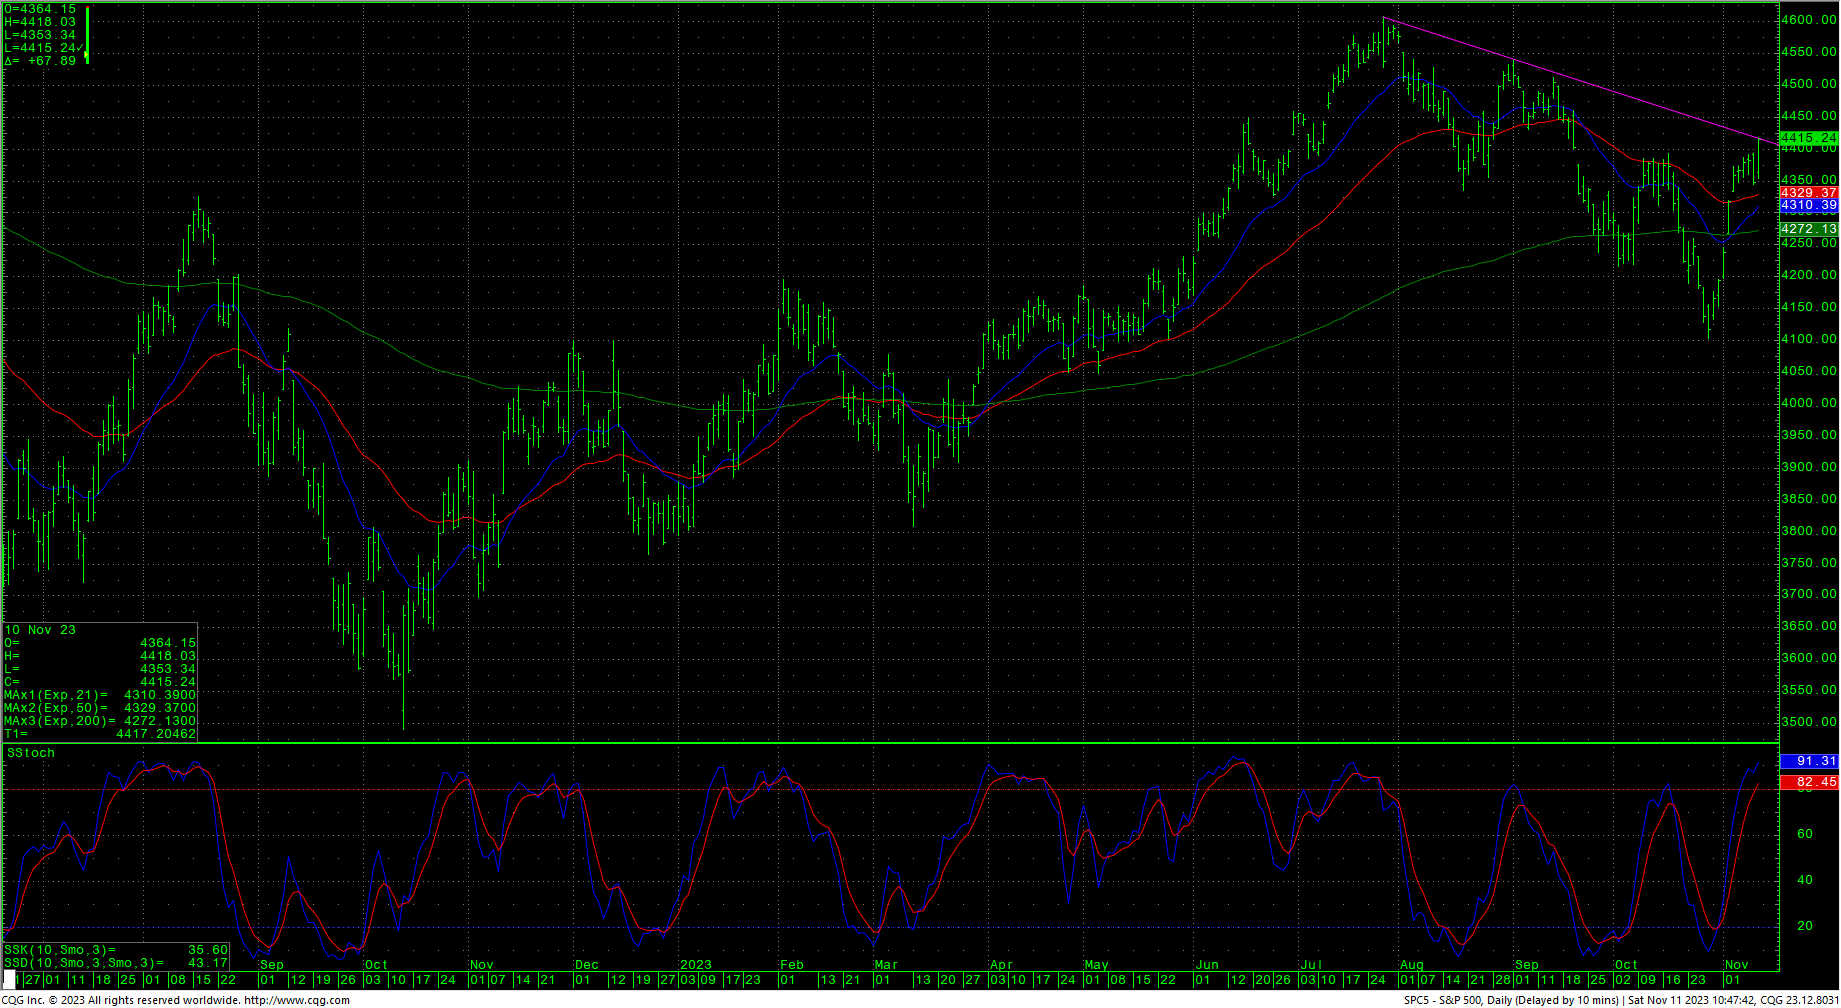 The S&P worked off the short-term overbought conditions with sideways trade before rallying sharply on Friday to take out the October trading highs and closing at the highest levels since mid-September. The 21-day MA hooked back over the 200-day after taking it out two weeks ago on the break. The daily is now bumping up against the trendline down from the current tops. Prices cleared the 62% retracement of the last decline and closed right at a key area of resistance at 4412/4417. A further drive above this level should minimally test resistance at 4509/4515. A breakout over 4515 is friendly and sets up a move to 4607. Closes above suggest a minimal test of 4637. A breakout with closes above 4637 opens potential toward 4748 and ultimately 4818. Above the record highs opens counts to 4952/5000 with potential to 5144.
Support is at 4372/4370 and a breakdown under that level should carry to 4343 with counts to 4298/4297. A breakdown under 4297 can test 4260 with counts to 4223/4220. Daily closes under 4220 set up a retest of the 4049 area. Daily closes under 4049 open counts to critical long-term support of 3917/3910. Daily closes below 3910 open counts to 3815 and 3770/3754 with potential to monthly support at 3505/3491. A move under 3491 is bearish and opens counts to 3195/3185.
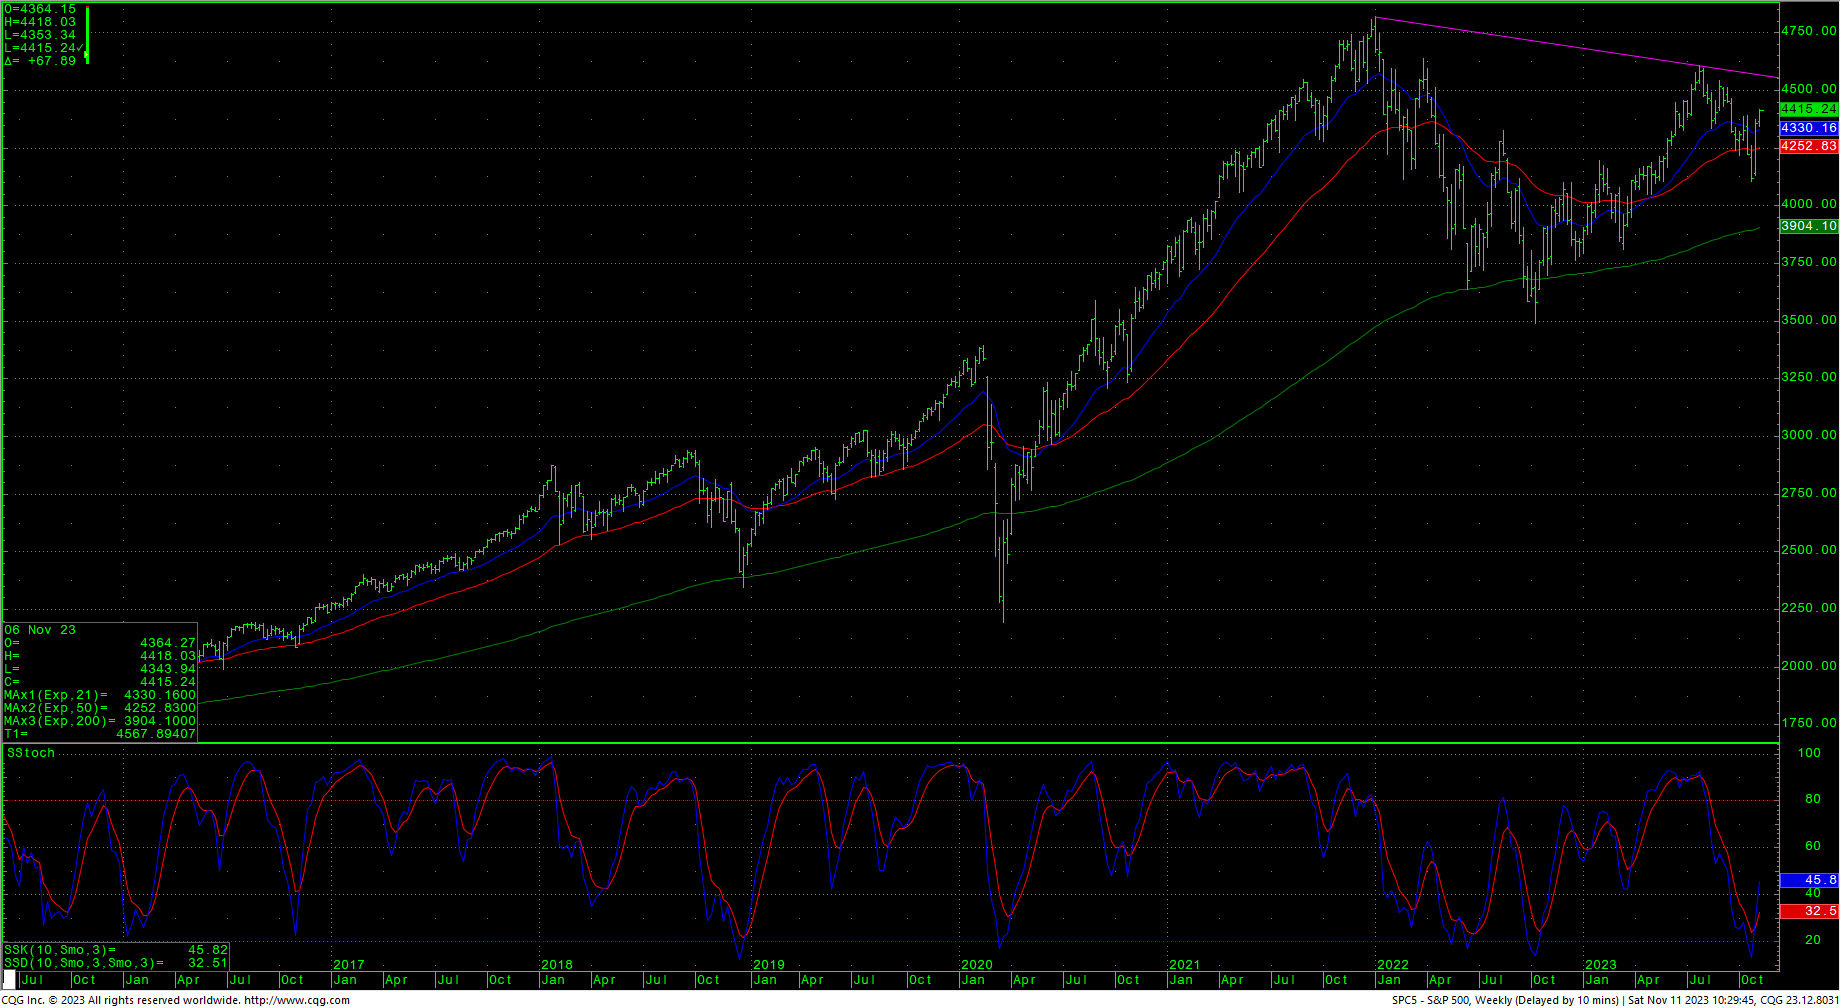
S&P 500 Index Weekly HLC
Resistance
- 4417/4418 *** ↑
- 4455/4460 **
- 4509/4515 *** ↑
- 4527 **
- 4541 **
- 4550 **
- 4575 *** ↑
- 4593 **
- 4607 *** ↑
- 4637 *** ↑
- 4665 **
- 4748 *** ↑
- 4818 *** ↑
- 4826 **
- 4849/4850 *** ↑
Support
- 4400 **
- 4389 **
- 4380 **
- 4372/4370 *** ↓
- 4343 ** ↓
- 4334 ** gap
- 4319 ** fills gap
- 4309 **
- 4298/4297 *** ↓
- 4270/4268 *** gap ↓
- 4238 *** ↓
- 4206/4195 *** ↓ hourly gap
- 4103 **
- 4049 *** ↓
- 3917/3910 *** ↓
- 3875 **
- 3754/3750 *** ↓
- 3625 **
- 3500/3491 *** ↓