
TECHNICAL ANALYSIS (by Intraday Dynamics)
Major Indices Week of November 17, 2023
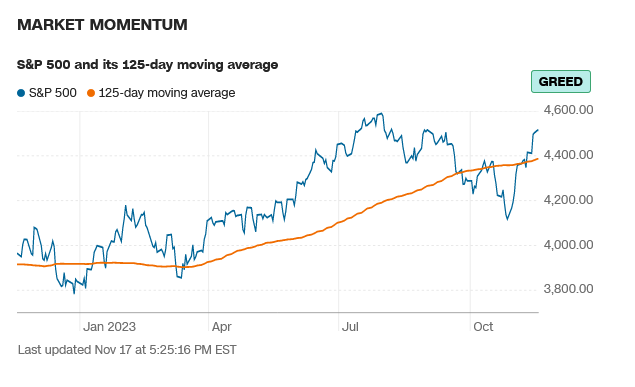
 Stocks moved higher for the third straight week with the previously lagging secondary market leading the way. The daily charts are reaching overbought conditions as sentiment averages out on the rally, with some indicators now edging into greed. Prices staged another massive gap in last week’s trade and there are two scenarios now. The first, and preferred, is that this three-week tear on the upside is a bona fide impulse wave that is the beginning of a new upside move for stocks. The second would be that last Tuesday’s gap may wind up being some form of exhaustion gap as prices bump up against the last major wave highs against the August tops. The Dow close on the 15th was the highest daily close since 15 August 2023 and the weekly is the highest since 7 August 2023. For the S&P, the daily close is the highest since 1 September 2023 and the highest weekly close since 1 September 2023. Note there is still one overhead gap on the S&P daily at 4550.93 through 4567.63. The S&P daily gapped above the downtrend line from the 2023 tops and is well above its 125-day MA…which translates to a greed reading. Time and price remain bullish, and the action last week adds fuel to the data.
52-Week A/D Line
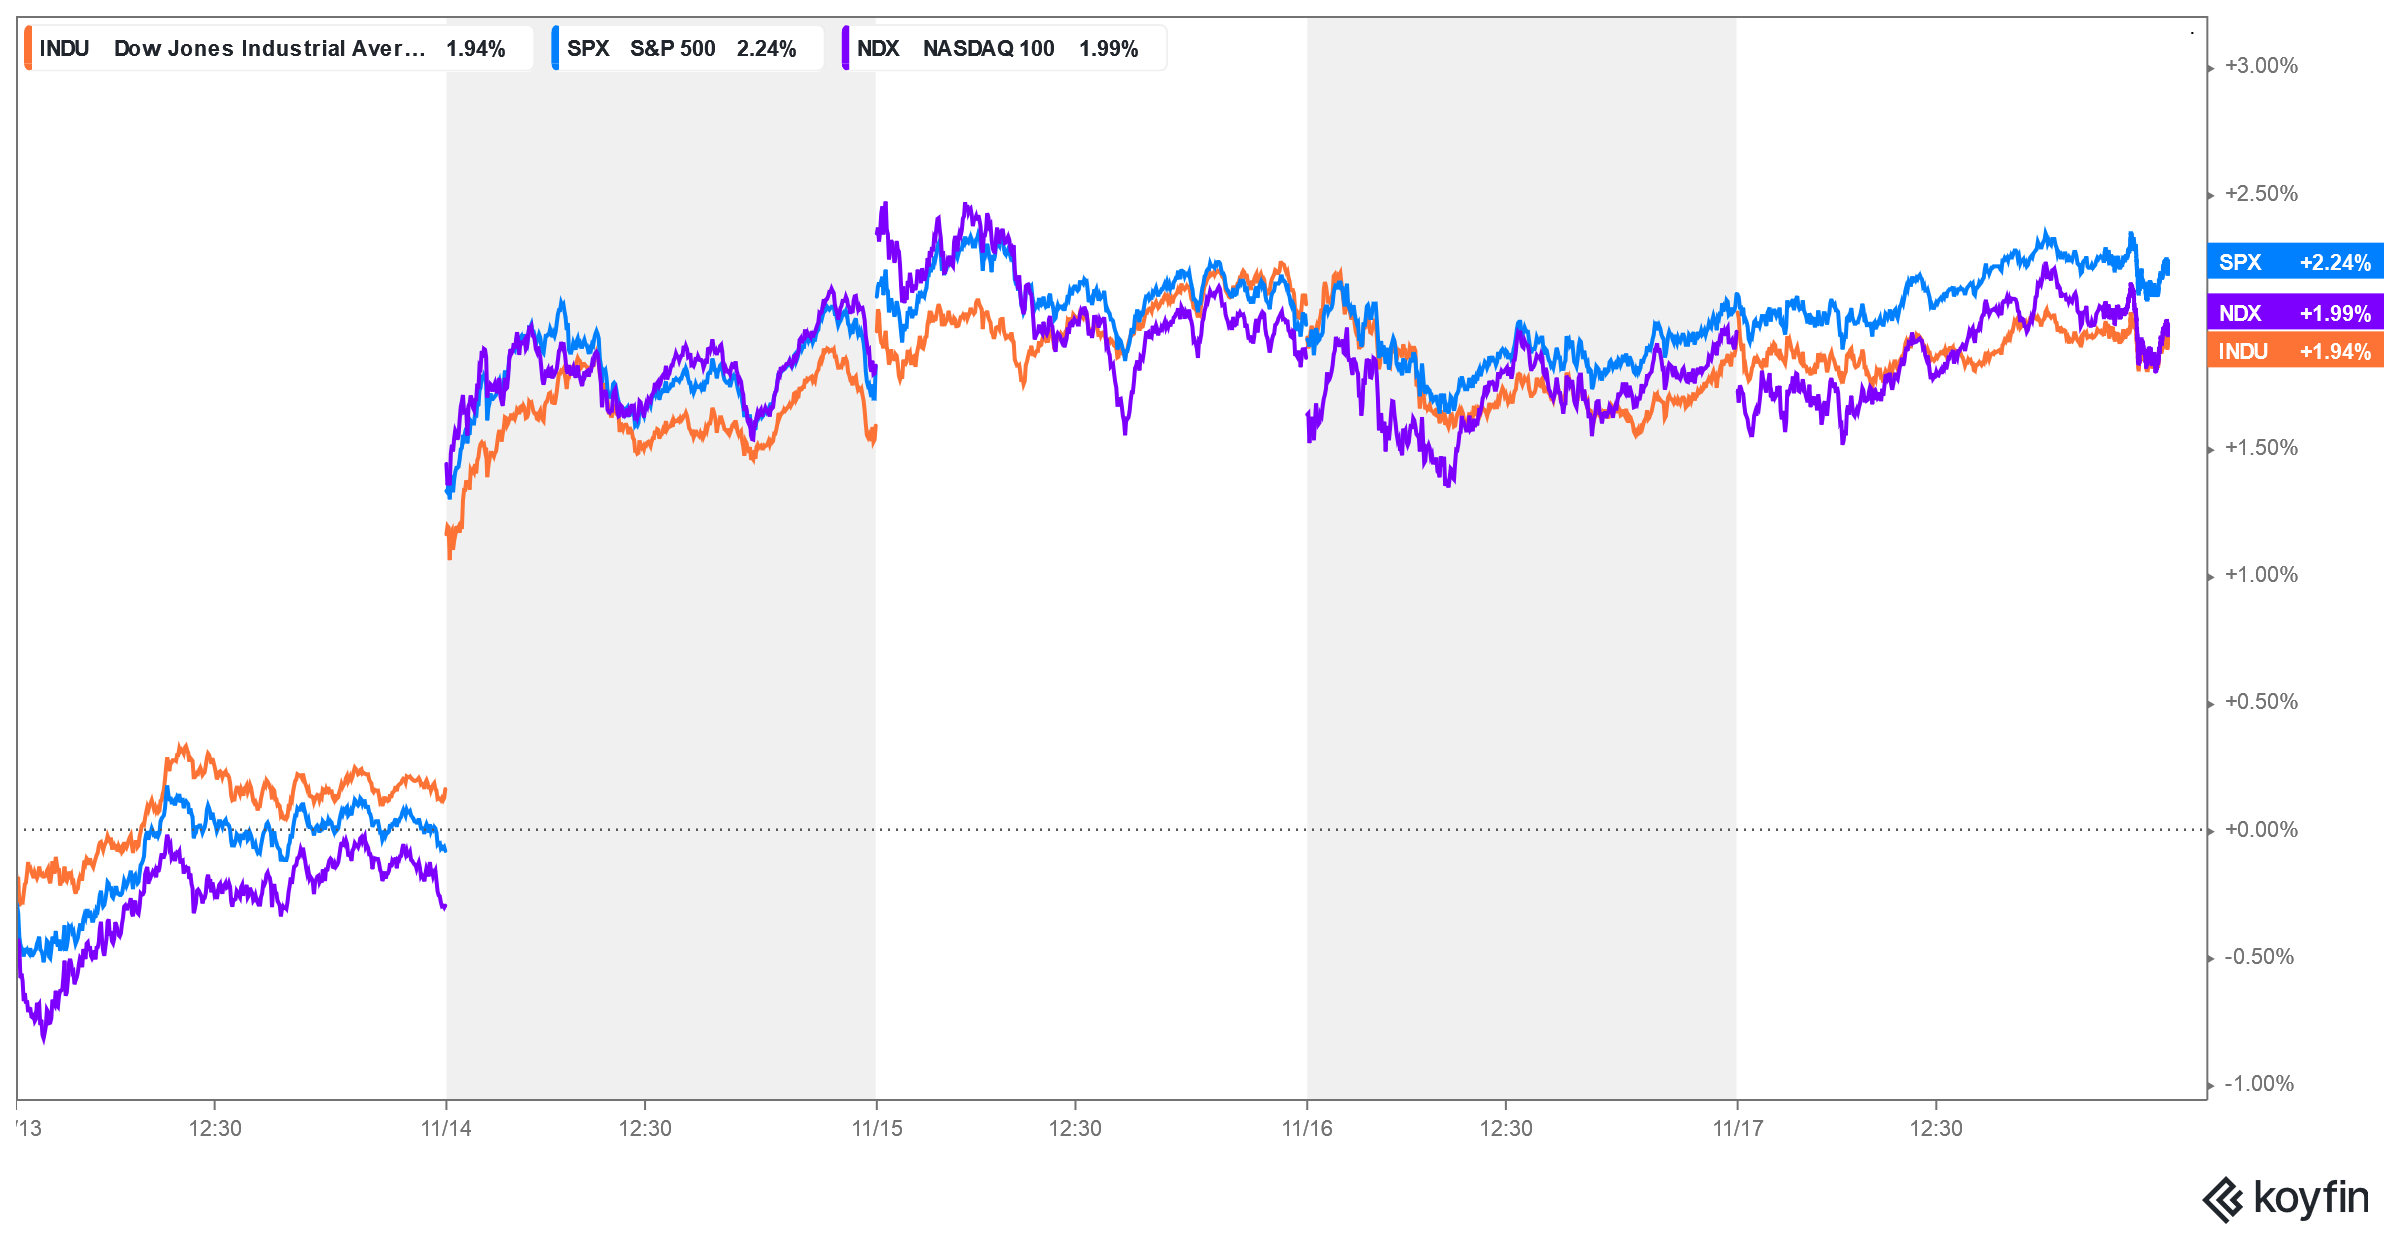
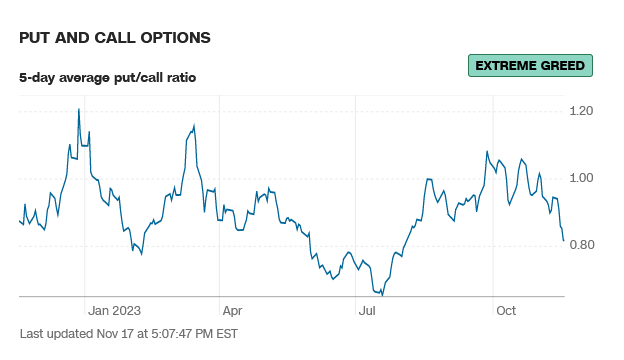
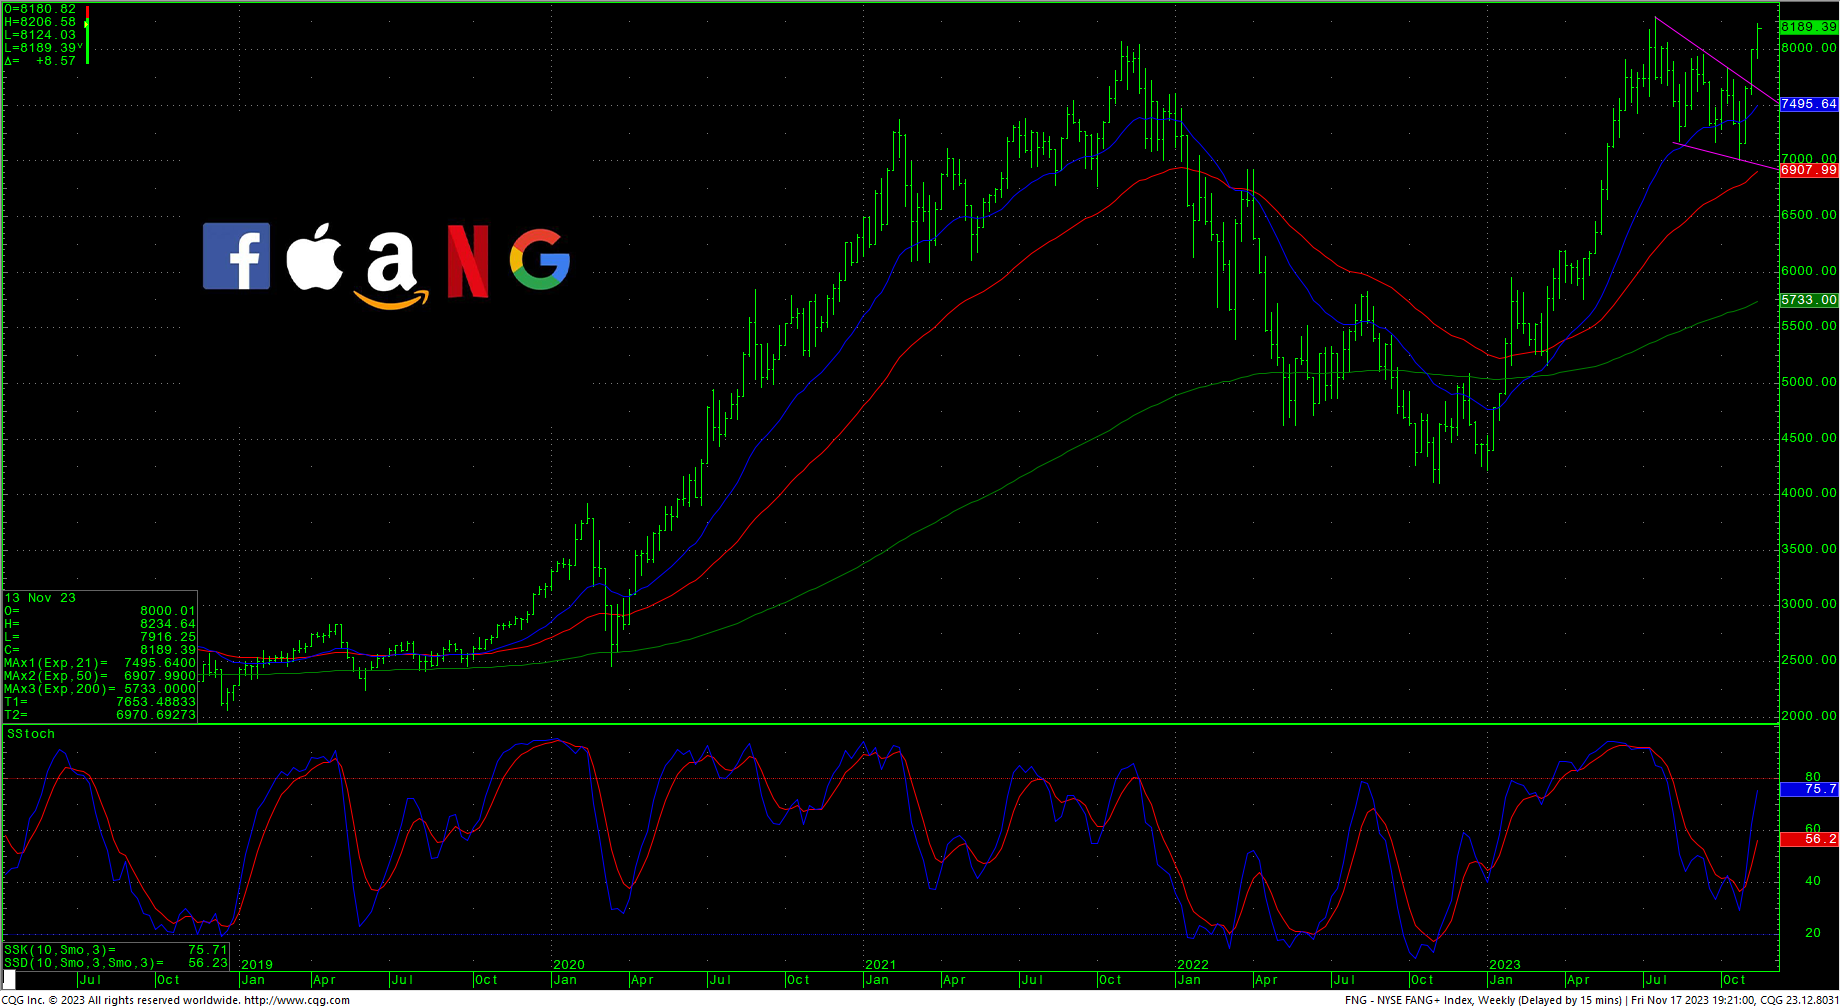
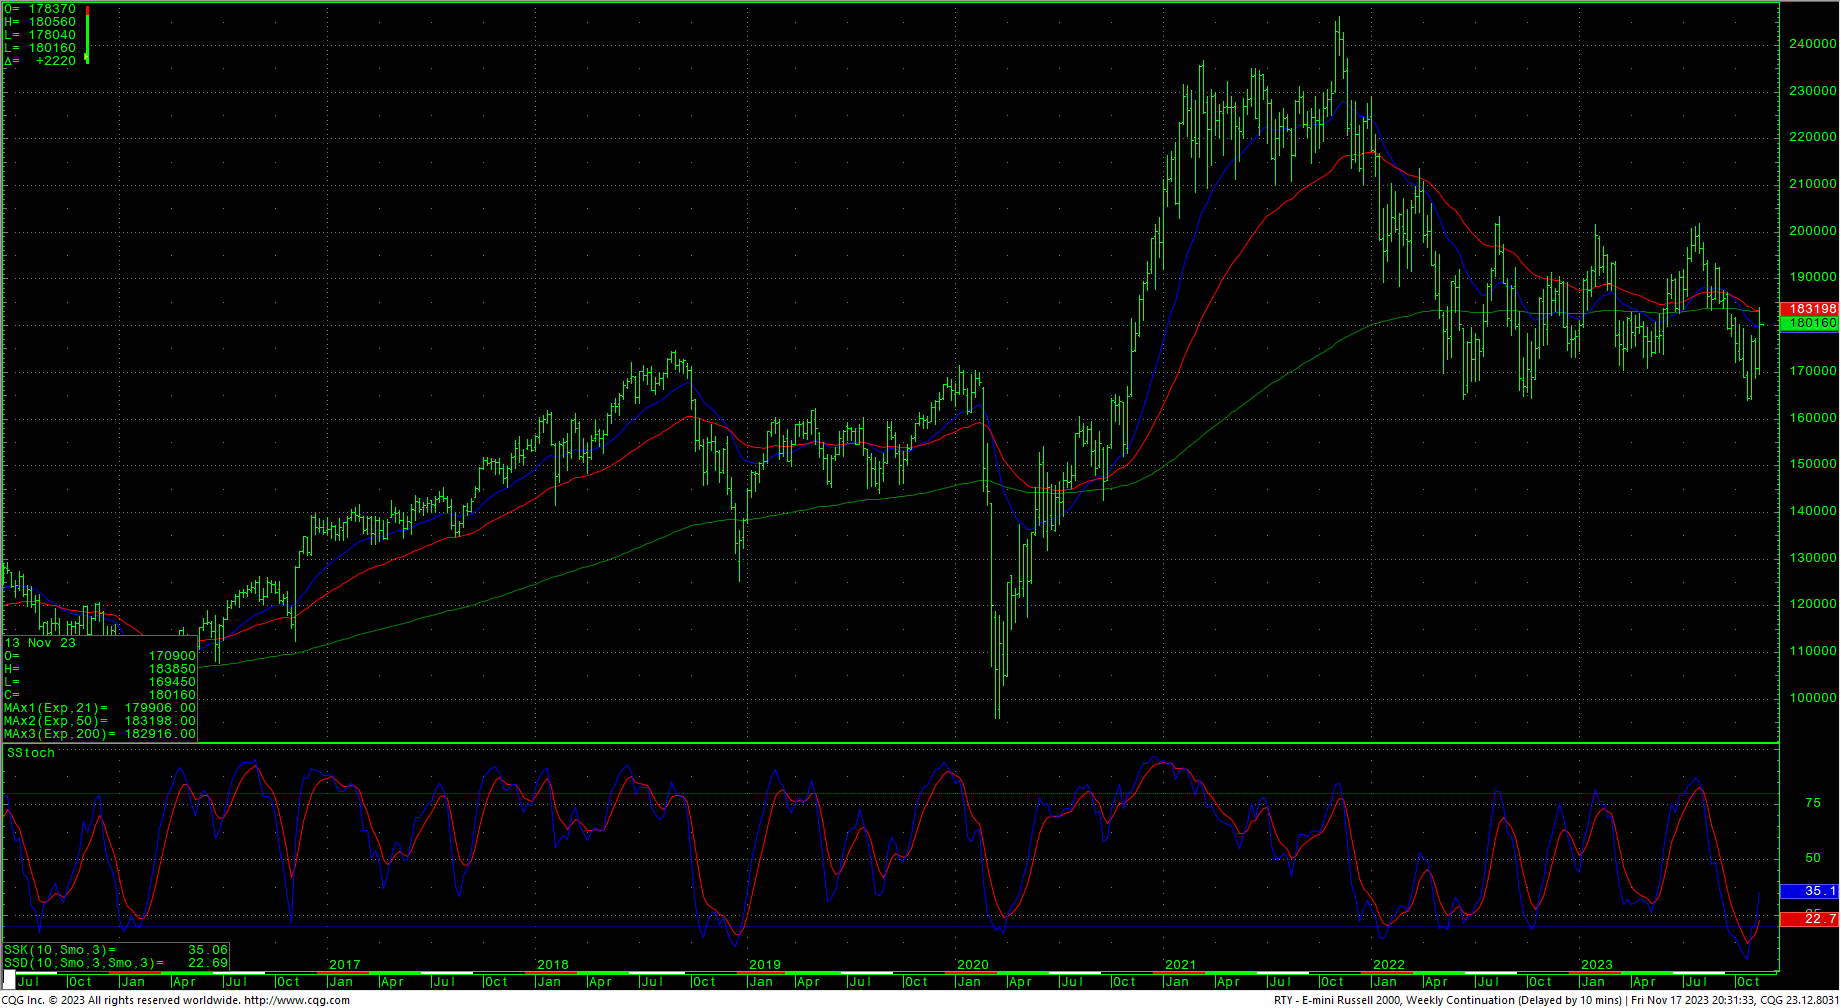
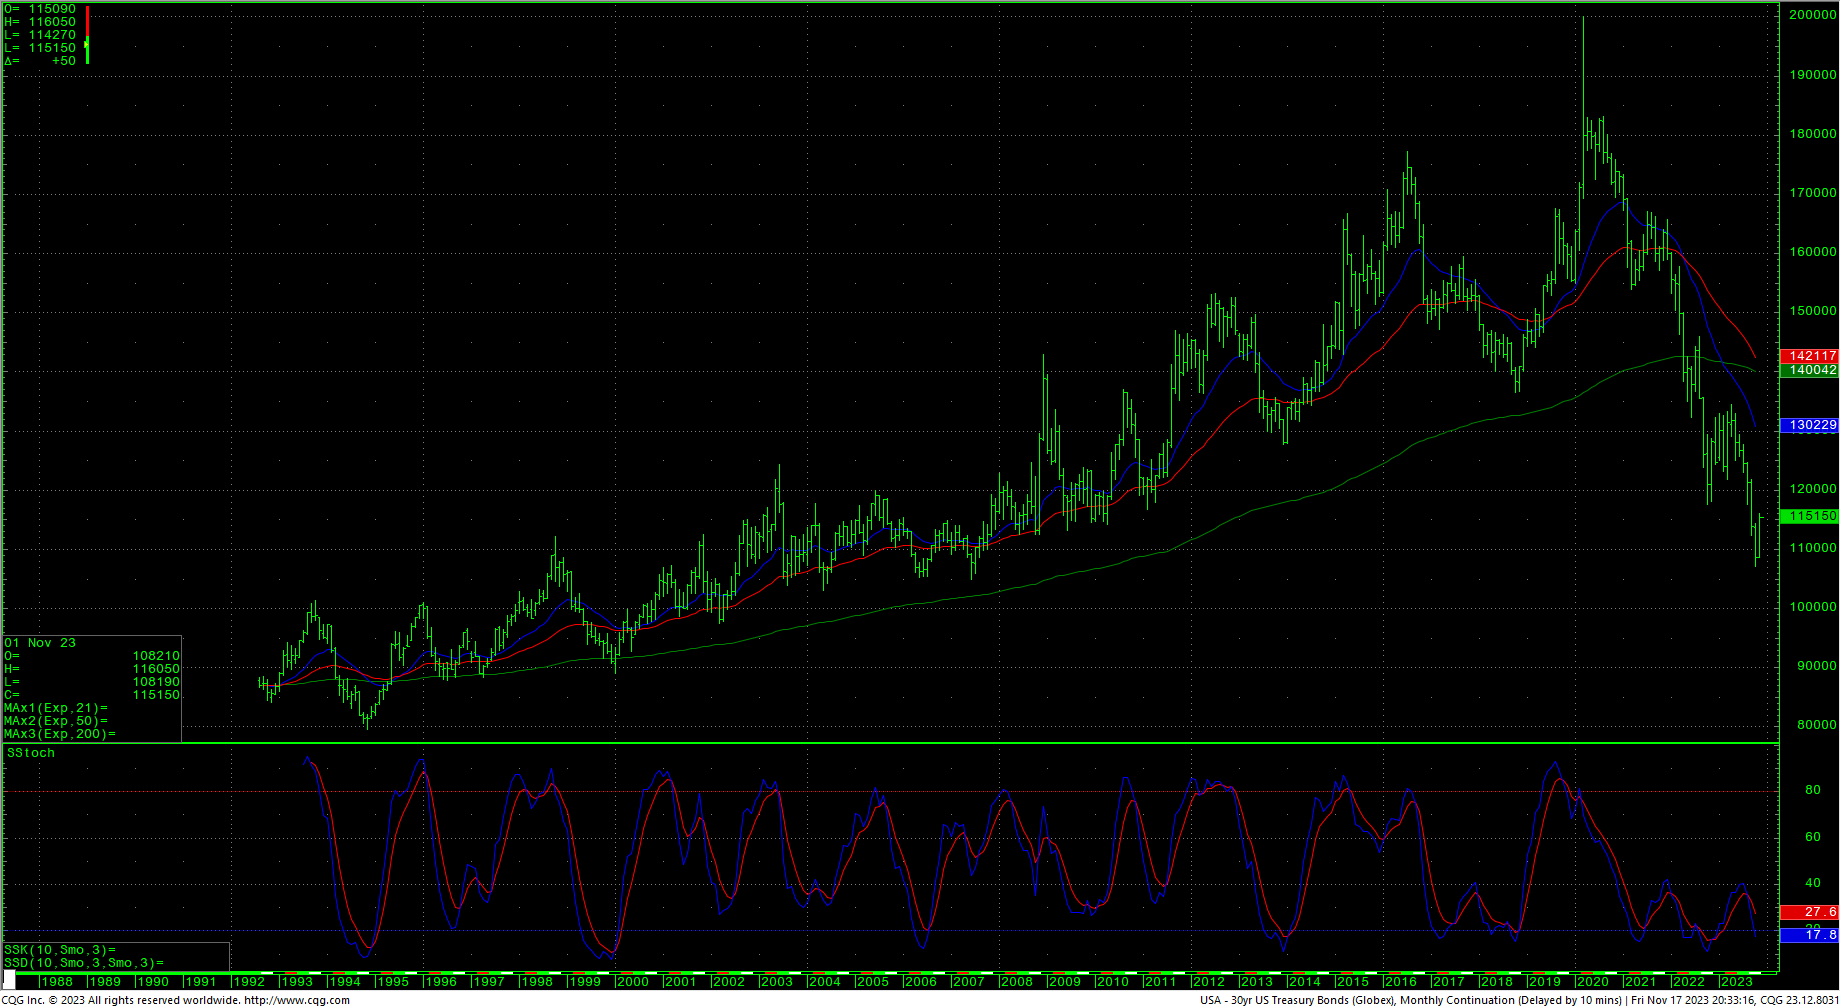
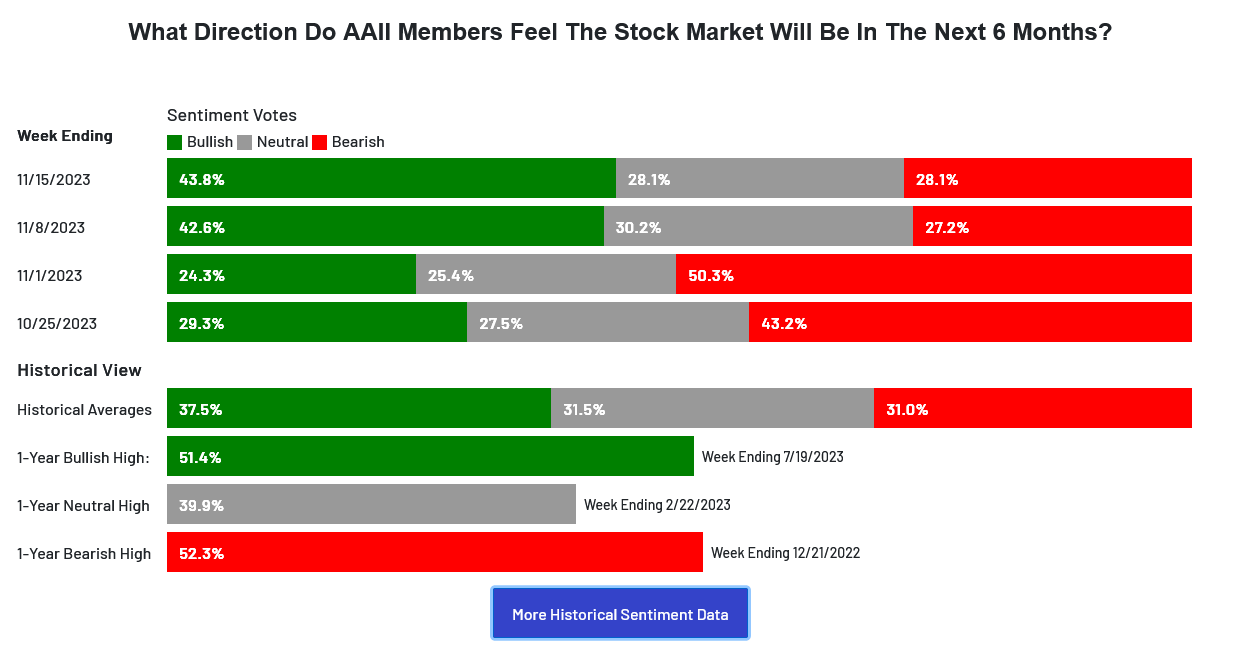
 As mentioned, sentiment has moved out of EXTREME FEAR on a number of readings. The AAII Sentiment: Saw Optimism Rising Again With Bearish Sentiment Also Rising. The VIX closed lower, at the lowest daily close since mid-September. The VIX also reflects the Put/Call ratio which moved back to 0.82 which reflects extreme greed. The 52-week, A/D moved higher to -3.53% which still indicates fear. The Dow closed the week up +1.94%. The S&P was up +2.24%. The Nasdaq ended the week up +2.37%, the FANG moved into a new all-time record high as that chart breaks out of a large bull flag pattern on the weekly, closing up +2.37% while the Russell led all the indices higher, closing up +5.42%. The bond market regained its strength last week as the fixed-income charts come off critical monthly support. The CRB was flat, closing up +0.21%, as crude oil was slightly lower and gold rallied back toward the recent tops. The CoT is showing some odd behavior right now. Commercials started nibbling again last week and speculators lowered inventory. Asset managers padded positions slightly in the past week. Timing-wise, last Friday marked critical timing, a window that could have seen some extreme volatility. Long-term readers understand that sometimes that volatility can follow the window immediately after. With the coming week being a ‘holiday’ week, this remains to be seen. The next timing is this Friday and is minor. Keep an eye on the tech-heavy stocks as they test record highs.
Timing Points
- 11/24 **
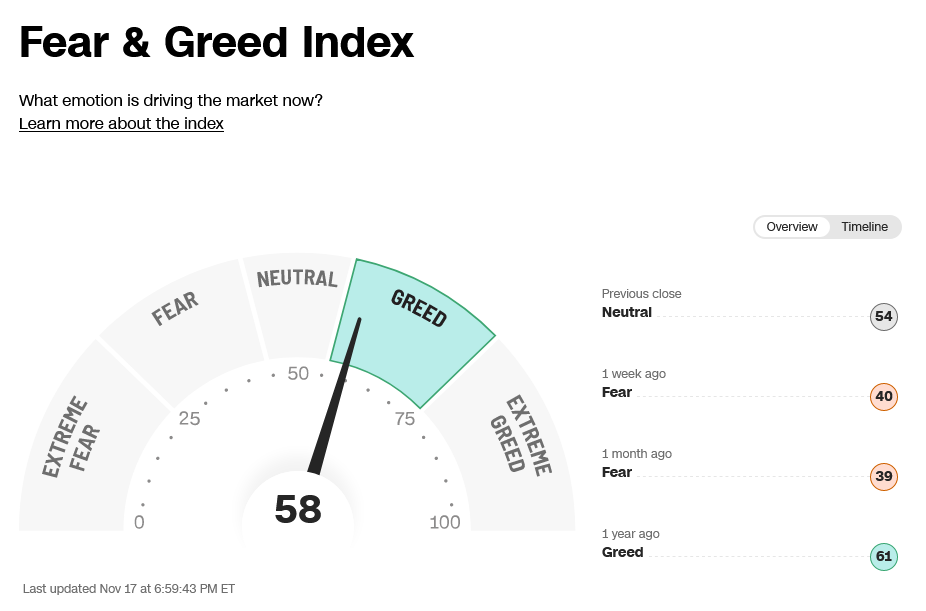
CNN Fear & Greed Index
AAII Investor Sentiment Survey
Dow Jones Industrial Average Hourly HLC
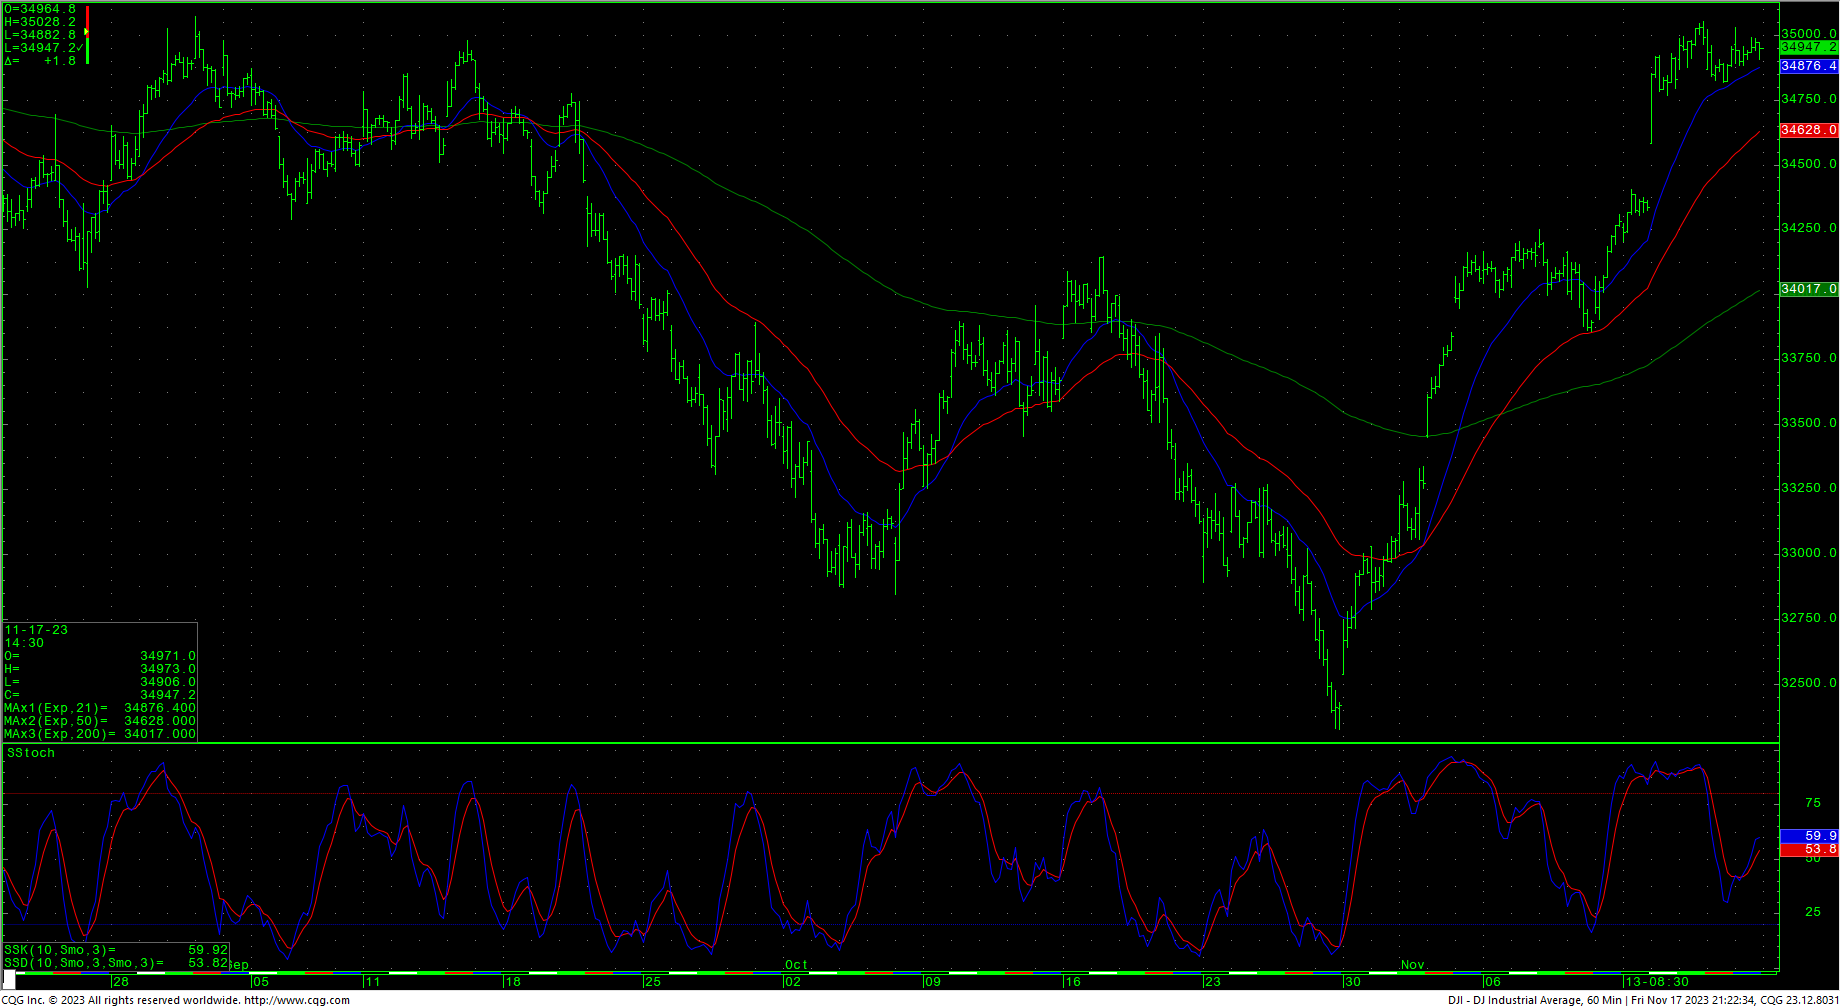
Dow hourly analysis: testing key elliot wave levels at 35070, support levels and breakdown scenarios.
The Dow hourly is neutral as Friday’s close. Prices are now testing long-term Elliot Wave levels against the August/September tops at 35070. This is a major technical level now for the Dow. A breakout with closes above 35070 set up a test of the trading highs at 35679 with intermediate counts to 35824 and longer-term counts into a gap area on the daily at 35996 to 36044. A breakout over 36044 sets up the 36513 area with potential to test the all-time record highs at 36952. Closes into new highs count toward long-term targets at 37095.
Support is at 34766, 34592, 34451, and 34310/34300. Closes under 34300 should test 34010. A breakdown under 34010 suggest a move to 33689 with counts into critical short-term support of 33367/33360. Closes below 33360 setup 33008/32970 with a shot at the 32337 area. Support is key at 32337 and intermediate-term against the 32170 level. That area represents a 50% retracement of the entire move from the 2022 lows to the 2023 highs. A breakdown with closes under 32170 is bearish and opens counts into the 31429 through 31341/31330 level with a target at 31665. Closes under 31330 in the Dow will open potential to 29806 through 28660 with support at 30415 and 30317.
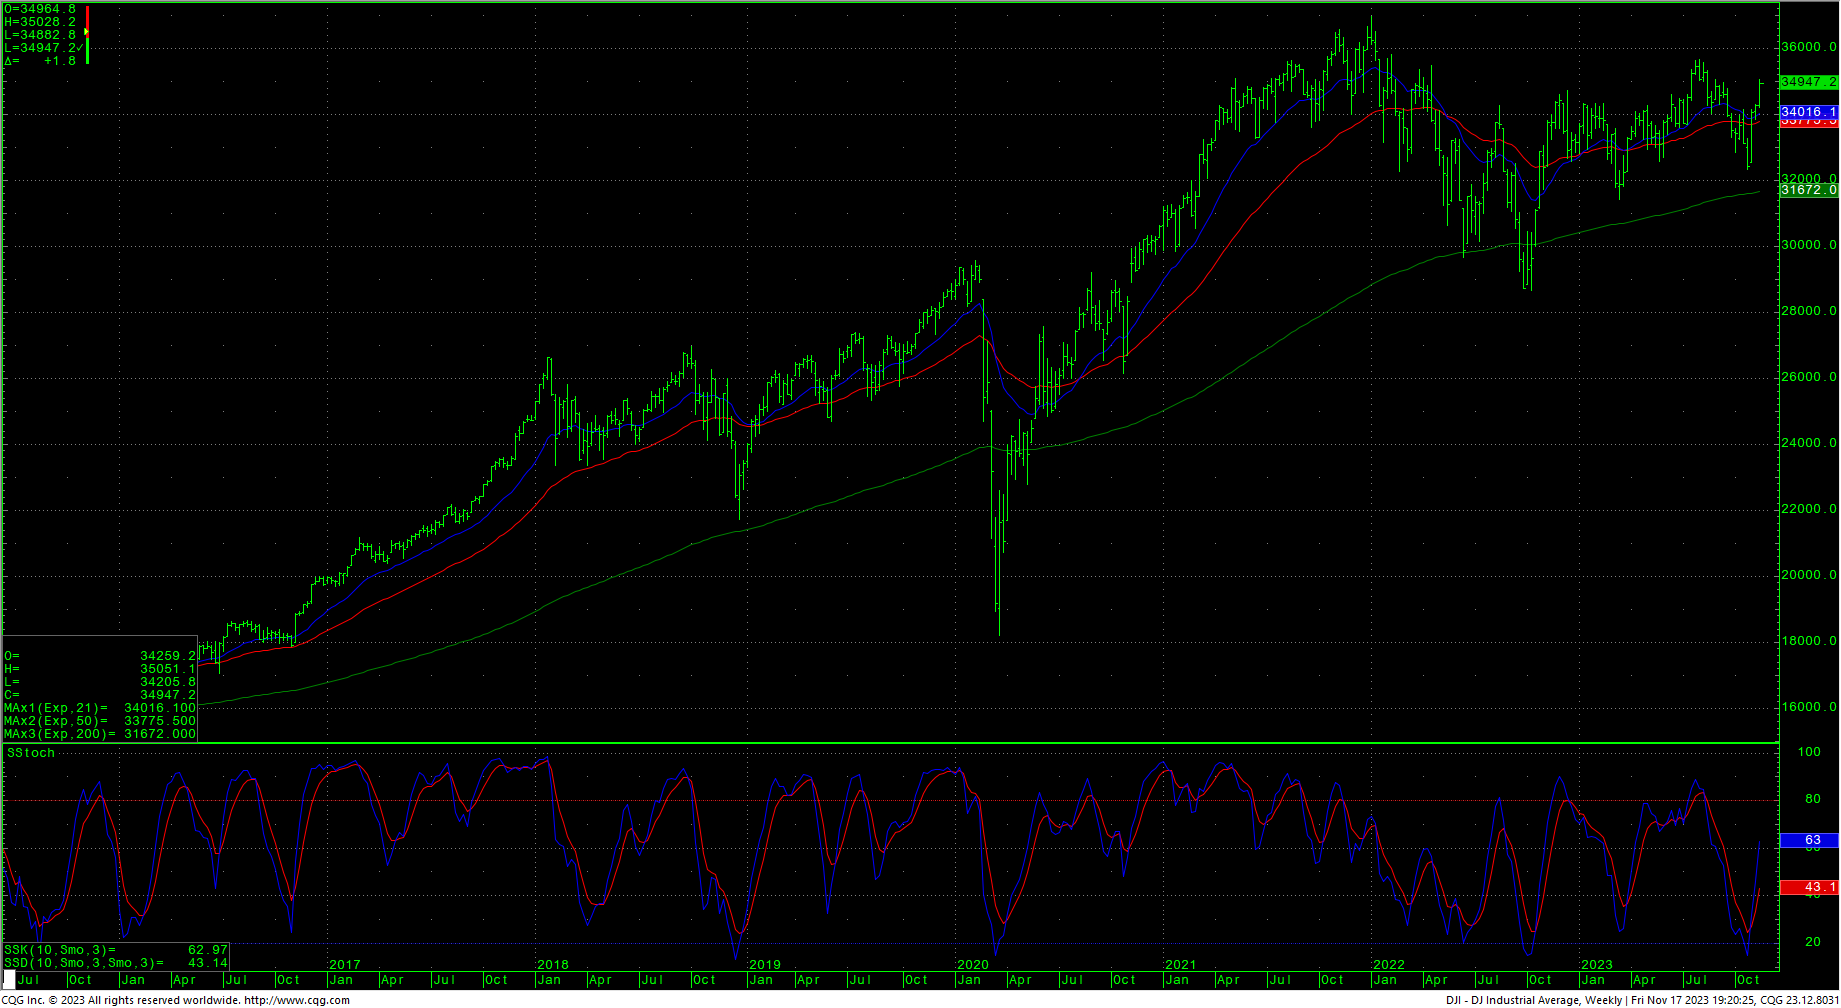
Dow Jones Industrial Average Weekly HLC
Resistance
- 35026 ** ↑
- 35070 *** ↑
- 35246/35270 *** ↑
- 35354 ** ↑
- 35432 **
- 35578 ** ↑
- 35670 *** ↑
- 35800/35824 *** ↑
- 35996 ***
- 36044 *** ↑
- 36271 **
- 36390 **
- 36513 ***↑
- 36636 **
- 36934/36952 *** ↑
- 37095/37096 *** ↑
Support
- 34882 **
- 34766 **
- 34592 ***
- 34451 *** ↓
- 34310/34300 *** ↓
- 34203 **
- 34135 **
- 34010 *** ↓
- 33905 **
- 33852/33842 ** fills gap ↓
- 33730 **
- 33600 **
- 33367/33360 *** ↓
- 33450 *** ↓ gap
- 33337 ** fills gap
- 33318 *** ↓
- 33245 ***
- 33075 **
- 32900 **
- 32760 **
- 32650 **
- 32537 ** hourly gap
- 32430 ** fills hourly gap
- 32327 *** ↓
S&P 500 Cash Index
S&P 500 Index Daily HLC
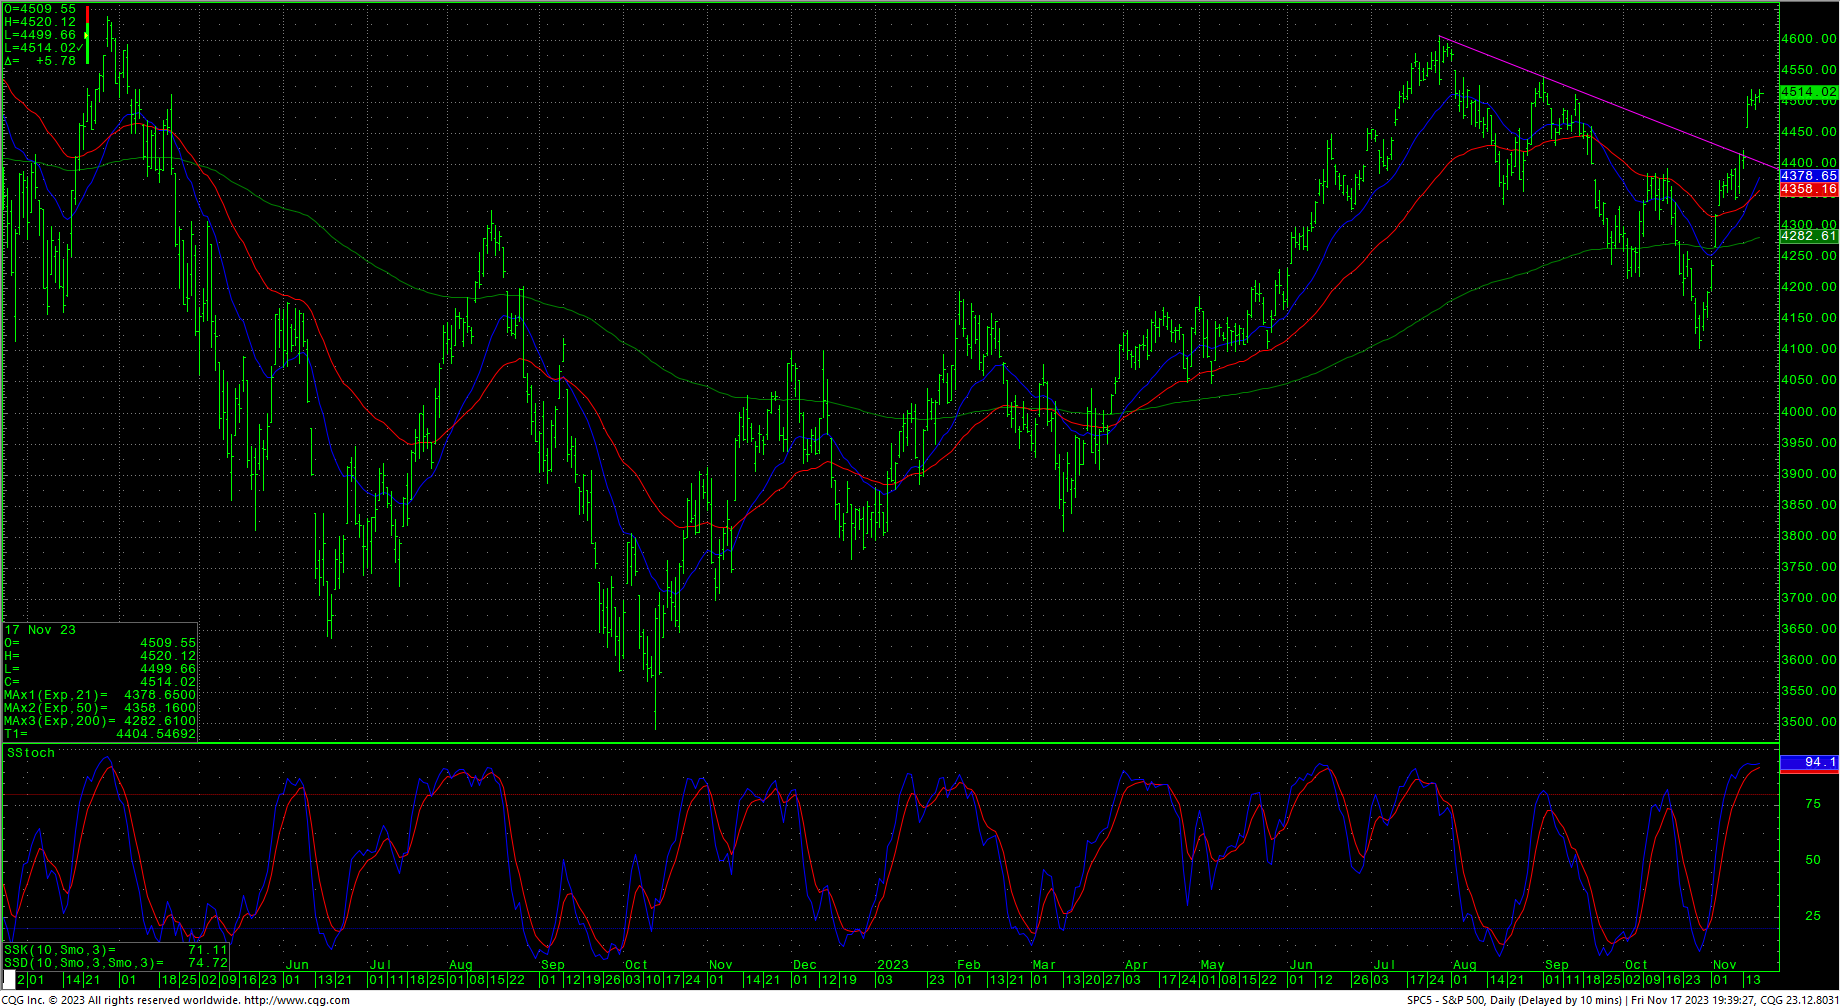
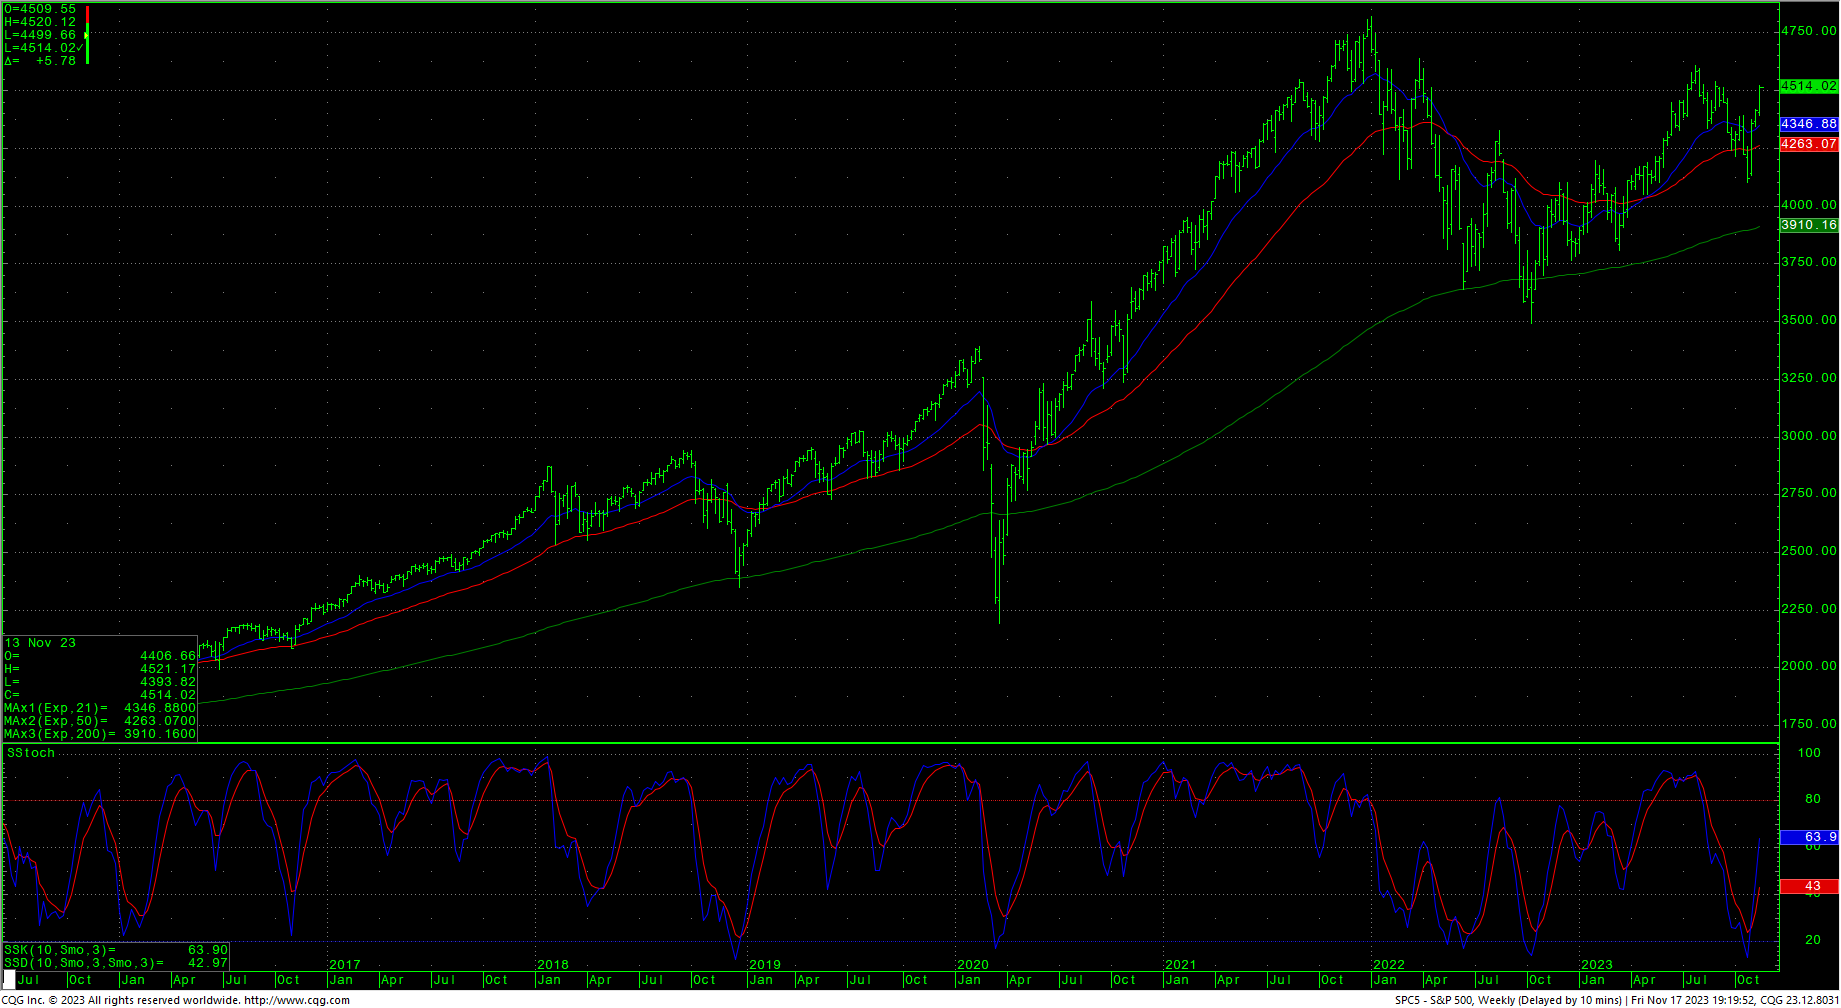
The S&P hourly is neutral with the daily reaching some overbought conditions. As mentioned above, the daily staged a decisive breakout above the downtrend line with prices now well above both the 125-day and 200-day moving averages. The 21-day MA hooked back over the 50-day after taking it out in late September. Prices tested and closed into major wave resistance 4515. A continued breakout with closes over 4515 is friendly and sets up a move to 4607. Closes above suggest a minimal test of 4637. A breakout with closes above 4637 opens potential toward 4748 and ultimately 4818. Above the record highs opens counts to 4952/5000 with potential to 5144.
Support is at 4479, 4453, 4432 and pivotal near-term at 4411/4408. A breakdown under 4408 should test 4361. Closes under 4361 should carry to 4312 with counts to 4270/4260. A breakdown under 4260 can test 4220. Daily closes under 4220 set up a retest of the 4049 area. Daily closes under 4049 open counts to critical long-term support of 3917/3910. Daily closes below 3910 open counts to 3815 and 3770/3754 with potential to monthly support at 3505/3491. A move under 3491 is bearish and opens counts to 3195/3185.
S&P 500 Index Weekly HLC
Resistance
- 4515 *** ↑
- 4527 **
- 4541 *** ↑
- 4550 ** gap
- 4567 ** fills gap
- 4575 *** ↑
- 4593 **
- 4607 *** ↑
- 4637 *** ↑
- 4665 **
- 4748 *** ↑
- 4818 *** ↑
- 4826 **
- 4849/4850 *** ↑
- 4952 ***↑
- 5000 *** ↑
- 5072 **
- 5144 *** ↑
Support
- 4499 **
- 4479 **
- 4453 ***
- 4432 *** ↓
- 4411/4408 *** ↓
- 4389 **
- 4361 *** ↓
- 4343 **
- 4334 ** gap
- 4319 ** fills gap
- 4312 *** ↓
- 4297 ** ↓
- 4270/4260 *** gap ↓
- 4238 **
- 4220 *** ↓
- 4195 *** ↓ hourly gap
- 4103 **
- 4049 *** ↓
- 3917/3910 *** ↓
- 3875 **
- 3754/3750 *** ↓
- 3625 **
- 3500/3491 *** ↓
*Note: There will be no technical update next weekend. Have a Happy Thanksgiving!