TECHNICAL ANALYSIS (by Intraday Dynamics)
Major Indices Week of December 1, 2023
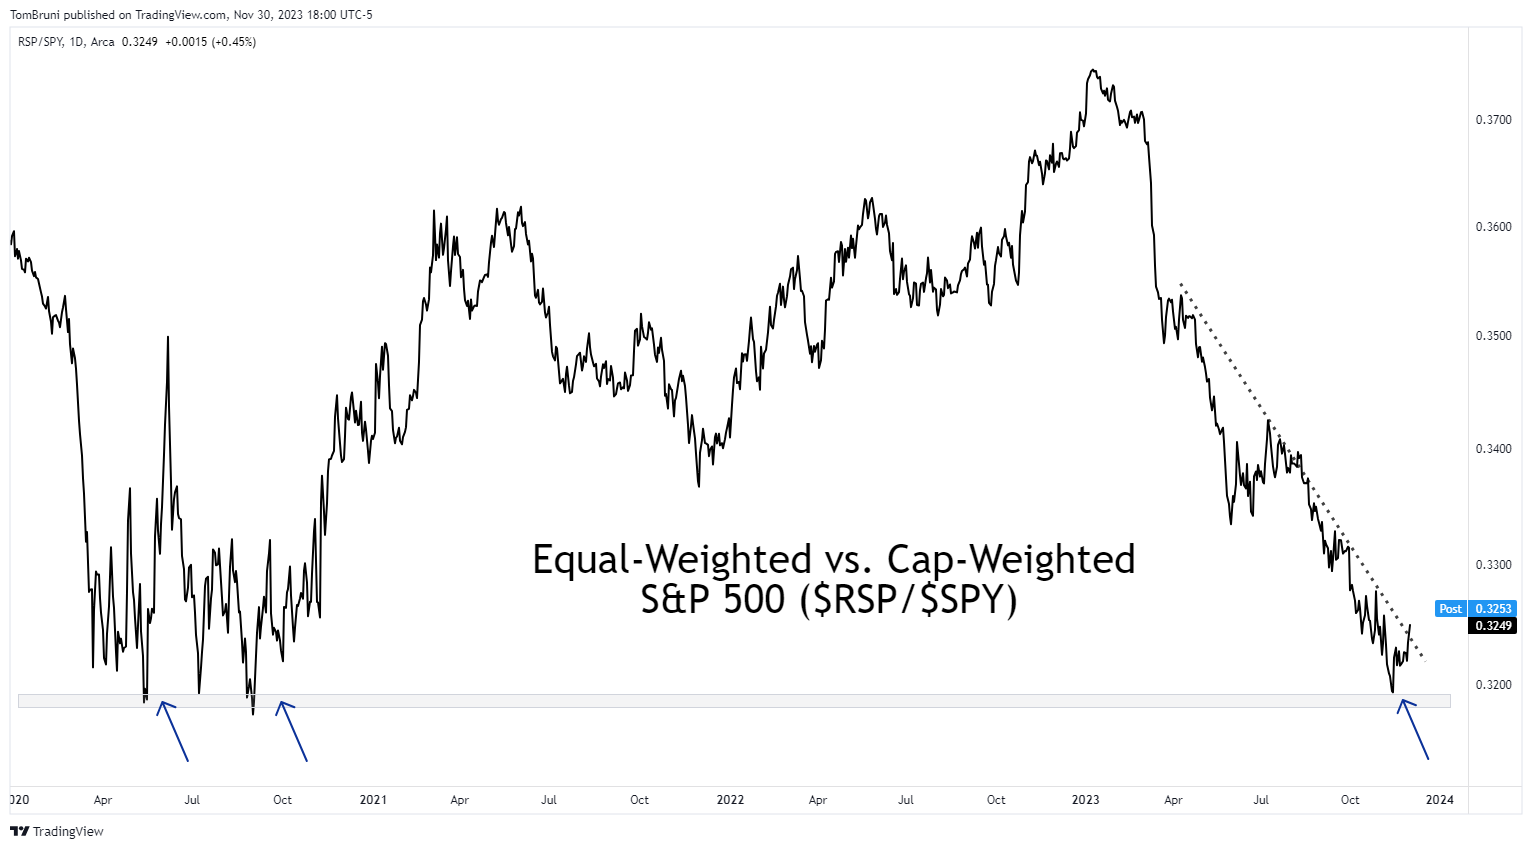
Stocks continued their four-week tear on the upside with both the Dow and S&P reaching new highs for 2023. The market closed out a “No Sell November” with massive monthly gains across the board and there is now a potential shift in logic occurring based on both the technicals and shifting sentiment. As was pointed out in the past few updates, the move off the last lows appeared to “the start of a bona fide impulse wave that is the beginning of a new upside move for stocks.” Now, there are two charts that are critical to the market as prices test all-time record highs. The first is the ratio between the large cap and small cap stocks and the second is Equal-Weighted versus the Cap-Weighted stocks (RSP-SPY).
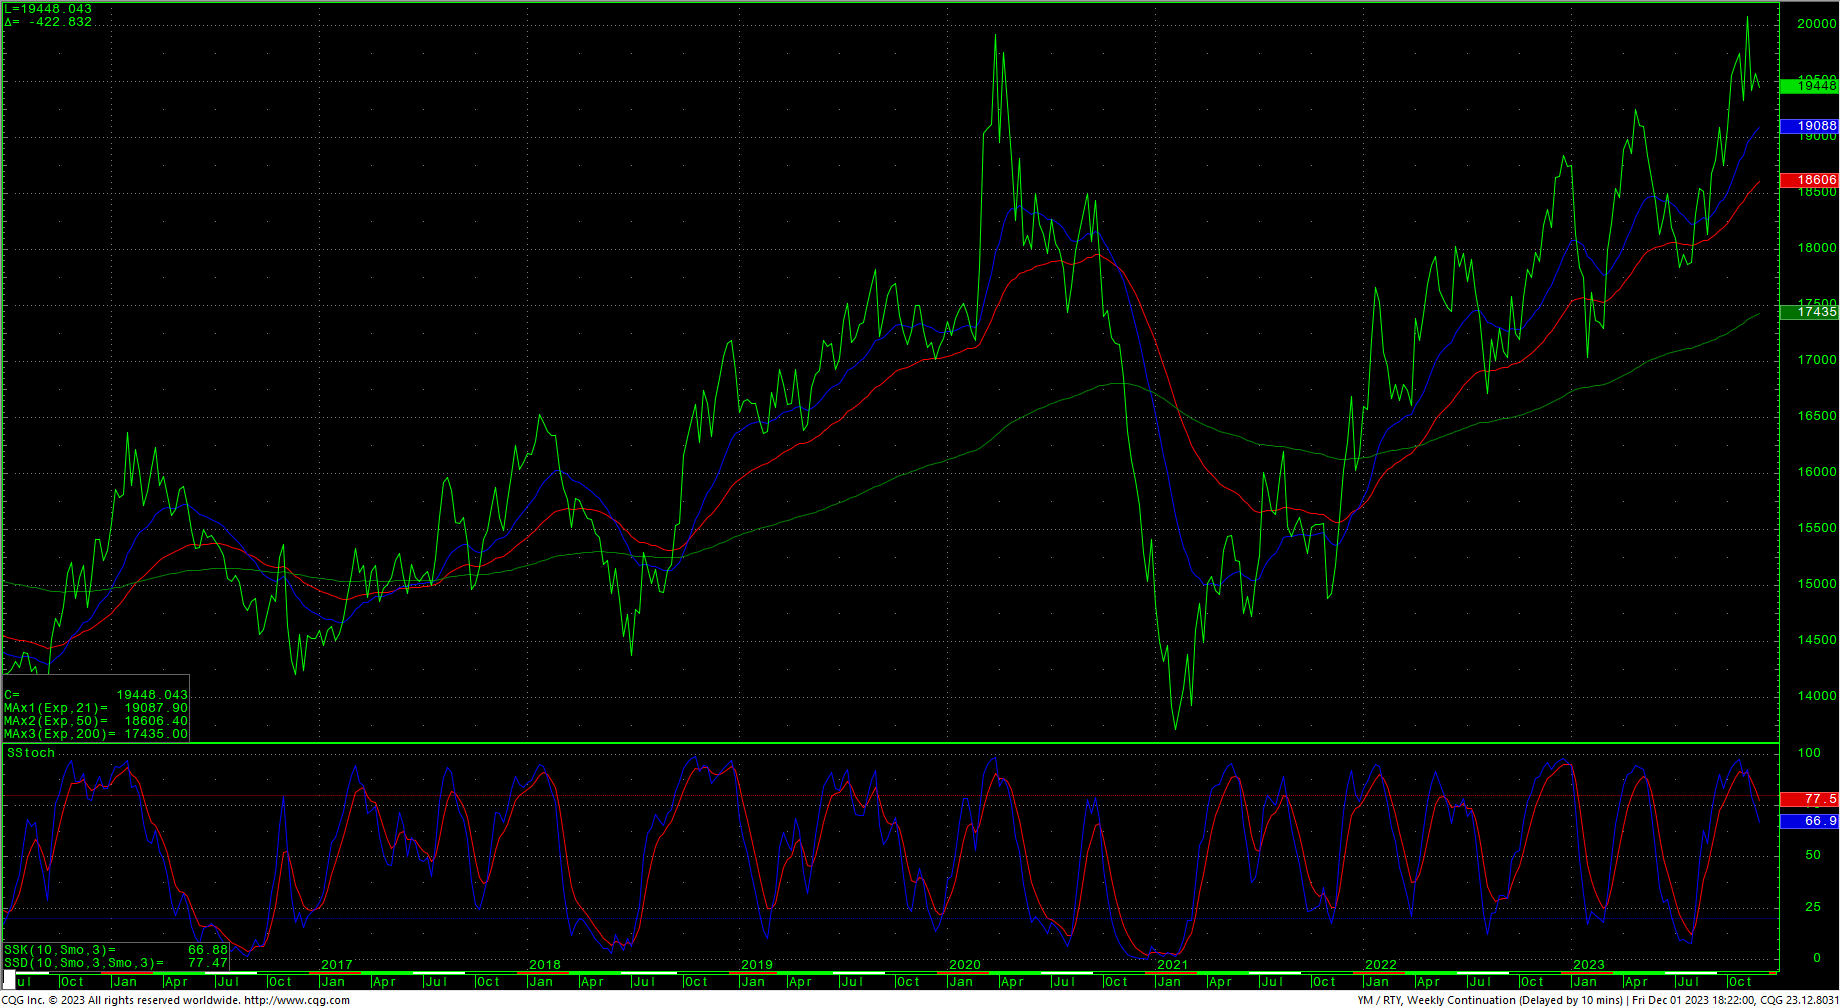
Spot Dow Futures/Spot Russell Futures Weekly
RSP/SPY
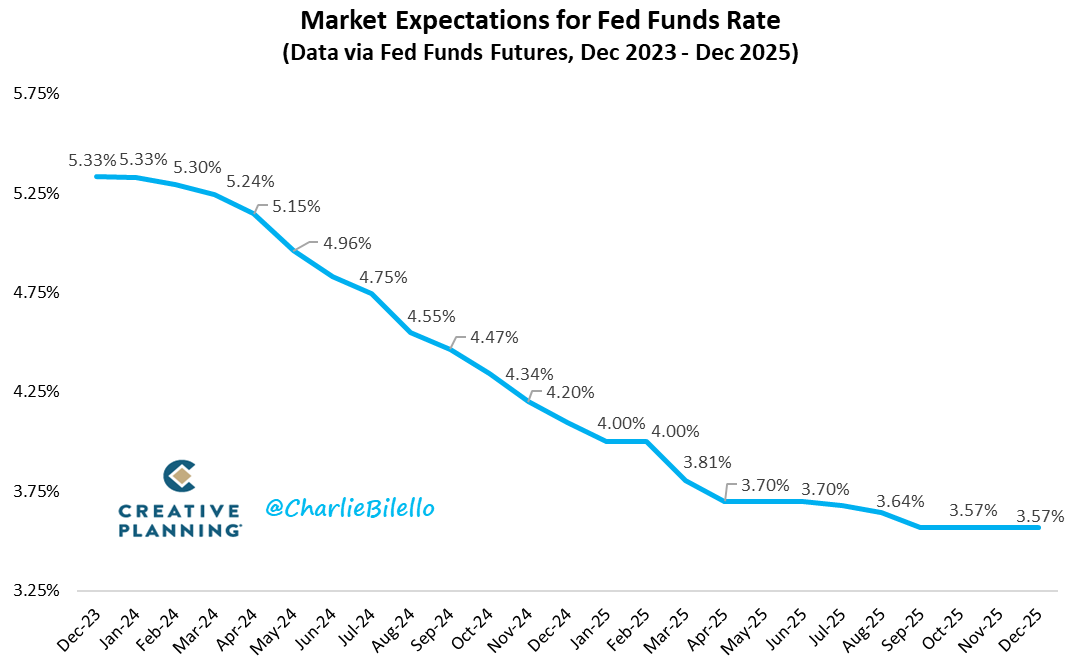
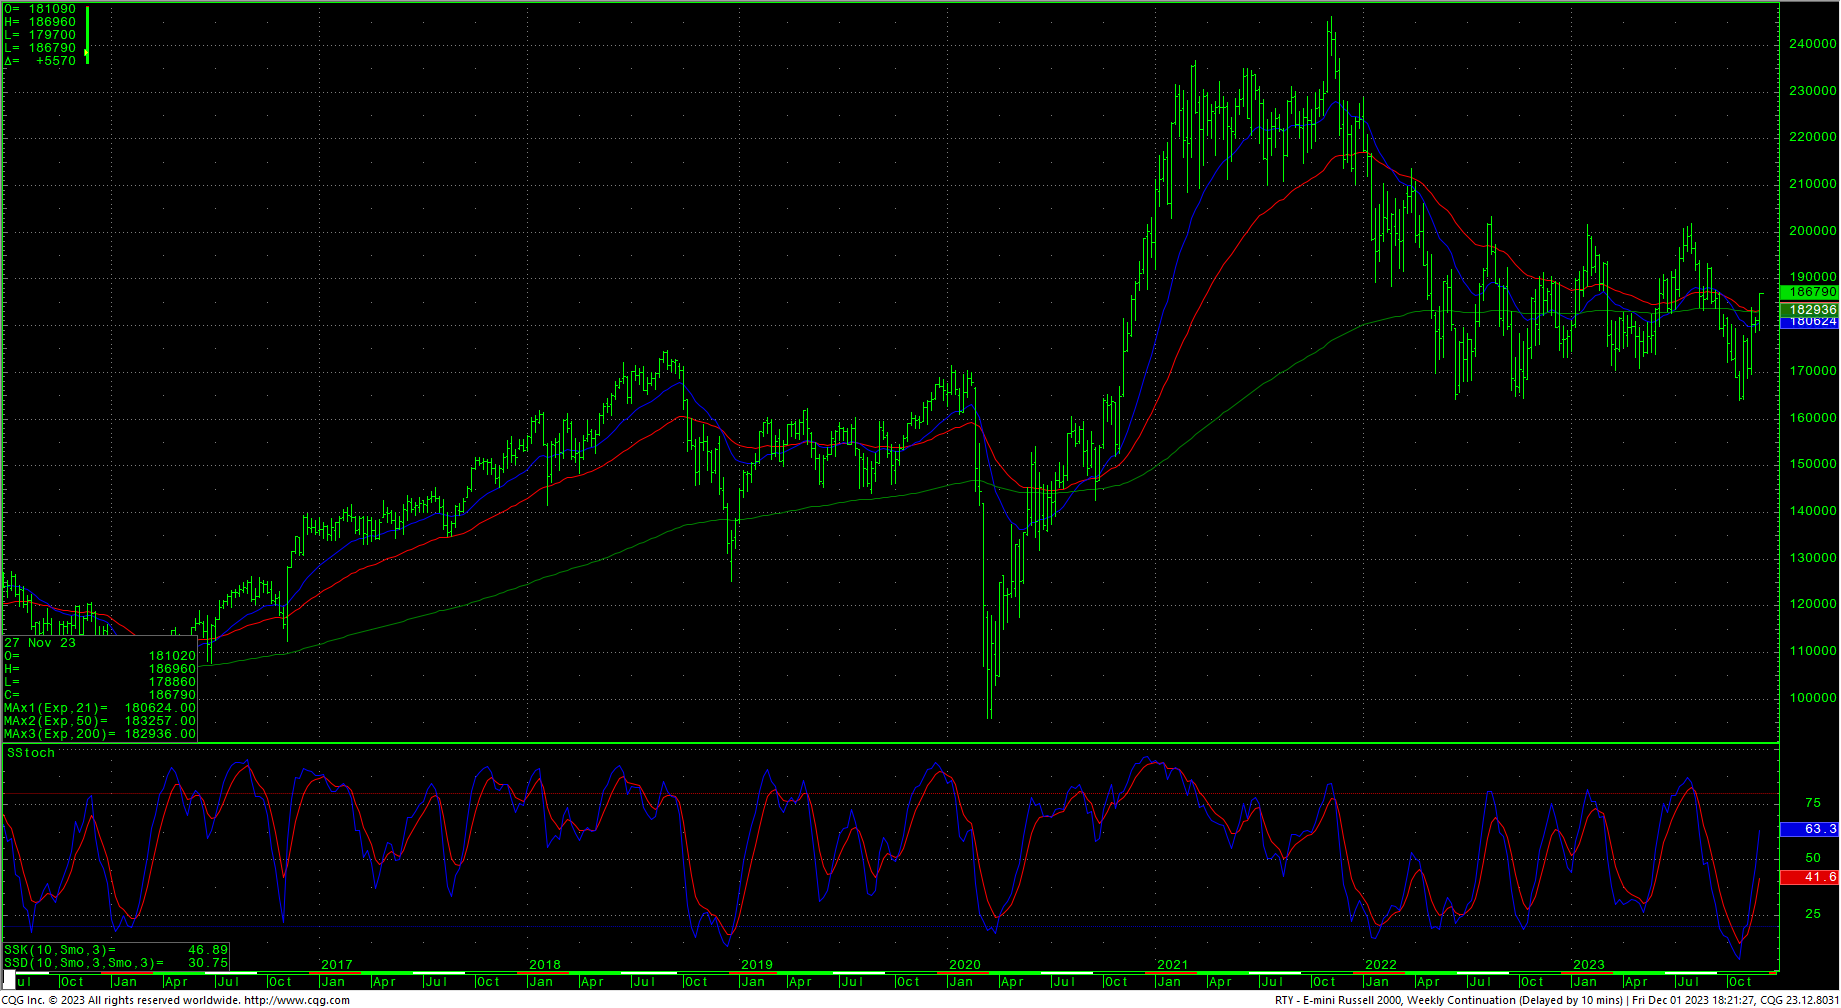
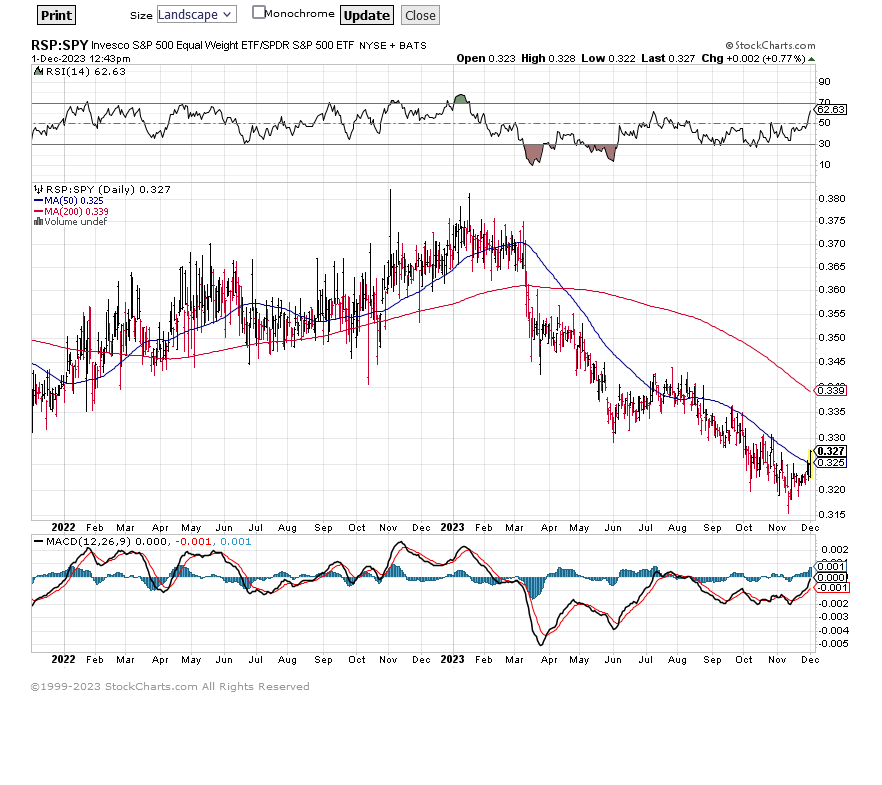 The Dow/Russell chart is moving off a record high as the secondary market starts to heat up. The RSP/SPY is just starting to come off lows that were reached in late 2020. As sentiment heats up on the rally, the question now is whether we are about to see a shift toward secondary/small caps as leaders in the overall market…or will sentiment get overblown? Some of the bullish sentiment is justified as small cap earnings have been beating expectations over the past month and a half. The other is that there is sentiment growing that interest rates will be lowering in 2024. That second part may well be a total fantasy…but odds makers are giving 65% lean that rates will be lowered as early as Spring of 2024. See this chart from analyst. Charlie Bilello.
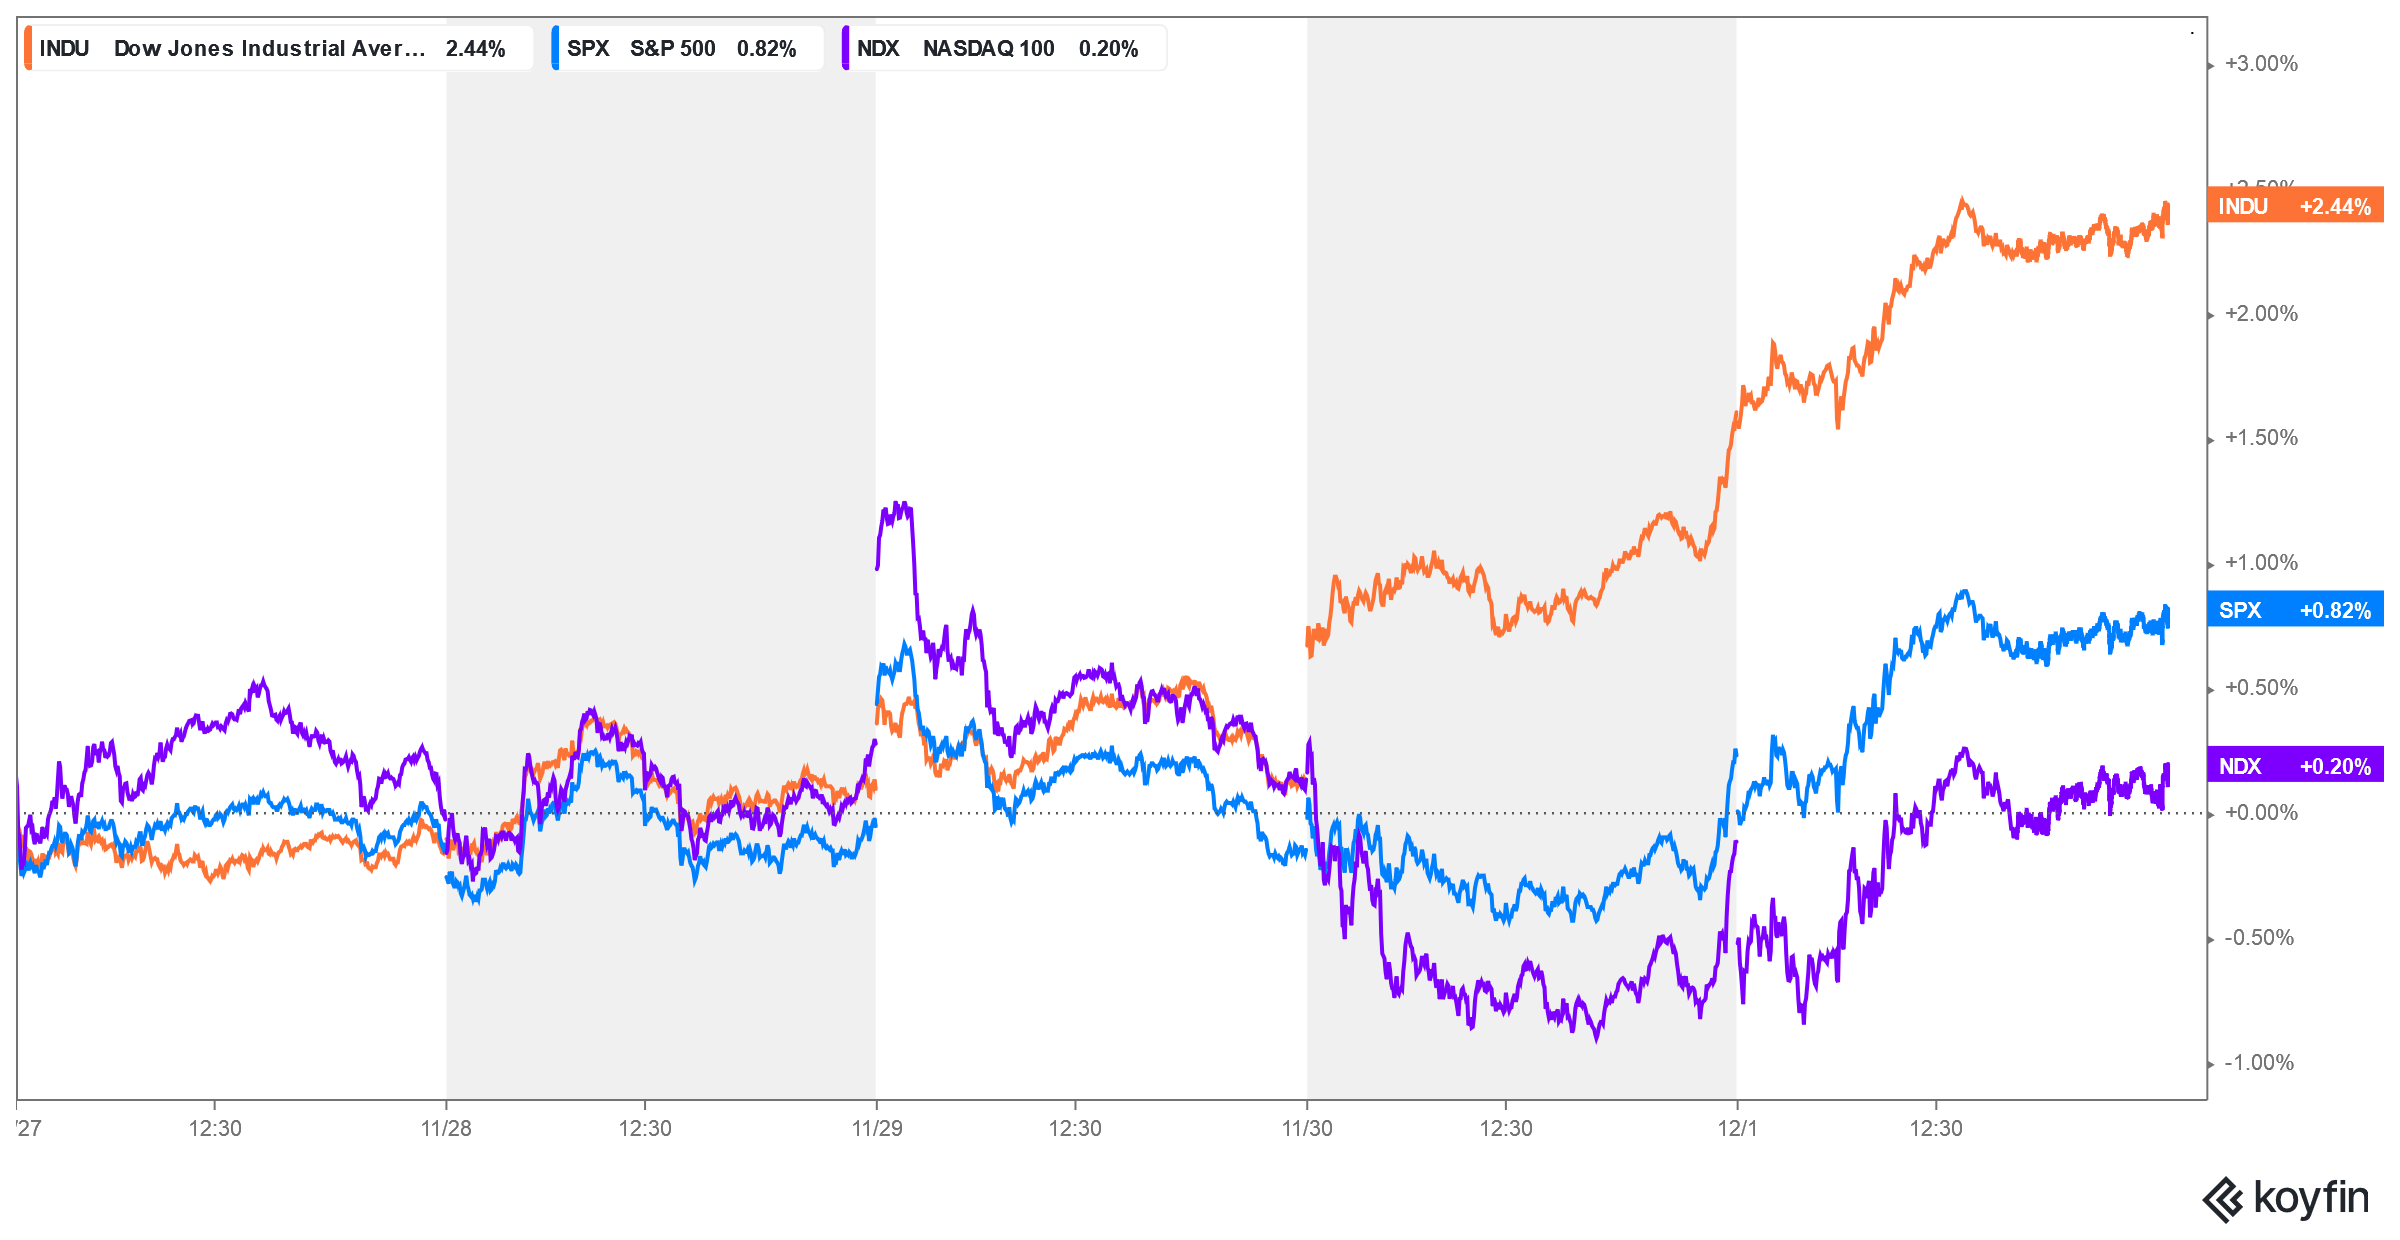
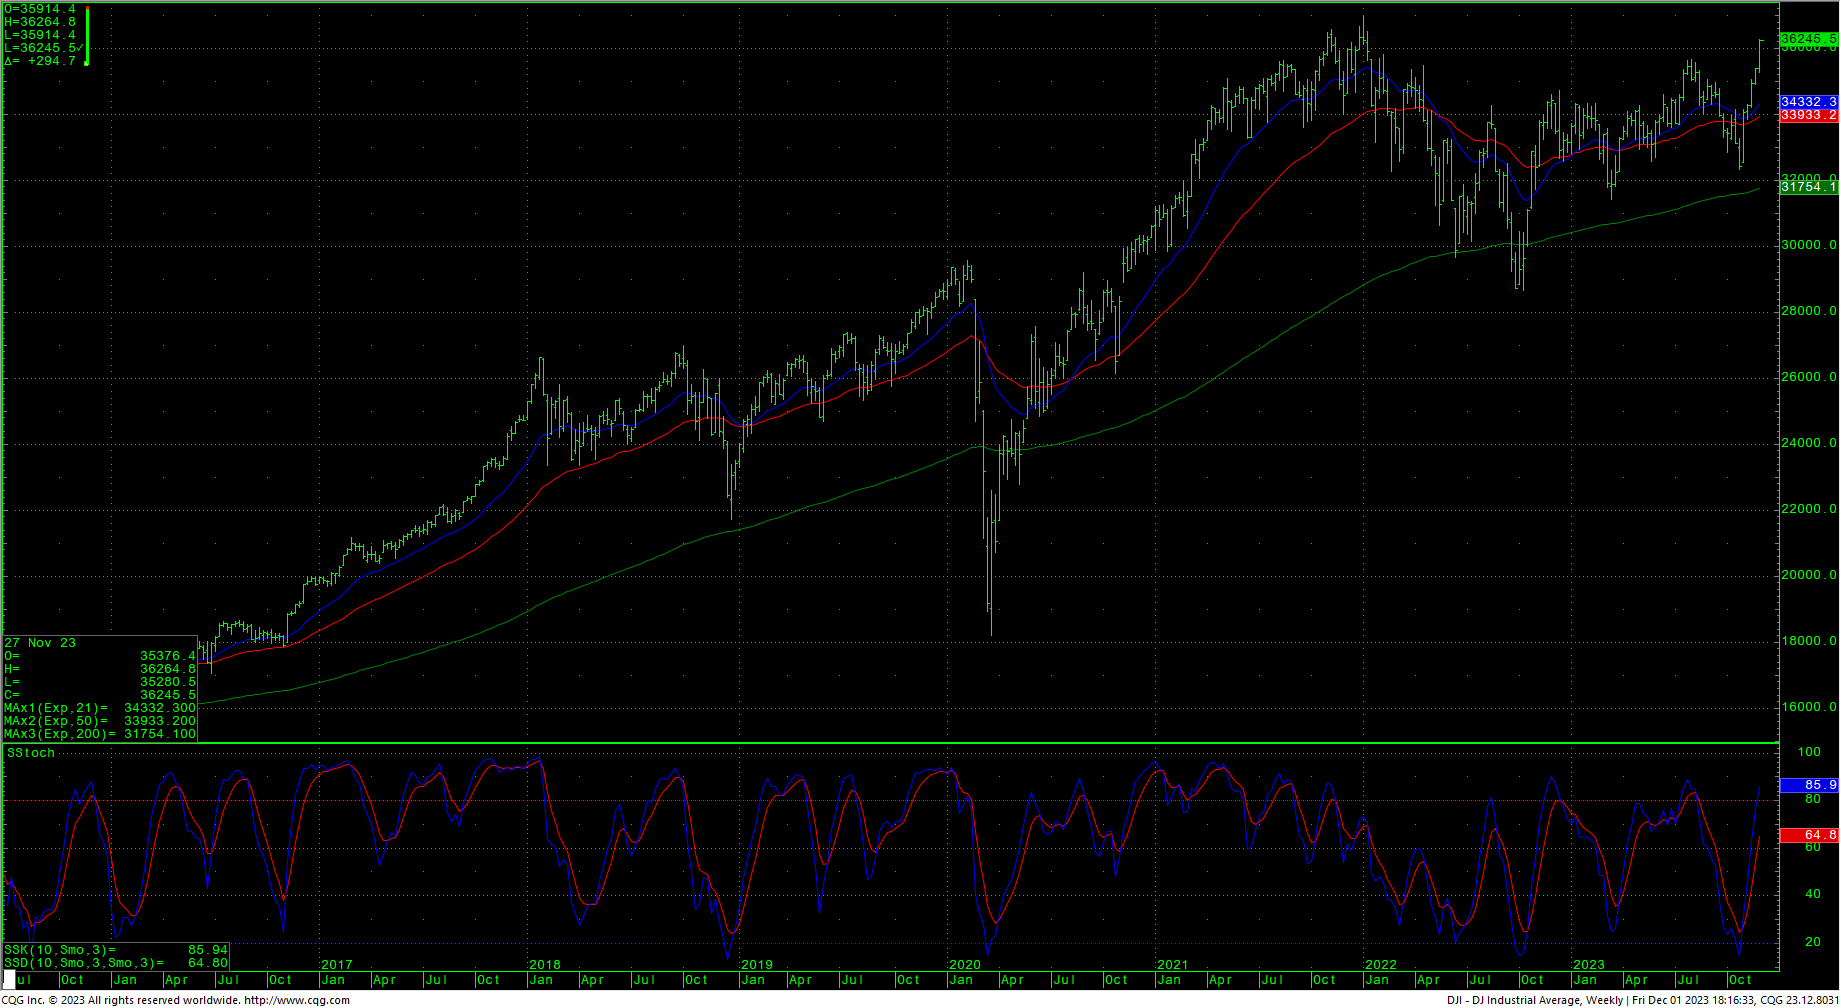
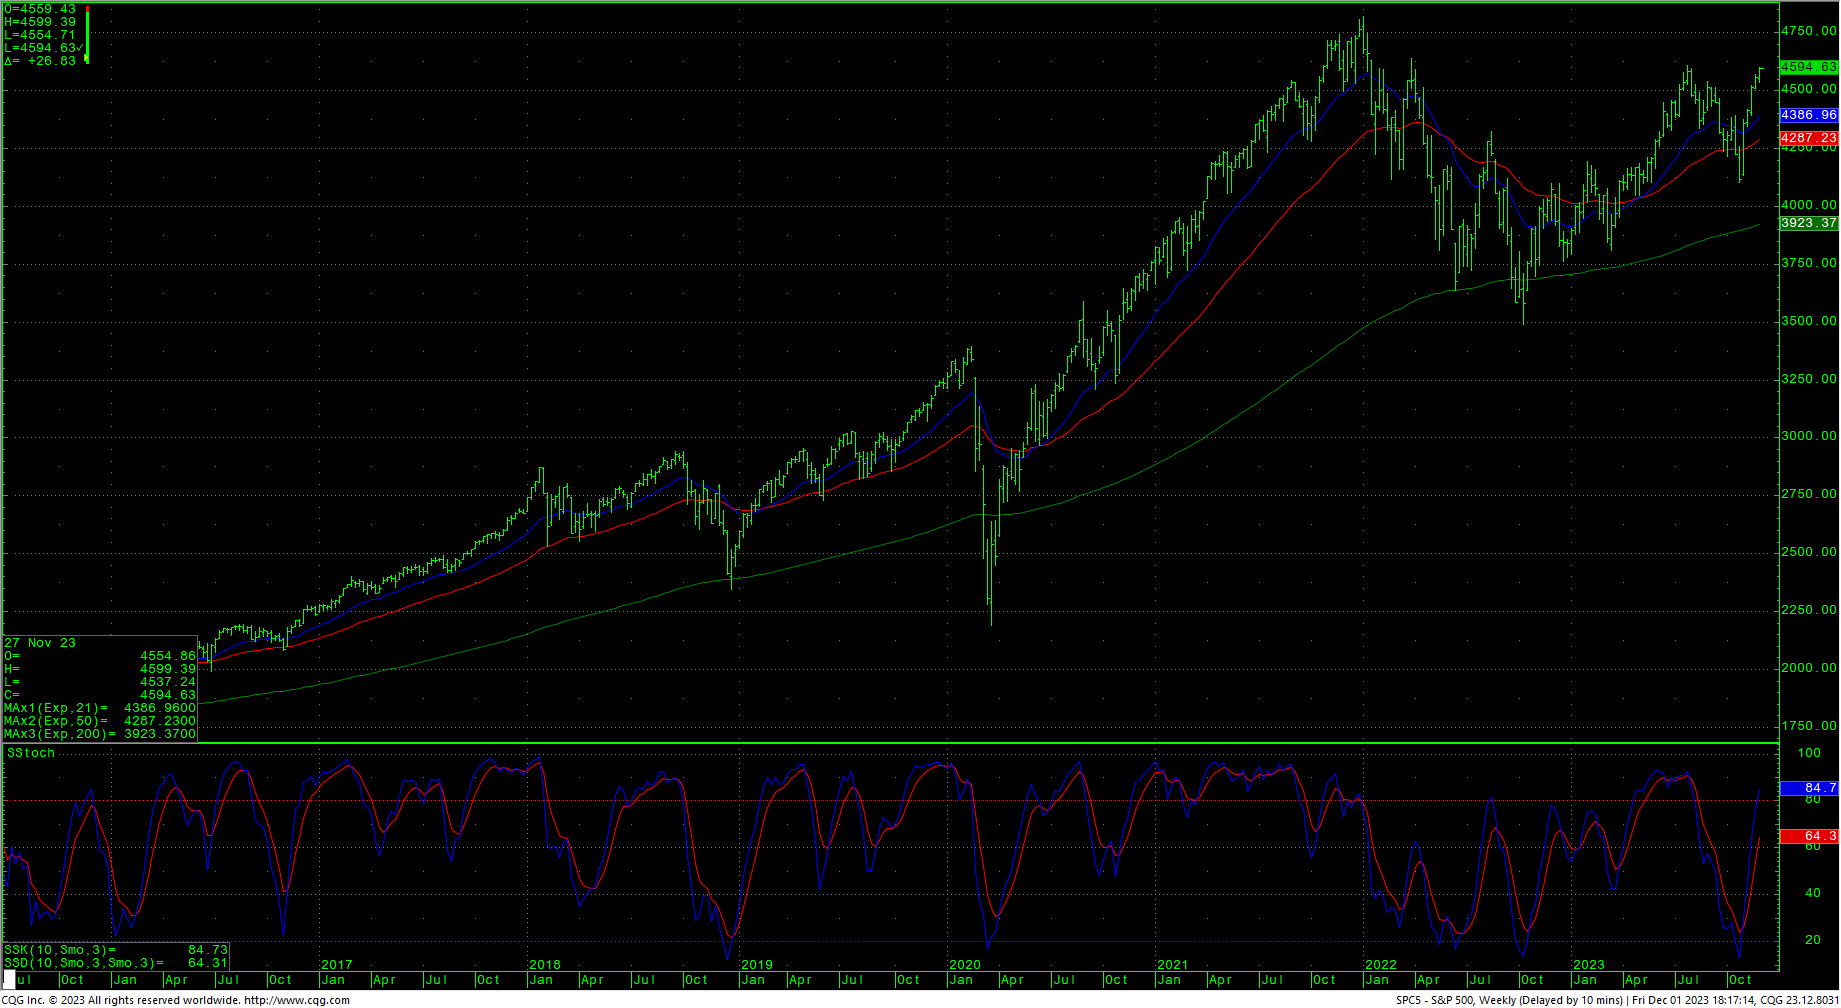
 The Dow close Friday is the highest daily close since 12 January 2022. The weekly close is just 100 points under the all-time record high close of 36338.3 set the week of 27 December 2021.The charts are now giving an upside target for the Dow at 38378.5. The S&P set new 2023 highs and closed at the highest weekly settlement since 10 January 2022. The daily close is the highest since 29 March 2022. Breadth is finally picking up with the largest move in stocks in 20 years. With it appearing that no major players are taking part in this rally, one has to think that FOMO will kick in somewhere with new highs?
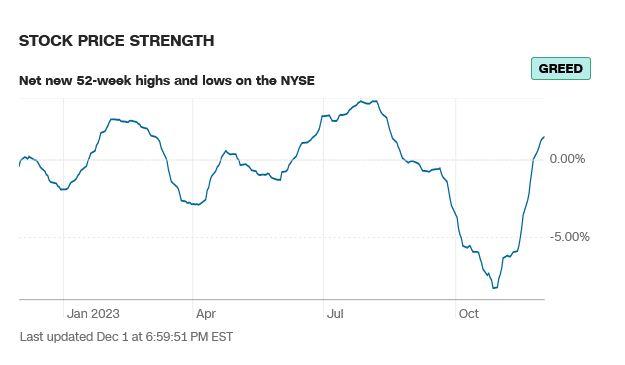
52-Week A/D Line
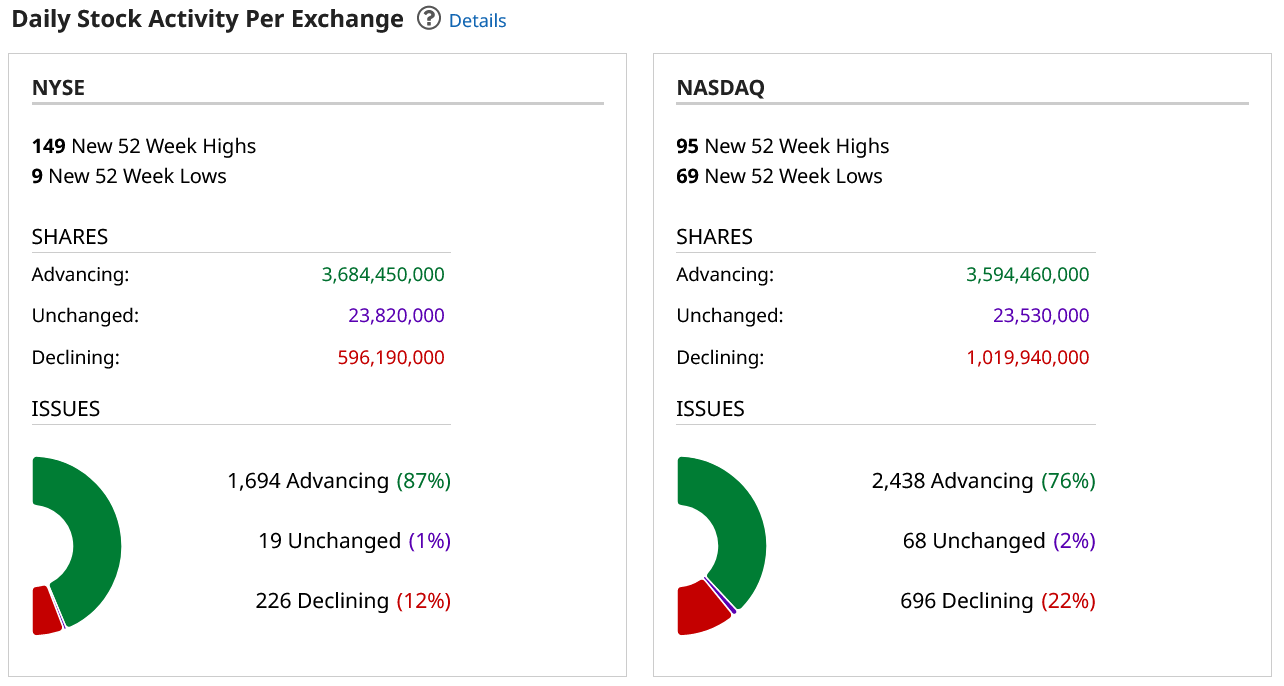
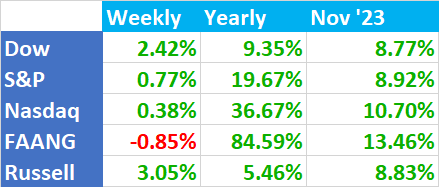
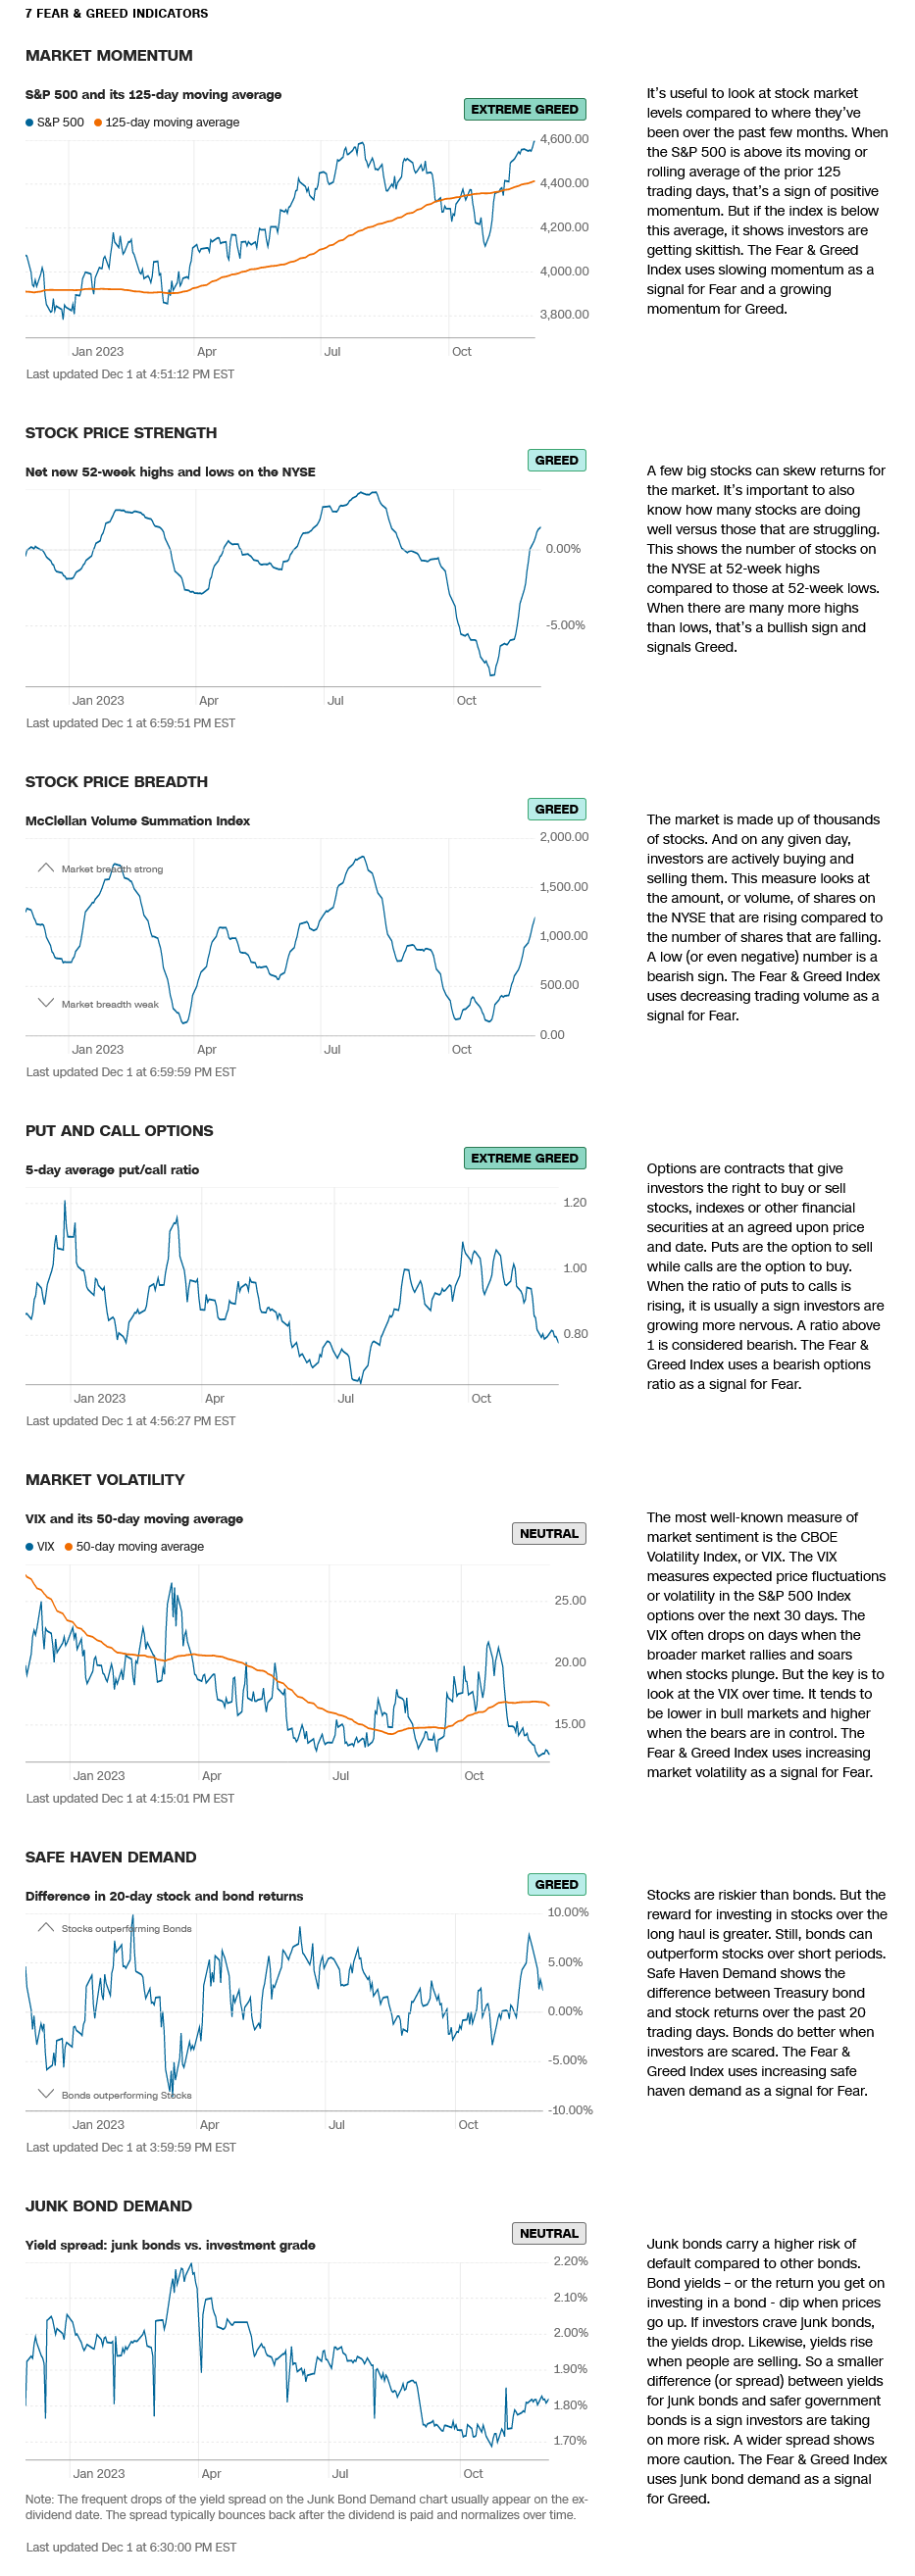
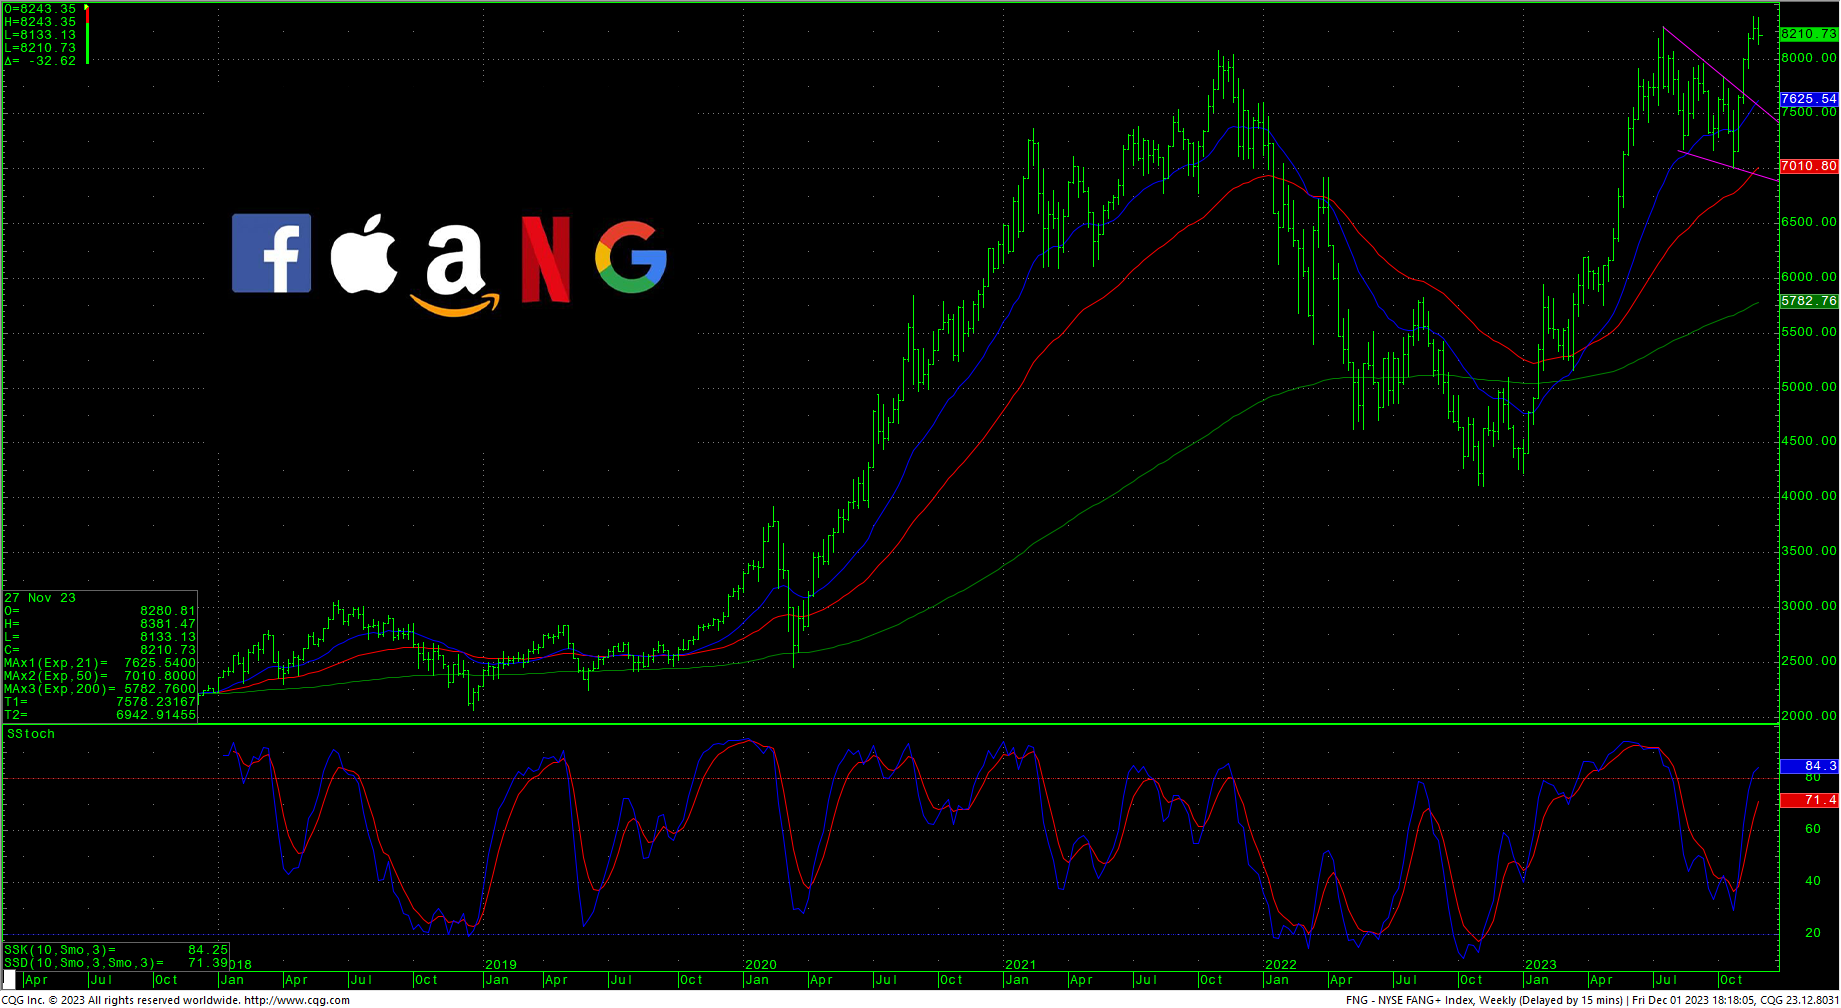
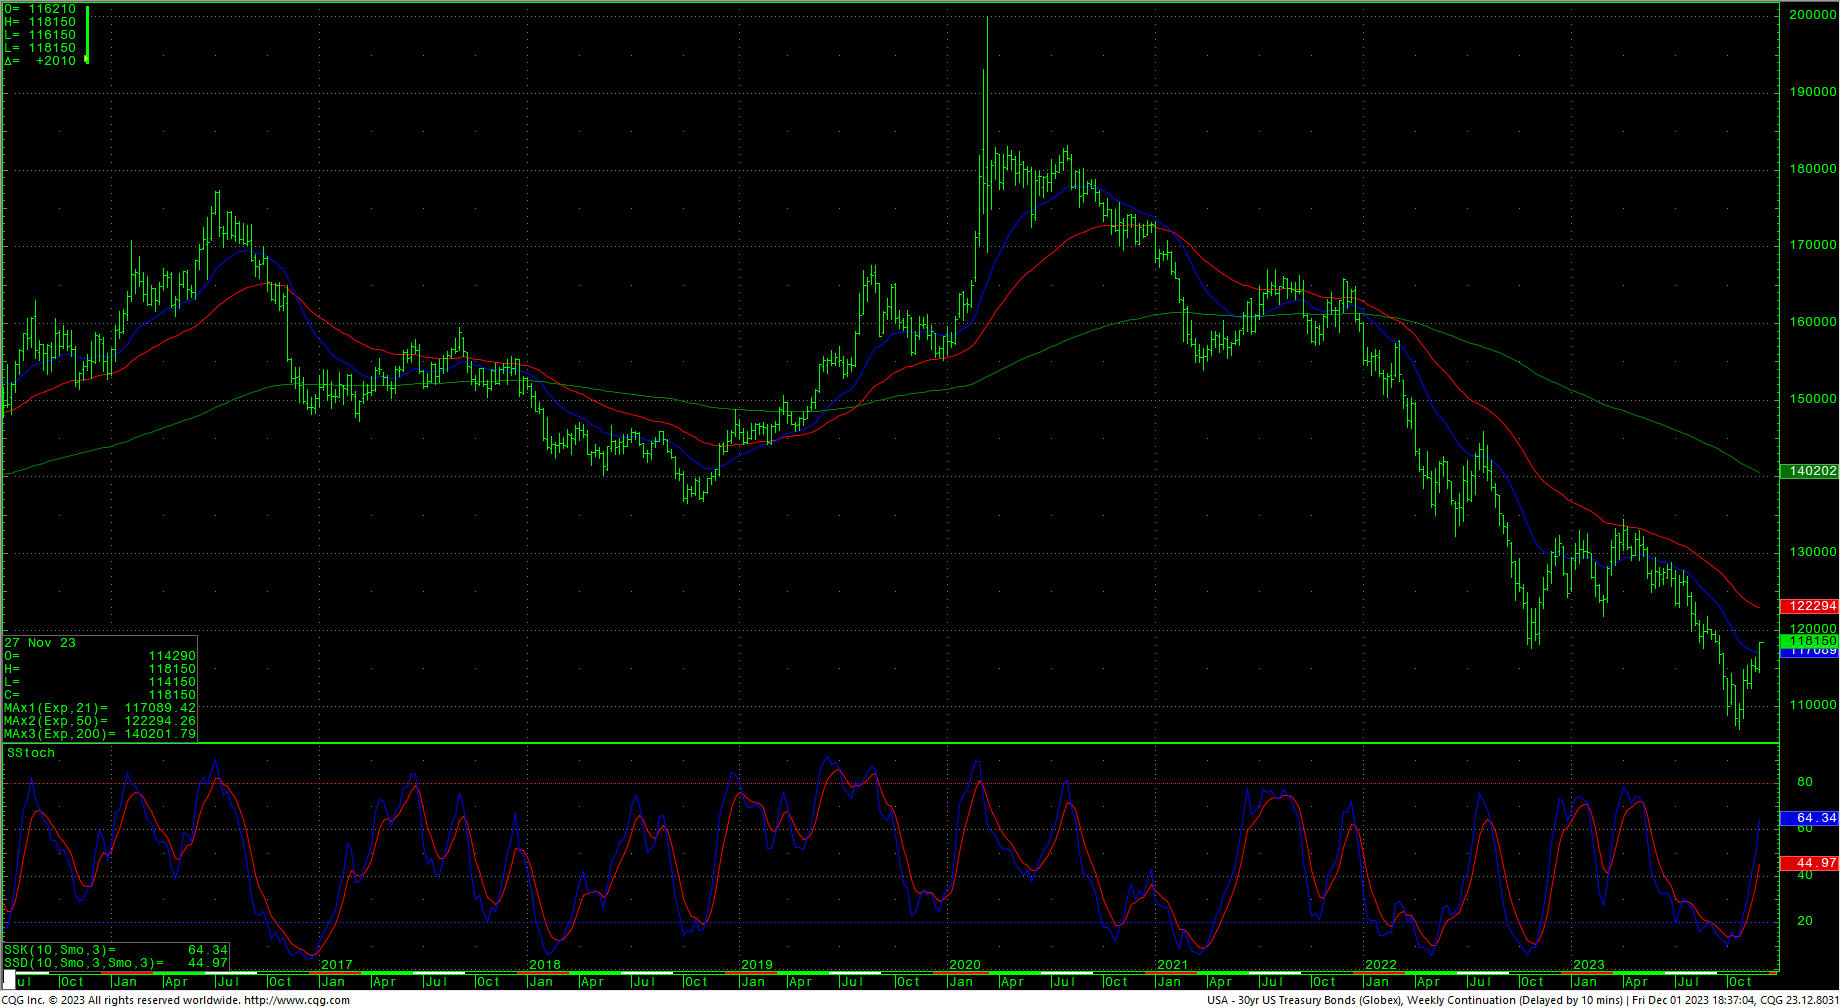
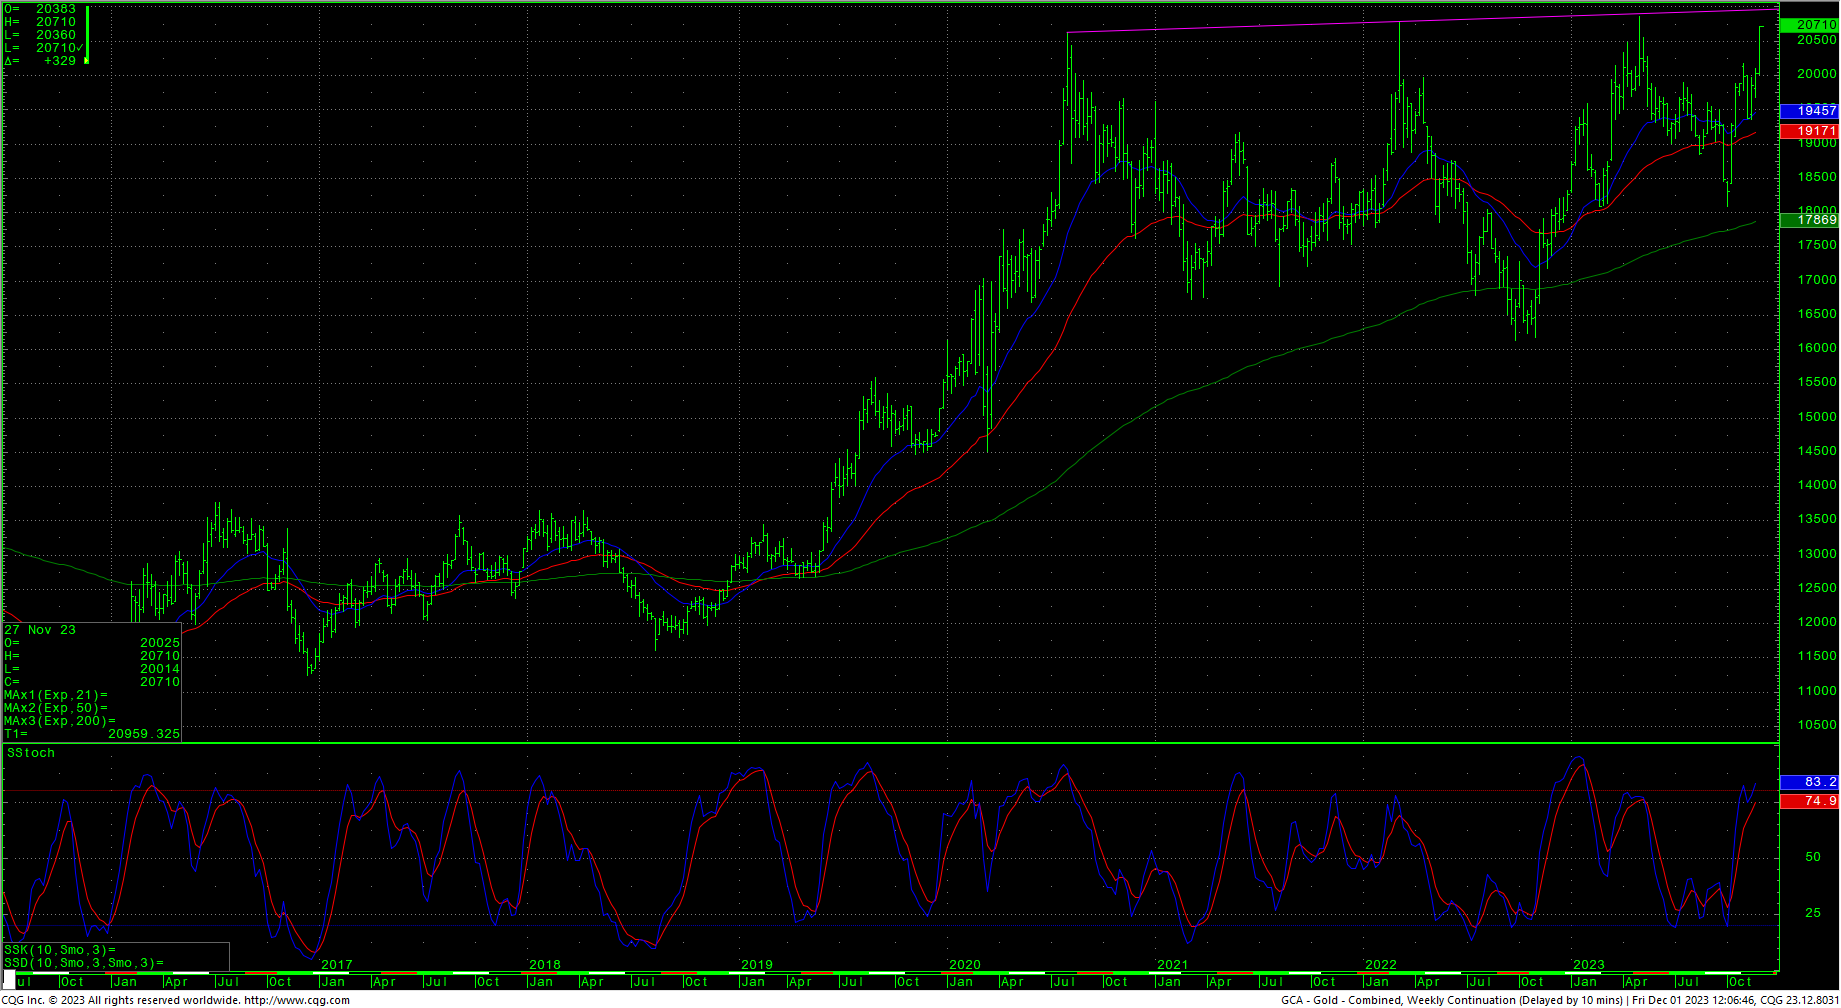
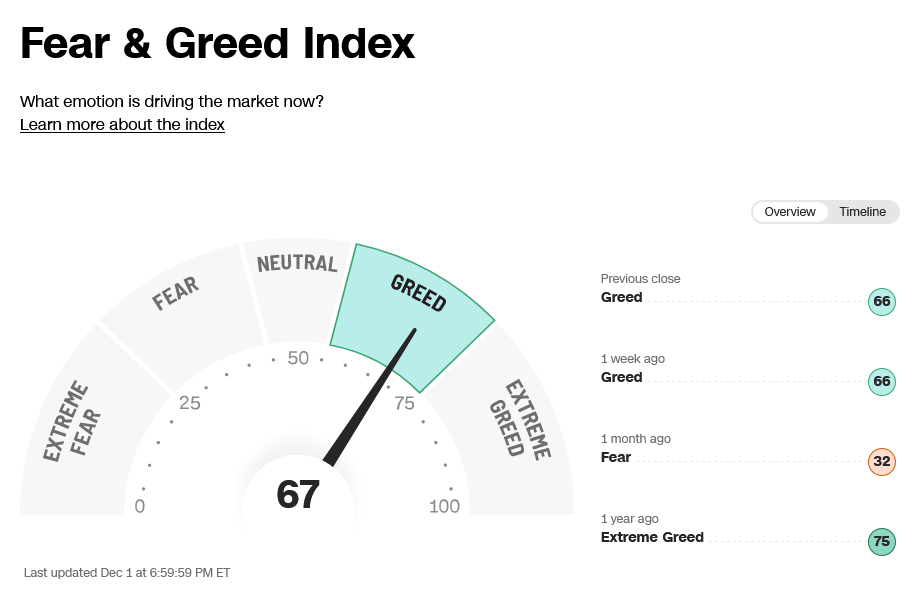
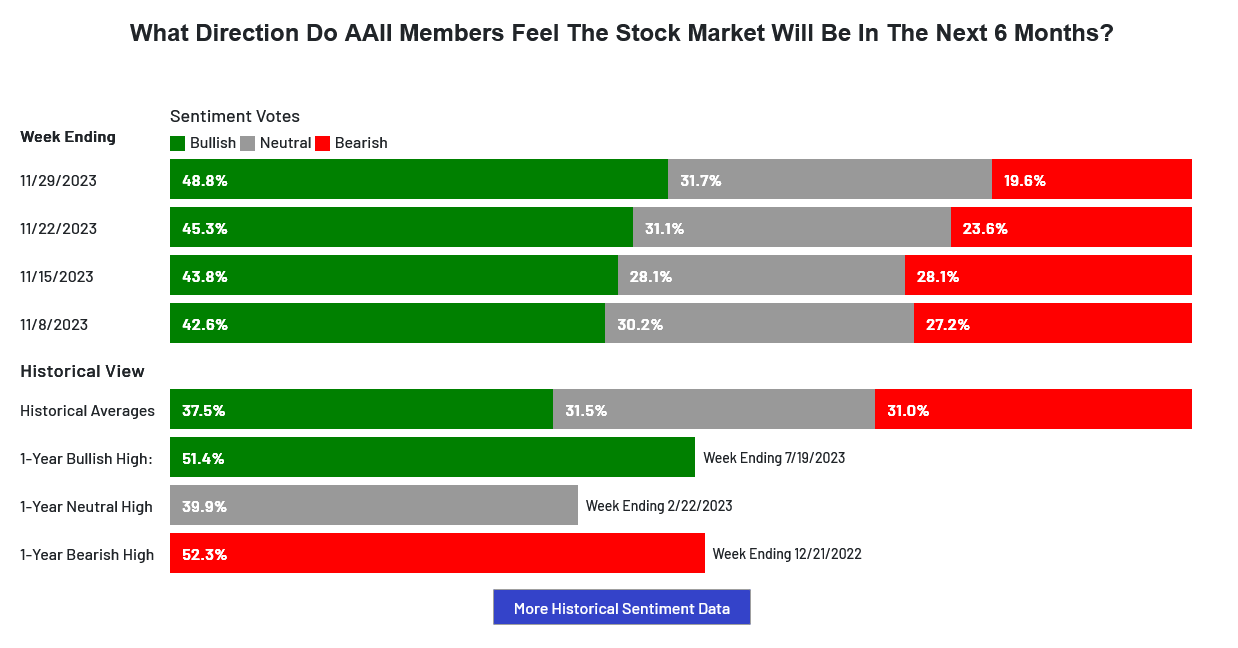
Sentiment has shifted back into greed readings, finally, even though it is next to impossible to see exactly where the buying has come from in this vertical. The AAII Sentiment Survey: Optimism Continues to Rise; Pessimism Reaches Lowest Level Since 2018. The VIX is testing the lowest readings since early 2020. The VIX also reflects the Put/Call ratio which stands at 0.78 which reflects extreme greed. The 52-week, A/D moved higher to +1.51% which still indicates greed. The Dow closed the week up +2.42%. The S&P was up +0.77%. The Nasdaq ended the week up +0.38%, the FANG closed lower as prices test record highs, closing down -0.85% while the Russell led all the indices higher, closing up +3.05%. The bond market moved into new trading highs as the 30-year daily chart filled in a gap left on 20 September 2023. The CRB closed lower, down -0.35%… crude oil reversed lower, settling on the bottom of the weekly range while gold moved into a new all-time record high close as that market is now threatening the triple-top pattern. The rule in technical analysis is that triple-tops are meant to be broken. The CoT is basically telling the story that big money continues to sit on the sidelines. Asset managers have added slightly in the past two weeks and commercials have started to do some buying. Timing-wise, Wednesday marks minor timing and the next critical timing point falls Christmas week on the 20th and 21st.
Timing Points
- 12/06 ***
- 12/12 ***
- 12/20-21 *** X possible extreme
- 12/28 **
- 01/04 **
- 01/08-09 *** X possible extreme
- 01/15 **
- 01/23-24 *** X Key week for financials
CNN Fear & Greed Index
AAII Investor Sentiment Survey
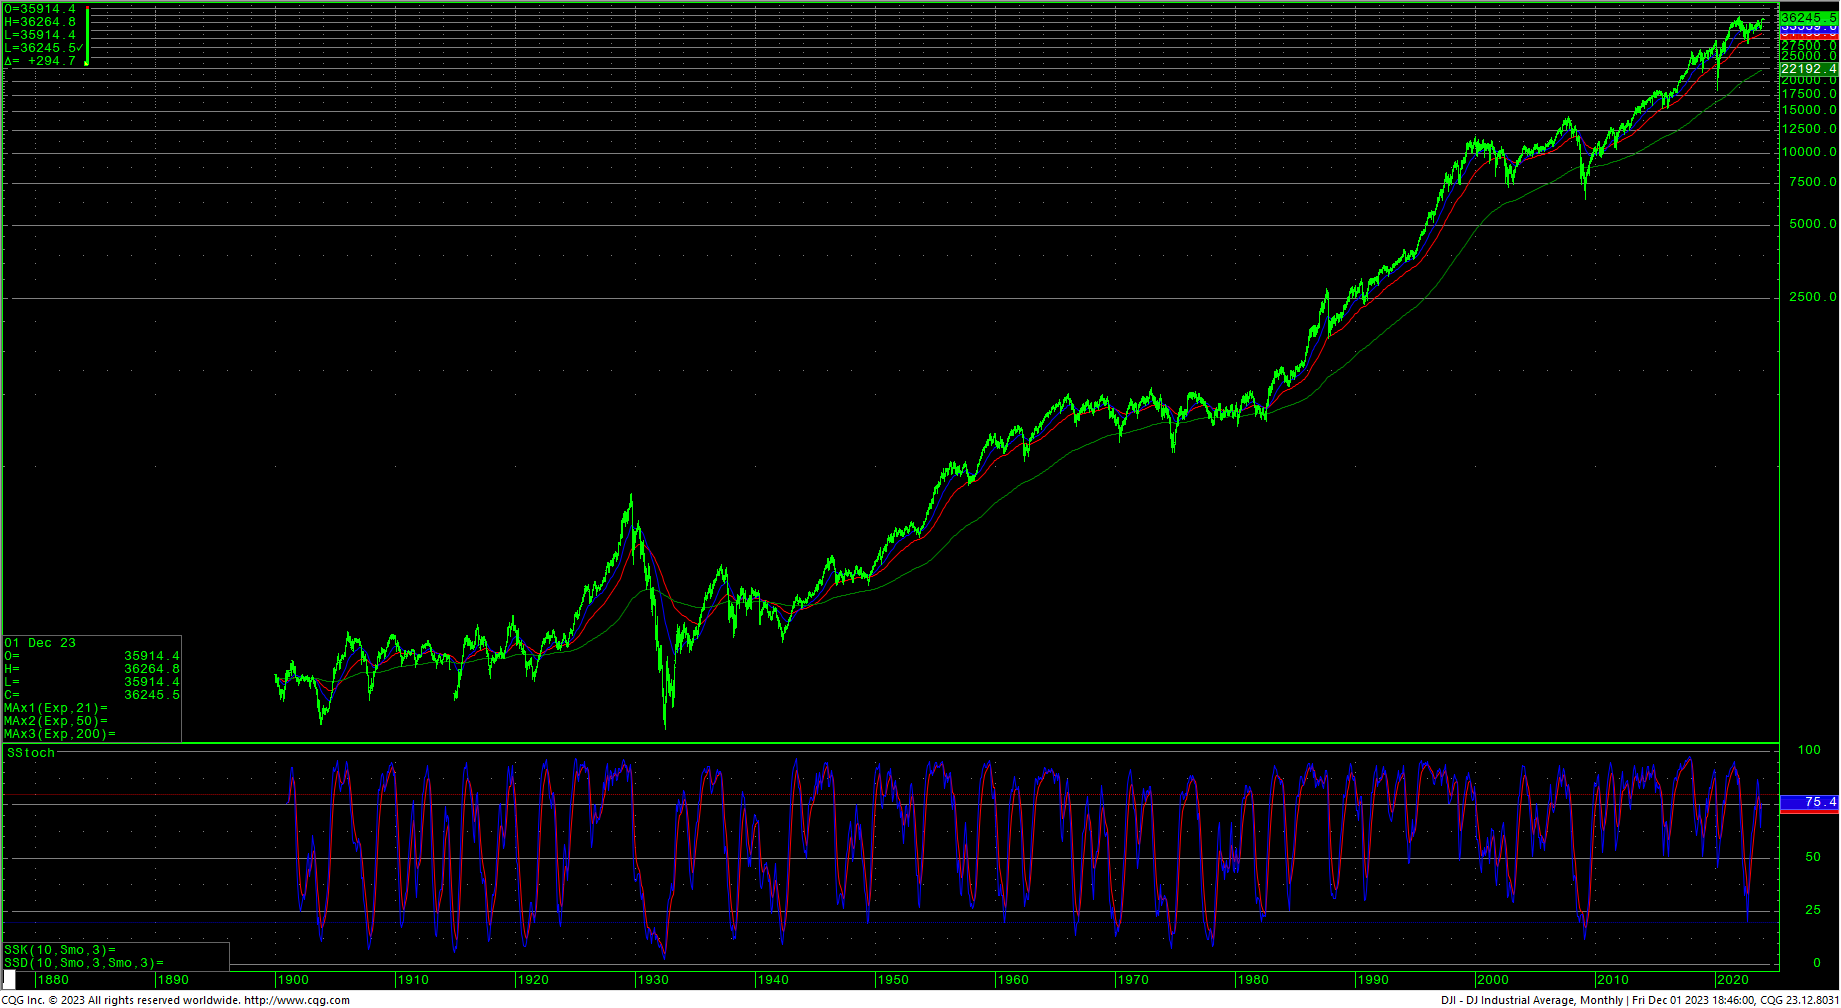
Dow Jones Industrial Average Monthly HLC Log Scale
Dow Jones Industrial Average Hourly HLC
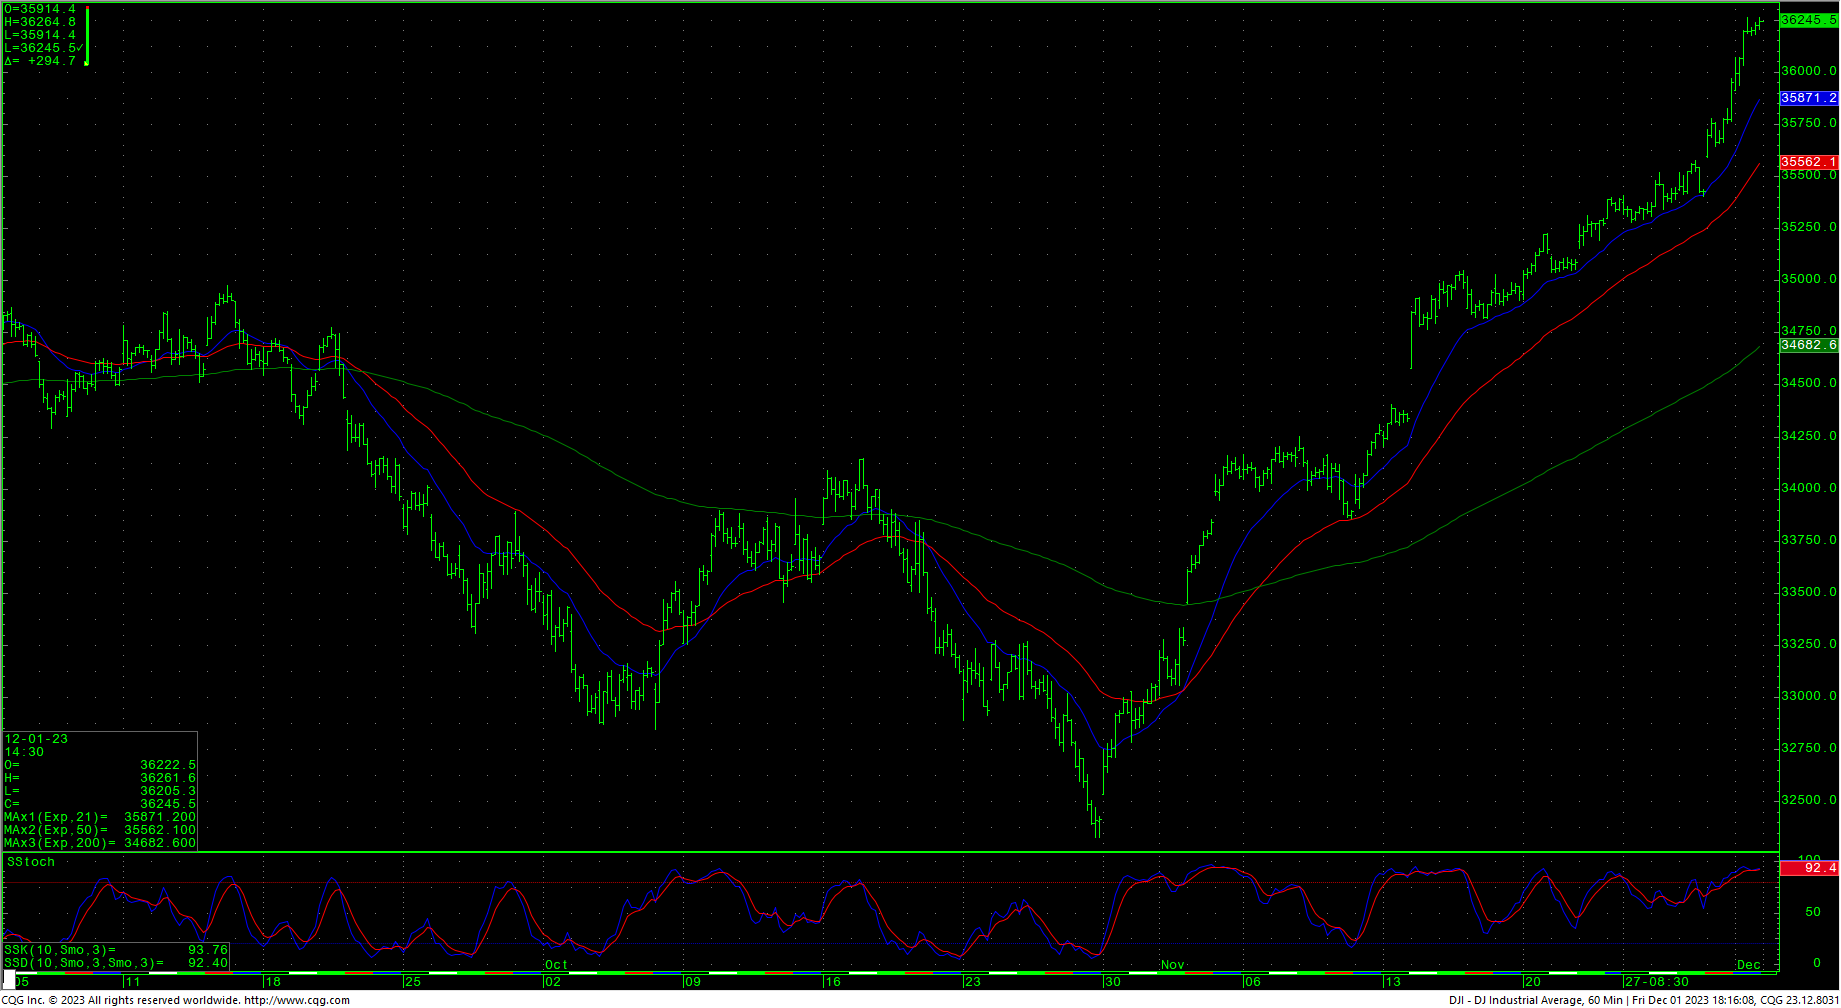
The Dow hourly is overbought on Friday’s close and the daily is also into overbought conditions. The weekly is in an up trend and the monthly stochastics are hooking back up with the new highs. The market has filled in a long-standing gap from early 2022 at the highest close since 12 January 2022. Prices are poised for a test of 36513 area with potential to test the all-time record highs at 36952. Closes into new highs give two objectives, one at 37095 and long-term targets at 38378.5. Closes over 38378.5 offer counts to targets at 40245.4.
Support is at 35911, 35692, 35516, and 35339/35330. Closes under 35330 should test 34760. A breakdown under 34760 suggest a move to 34296 with counts into critical short-term support of 33831/33825. Closes below 33825 setup 33360. Closes under 33360 open counts to 32462 through 32327. A breakdown with closes under 32327 is bearish and opens counts into the 31565/31555 area.
Dow Jones Industrial Average Weekly HLC
Resistance
- 36271 **
- 36390 **
- 36513 ***↑
- 36636 **
- 36934/36952 *** ↑
- 37095/37096 *** ↑
- 37240 **
- 37384 **
- 37528 ***
- 37672 **
- 37816 **
- 37960 ***
- 38104 **
- 38248 **
- 38378.5 *** ↑ TARGET
- 40245.4 *** ↑ TARGET
Support
- 36032 **
- 35911 **
- 35692 ***
- 35592/35579 *** gap ↓
- 35516 ***
- 35339/35330 *** ↓
- 35269 **
- 35155 ** ↓ gap
- 35118 ** fills gap
- 35038 ** ↓
- 34906 **
- 34818 **
- 34760 *** ↓
- 34581 ** gap ↓
- 34405 *** fills gap
- 34296 *** ↓
- 34163 **
- 34000 **
- 33831/33825 *** ↓
S&P 500 Cash Index
The S&P hourly is reaching overbought conditions on Friday’s close. The market is now bumping up against the trading highs for 2023 as it set a new closing high for the year. The July high is 4607 and resistance is key at 4607 and 4637. A breakout with closes above 4637 opens potential toward 4748 and ultimately 4818. Above the record highs opens counts to 4952/5000 with potential to 5144. Closes over 5144 set up a drive to 5288 with counts to 5432.
Support is at 4539, 4501, 4471 and pivotal near-term at 4441/4436. A breakdown under 4436 should test 4410 with potential to 4351. Closes under 4351 should carry to 4293/4290. A breakdown under 4290 can test 4180. Daily closes under 4180 set up a move to 4049. Daily closes under 4049 open counts to critical long-term support of 3917/3910. Daily closes below 3910 open counts to 3815 and 3770/3754 with potential to monthly support at 3505/3491.
S&P 500 Index Weekly HLC
Resistance
- 4599 **
- 4607 *** ↑
- 4637 *** ↑
- 4665 **
- 4748 *** ↑
- 4818 *** ↑
- 4826 **
- 4849/4850 *** ↑
- 4952 ***↑
- 5000 *** ↑
- 5072 **
- 5144 *** ↑
- 5216 **
- 5288 ***
- 5360 **
- 5432 *** ↑
Support
- 4554 **
- 4539 **
- 4501 *** ↓
- 4471 ***
- 4441/4436 *** ↓
- 4410/4408 *** ↓
- 4389 **
- 4351 *** ↓
- 4334 ** gap
- 4319 ** fills gap
- 4312 *** ↓
- 5293/4290 *** ↓
- 4270/4260 *** gap ↓
- 4238 **
- 4220 *** ↓
- 4195 *** ↓ hourly gap
- 4180 ***
- 4103 **
- 4049 *** ↓