
Technical Analysis
Major Indices Week of March 8, 2024
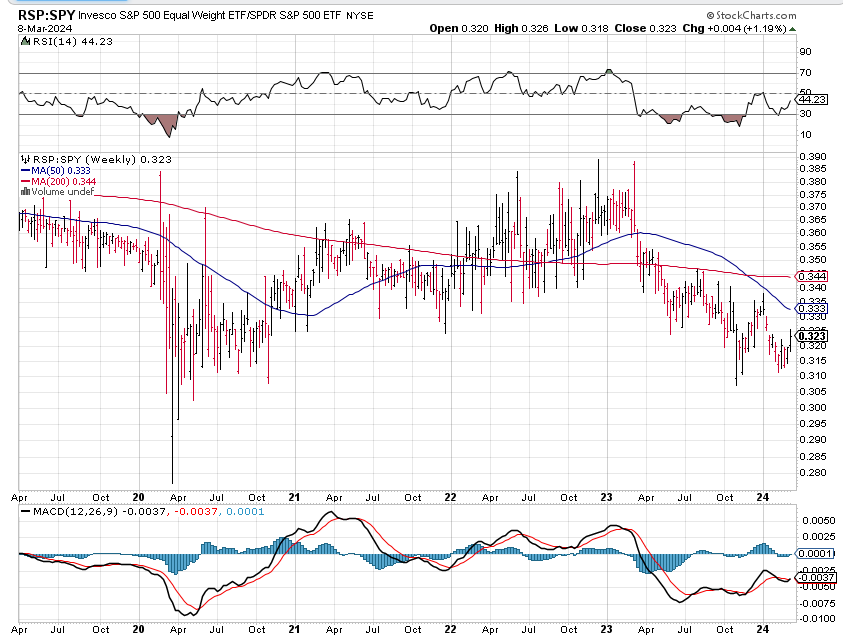
Stocks closed mostly lower with Friday marking new record highs for some indexes, NVDA, and then a massive loop-the-loop, outside day down as prices swooned from the highs. All the major indices ended the week lower with the exception of the Russell which eked out a small gain, keeping the potential double bottom in the RSP:SPY alive.
“Sellers have gotten a foothold and have found an area for battle, notching a few wins the past two weeks.”
Stocks closed mostly lower with Friday marking new record highs for some indexes, NVDA, and then a massive loop-the-loop, outside day down as prices swooned from the highs. All the major indices ended the week lower with the exception of the Russell which eked out a small gain, keeping the potential double bottom in the RSP:SPY alive.
TECHNICAL ANALYSIS (by Intraday Dynamics)
Stocks closed mostly lower with Friday marking new record highs for some indexes, NVDA, and then a massive loop-the-loop, outside day down as prices swooned from the highs.
- The USCI Commodity Index broke out above the upper end of a massive triangle.
- Tuesday marks minor timing. The next strong timing date is the 19th.
- The Dow closed lower Friday at the bottom of the day’s range.
- Tuesday marks minor timing. The next strong timing date is the 19th.
- Resistance is 38789 and 38868/38875.
Dow Jones Industrial Average Hourly HLC
Stocks closed mostly lower with Friday marking new record highs for some indexes, NVDA, and then a massive loop-the-loop, outside day down as prices swooned from the highs.
1.
Sellers have gotten a foothold and have found an area for battle, notching a few wins the past two weeks.
2.
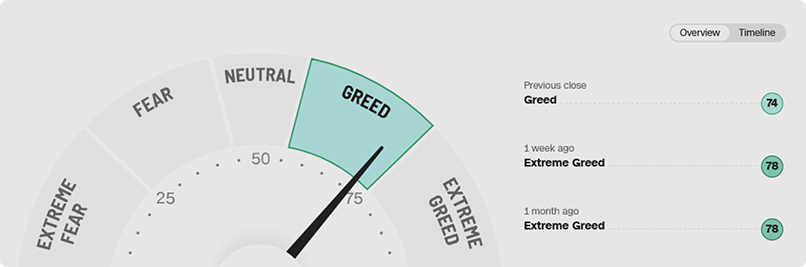
Sentiment remains greedy/frothy with the AAII setting one of the highest levels of optimism in quite awhile.
3.
The weeklies are overbought and the dailies, while they may be in a running correction, are dealing with bearish divergences on the oscillators.
The Dow closed lower Friday at the bottom of the day’s range. The hourly is neutral. The daily is still flashing bearish divergence and the weekly is overbought while the monthly is currently trading an inside month with the stochastics validating the rally. A case can be built for a possible sloping head and shoulders on the hourly. Prices are now back under the longer-term target area of 39075.
Dow Jones Industrial Average Weekly HLC
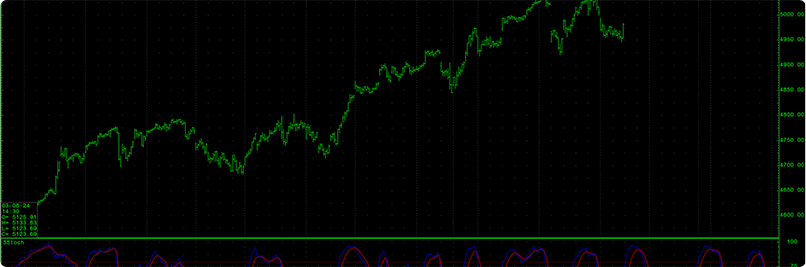
Resistance is 5144, 5154 and 5161/5163. Rallies over 5163 can carry to 5171/5172 with potential to retest the intraday highs at 5189/5190. Closes over 5190 set up a drive to 5288 with counts toward 5432.
S&P 500 Index Weekly HLC
Support is at 5092 though 5080 where there is a gap. A breakdown under 5080 sets up a move to 5054 with potential to 5023/5020 with gap support of 5038. A breakdown under 5020 sets up a move to 4987/4983.
Resistance
Support
- 5140/5144 *** ↑
- 5162 **
- 5180 **
- 5140/5144 *** ↑
- 5198 ***
- 5140/5144 * ↑
- 5140/5144
- 514 ↑
- 5140/5144
- 5140/5144
- 5117 **
- 4933/4920 *** ↓
- 4956 **
- 5140/5144 *** ↑
- 5038 *** ↓ hourly gap
- 4933/4920 *** ↓
- 5086/5080 *** ↓fills gap
- 5140/5
- 5140 *** ↑
- 5140/5
The Dow closed lower Friday at the bottom of the day’s range. The hourly is neutral. The daily is still flashing bearish divergence and the weekly is overbought while the monthly is currently trading an inside month with the stochastics validating the rally. A case can be built for a possible sloping head and shoulders on the hourly. Prices are now back under the longer-term target area of 39075.